What Is Customer Retention? Definition, Examples, & Tools
Discover how to improve customer retention by leveraging retention metrics and implementing customer retention strategies.
Browse by Category
Customer retention is a measure of how many customers stay with your business for the long term. It’s what demonstrates your business’s ability to stimulate customers to make repeat purchases and spend more money on your products and services over time.
Ask yourself (and your team):
- What brings your users back to your product at a sustainable frequency?
- What value are they finding within your offerings that they can’t get elsewhere?
- How would you retain a newly acquired set of users within the first week of usage?
Product managers, marketers, and design teams need to be analytical and diligent about customer retention to keep their users coming back. Why? Because retaining customers boosts customer lifetime value (LTV), stabilizing product revenue in the long run.
Key takeaways
- Building up customer retention takes time because you’ll need to earn the trust of your customers, which is a long and non-linear process. Be patient and focus on developing strong relationships with your customers by consistently meeting and exceeding their needs.
- It’s a given that products that provide a valuable customer experience are more likely to retain customers, so invest in creating amazing experiences for your customers, and never discount the value of delighting them at every stage of the buyer’s journey.
- Use data to drive and optimize your client retention rates. Identify the key drivers for retention that are unique to your business, and democratize the first-party data you need to calculate retention metrics accurately.
What is customer retention?
At the simplest level, customer retention is a measure of how many users keep coming back to use your product or service over time. This metric reflects your business’ ability to prevent users from going to competitors and encourage them to make repeat purchases or continue habitual use of your product, contributing to the long-term success of your business.
In order to measure customer retention, you’ll need to know the critical event and the product usage interval.
The critical event is an event or action the user performs within your product that signals they’ve been retained. In order to determine the critical event, you need to ask yourself the following questions:
- What one action do you critically need or want the user to do when using your product?
- Which KPIs are you ultimately trying to drive as a company, and what user action can be linked to them?
- If you have different product offerings, what are the success criteria for each?
For example, to measure sales retention at Airbnb, the critical event would be the act of booking a reservation. For the company to grow, hosts need to list an accommodation, and users need to book reservations, constantly. Users that solely browse through accommodation listings on the app contribute nothing to the success of the business if they are not performing the critical event.
The product usage interval is how frequently a user uses the product itself. Customer retention can only be calculated when the critical event is seen against a period of time. In order to determine the product usage interval, you’ll need to:
- Identify the number of users who repeated the critical event at least twice within a certain time period. Amplitude recommends using a time period of 60 days since usage intervals rarely go beyond one month. This means we expect users to perform the critical event at least twice within 60 days.
- Calculate how long it took users to come back and repeat the critical event for the second time.
- Calculate the number of users that repeated the critical event for the second time.
- Identify the time interval at which 80% of the users have repeated the critical event. This is your product usage interval.
Some products are built to be used daily, like social networking apps or casual gaming, while others are used less frequently, such as tax preparation or grocery delivery apps. You need to calculate the time it takes users to repeat the critical event to understand the product usage interval.
Ways to visualize customer retention
With the information above, there are three ways to visually represent and measure customer retention rates:
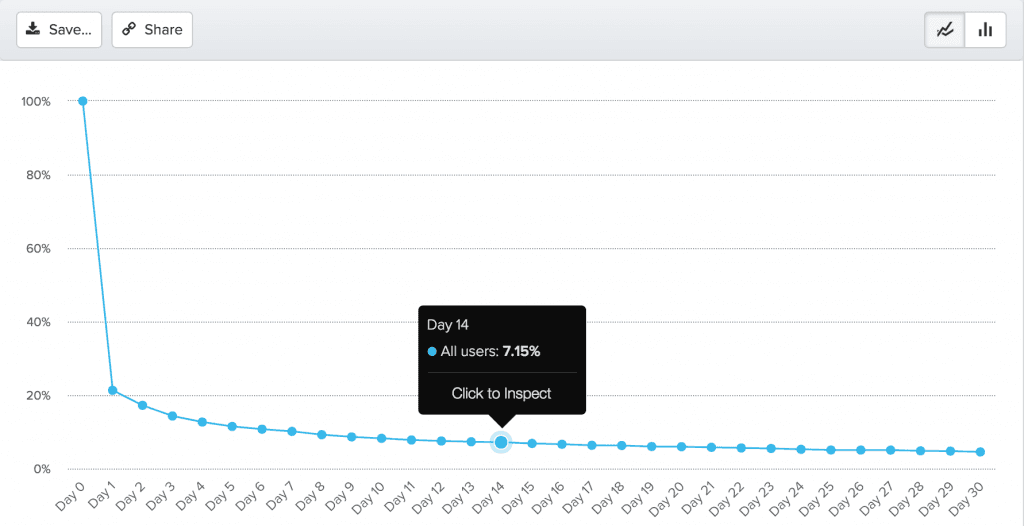
N-Day Retention: Shows you what percentage of users come back on a specific day. For example, in the graph below, 7.15% of users come back on Day 14.

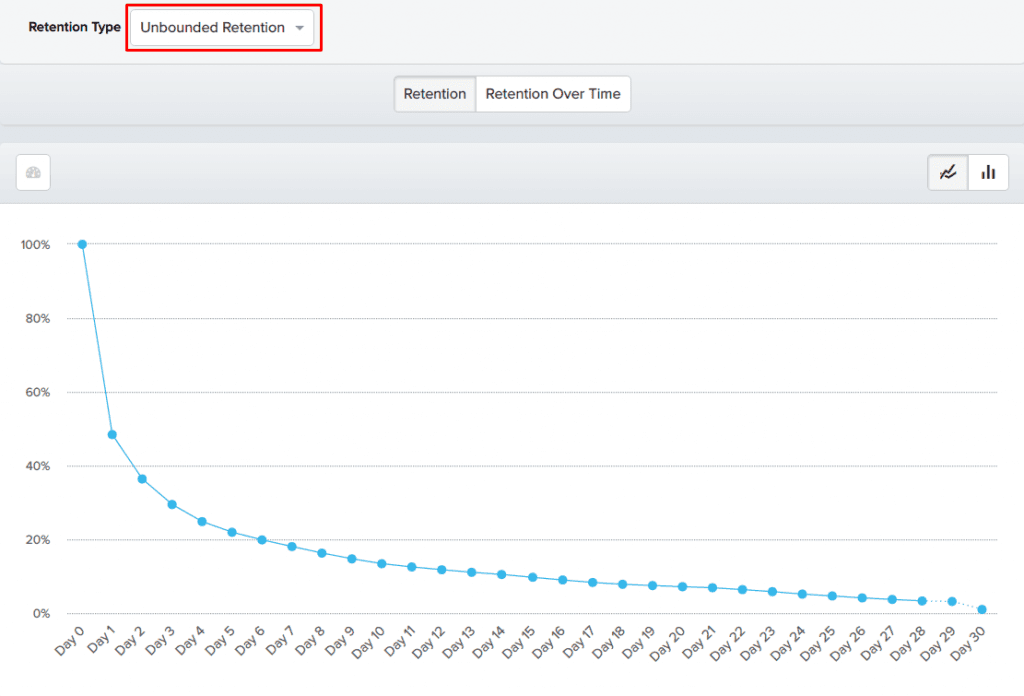
Unbounded Retention: Shows you what percentage of users come back on a specific day or later. For example, in the graph below, 50% of users come back on day 1 or later. This number reflects the percentage of users who come back on day 1 or any time after day 1.

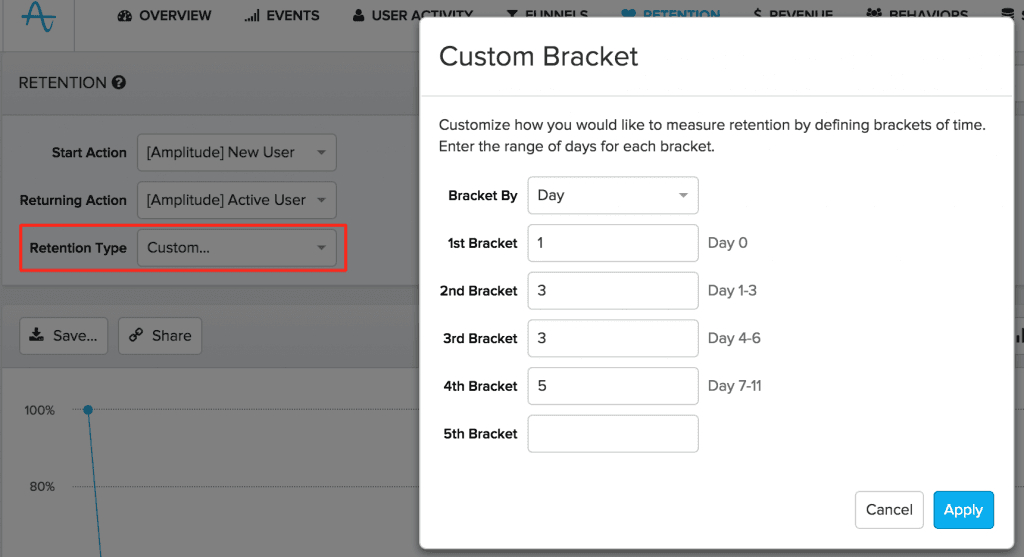
Bracketed Retention: Allows you to choose a time bracket from a specific day, week, or month and view the retention graph for that time bracket. For example, you could set the first bracket as day 0 and the second bracket as day 1-3. Amplitude will measure what percentage of users return during each time bracket, as can be seen in the image below.

To measure retention appropriately truly depends on your business. If you’re providing a grocery delivery service, seeing sales retention on a certain day (N-Day Retention) may not be useful since people usually use a grocery delivery service infrequently or once every couple of days. For this reason, the unbounded retention curve would be more relevant since you’ll be able to see what percentage of users return to your service after interacting with your product on a certain day.
The importance of customer retention
Customer retention contributes to the long-term viability of your business by decreasing costs and helping you establish a steady source of revenue.
Acquiring a new customer can be up to 25 times more expensive than holding on to an existing one. Existing customers already have a relationship with your company and a track record of trust you’ve built with them over time. Customers who repeatedly buy from you and choose you over competitors are loyal—and loyalty pays off. Loyal customers are more likely to become advocates and spread the word about your product or service.
Without customer retention, your product or service is essentially a colander—no matter what you pour into it, it will all eventually drain out. So, using the same metaphor—no amount of new customers will contribute to the long-term success of your product if you fail to retain them. You need to demonstrate value to your customers early and often in order to turn them into habitual users of your product for the long term.
Key customer retention metrics
Identify which success metrics you’ll need to track in order to measure the viability of your customer retention efforts and adjust business strategies accordingly. Important metrics include:
Customer retention rate
Customer retention rate refers to the percentage of existing customers who remain loyal to your business over time, pointing to the stability of the business’s revenue over that period.
The formula for customer retention rate is: [(E – N)/S] * 100, where E is the number of customers at the end of a time period, N is the number of new customers gained within the same time period, and S is the number of customers at the beginning of the time period.
Customer churn rate
Customer churn rate is the percentage of customers who stop doing business with the company over a specific time period. It’s basically the inverse of the customer retention rate. Customer churn rate is important because it helps you understand how effectively you’re able to retain customers. If the churn rate is high, you know you have to take steps to understand why customers leave.
The formula to calculate customer churn rate is: [Y/X] * 100, where Y is the number of customers lost during that time period and X is the number of customers at the start of the time period.
Customer lifetime value (CLV)
Customer lifetime value shows how much profit the customer contributes to the company during their entire time doing business with the company. CLV is an important metric because it points to whether your company needs to encourage customers to make additional purchases. If CLV is low, you can invest in loyalty programs to stimulate repeat purchases. If CLV is high, you would have the capacity to spend more money on new customer acquisition.
There are a few different formulas to calculate CLV. One formula is: (Average order value * Repeat purchase rate) – Customer acquisition cost. The second formula is: (Average number of transactions in a time period * Average order value * Average gross margin * Average customer lifespan)/Total number of customers.
Revenue churn
Revenue churn refers to what percentage of monthly recurring revenue (MRR) you lost over a time period. Revenue churn is extremely important since you learn the exact dollar amount you’re losing when customers leave your business. The actual number of customers doesn’t mean anything until you calculate what each customer is worth to your business. Knowing how much money you’re losing puts the churn into context.
The formula for Revenue Churn is: (MRR lost within a time period/MRR at the beginning of the time period) * 100.
Net promoter score (NPS)
Net promoter score tells you how many of your customers are likely to recommend your product or service to someone else. It’s a tool for measuring customer loyalty and how popular your product or service is among your customers. A low NPS means your customers aren’t likely to recommend your product to someone else and signals a low rate of customer satisfaction, posing a risk to your business. Knowing this score might help you predict churn even before it happens, so you can take precautionary steps to prevent it.
While there’s no formula for calculating NPS, it’s a score that’s generated when customers pick a number on a scale of one to ten while rating how likely they are to recommend your product to someone else. This is done via NPS surveys.
Repeat purchase rate
Repeat purchase rate is the percentage of customers who transact with you again after completing their first purchase. This metric is very useful for companies that have no fixed contracts with customers, like online retailers. They’re able to gauge how many customers are repeat buyers and how many are not, putting them in a position to start optimizing repeat purchases.
The formula to calculate Repeat Purchase Rate is: Number of return customers/Total number of customers
5 methods to improve customer retention
Customer retention begins with delighting customers. Seventy-seven percent of customers report being more loyal to companies that offer a good customer experience, and 72% of customers say they’re willing to spend more on a company that provides a good customer experience. In order to increase customer retention, you need to implement strategies that boost customer loyalty and improve customer LTV.
1. Focus on current and dormant users more than new users
Retaining existing and dormant users is easier than gaining first-time users since you have or have had an existing relationship with them. Focusing on existing and dormant users is a smart approach to boosting customer retention since there’s more relationship data available on these two cohorts of customers.
Focus on these groups of users by creating behavioral personas and analyzing the behaviors, habits, and product features that keep each cohort coming back to transact with you. Then find other opportunities to implement and replicate the features that keep them coming back.
For example, if you know existing users are more likely to buy when a purchase button on your site is orange in color, it’s possible to optimize this and ensure all purchase buttons are orange in color to entice these users to buy more.
2. Give customers a voice and implement their feedback
Focus on combining the insights of your customer service team with direct feedback from your customers. Gather direct feedback from your customers through surveys, the comments they make on social media, and what they’re saying about you on online forums.
You’ll also learn a lot about your customer’s needs when you analyze how they’re interacting with your company at different touchpoints. For instance, you may learn they don’t like interacting via online chat support and prefer to give customer support a call to resolve any issues. You can then focus on improving your call-in customer service options.
Empowered with this knowledge about customer needs, likes, and dislikes, you’re able to make product or service improvements that help satisfy and retain your customers.
3. Offer personalized and efficient customer support interactions
Your customer support team should be able to pull relevant customer information to get context and deliver personalized interactions with your customers. A personalized interaction shows you’re interested in building a human relationship, not just a transactional one. And when your relationships are more human, it’s more likely you’ll retain your users.
Invest in customer experience technology like chatbots to direct the customer to the right customer support member or even for making personalized recommendations.
It’s also important to respond to customer support tickets in a timely manner since 73% of customers report that speedy support resolutions are key to a good customer experience. To make support resolution faster, simplify your customer service workflows so the right team members or departments can respond promptly.
You can also improve your customer service speed by offering omnichannel support. If customers are able to resolve their issues on mobile, website, on a call, or in person, they have several options to leverage to resolve their issues faster.
4. Reward customers for loyalty
Loyal customers are your top priority, so you need to make them feel valued.
Create personalized loyalty programs that reward customers for making repeat purchases. By creating personalized special offers and offering discounts to loyal customers, you motivate people to keep transacting with you and improve retention rates. This is further supported by the fact that personalization can boost customer retention or reduce churn by 25%. The more purchase data you have on your customers, the more you can personalize your rewards program, further delighting them and giving them a reason to stick with your business.
5. Support a cause your customers care about
This is one way of building an emotional connection with customers. 70% percent of consumers want brands to take a stand on social and political issues. Another recent study showed that 77% of consumers are motivated to buy from a company committed to making the world a better place. If brands support social causes, there’s a higher probability they’ll be more effective at retaining their customers.
For example, Ben & Jerry’s makes social justice-themed ice cream flavors to lobby for change and raise money for global warming, LGBTQ+ rights, and criminal injustice. This gives customers a reason to continue choosing Ben & Jerry’s over its competition if they care about these causes.
Customer retention examples
A lot of companies have utilized creative customer retention strategies to boost profitability. Some examples of companies that have been successful at retaining customers include:
Calm
Calm, the meditation app, managed to increase their retention rates by three times. They dug deep into their user behavior data by creating user cohorts and analyzing behavioral differences that had an impact on retention.
Their analysis revealed that a small number of users who were using the ‘reminders’ feature to remind them about meditating were using the app more frequently and had a higher retention rate than the ones who weren’t using reminders.
Calm ran some experiments to understand the relationship between using the reminders feature and retention rates and confirmed there was a direct correlation between them. Calm made reminders a more conspicuous feature of their app and tripled their retention rates.
Showmax
Showmax is a subscription video service focused on underserved markets across Africa and Eastern Europe.
In an effort to increase retention, Showmax democratized data analysis across the company. As their Chief Product Officer Barron Ernst said, “You should want more of your people to do their own data analysis and be thinking deeply about how customers are using your product.”
Equipped with insights from the data, Showmax realized that a lot of their users were coming back to the platform to watch content from a specific Polish content director. Consequently, they decided to develop more content with this director, which continued to drive engagement and retention in the Polish market.
Showmax has continued to use data to drive growth across 70+ markets in only three years.
Dave
Dave, a personal finance app, was able to leverage the insights from the customer behavior data they gathered to not just find a product-market fit, but also find their key retention drivers.
Dave realized the users who added recurring expenses during the onboarding process showed a higher retention curve than the ones who didn’t. So they revamped the onboarding process to focus on adding recurring expenses, and three months later they had 5.7X higher retention rates.
Tools for improving customer retention
Here are some tools that can help you improve your customer retention rates:
Learn more about each of these tools on a review site like G2.
References
- The Value of Keeping the Right Customers, Harvard Business Review
- What is customer retention? 11 strategies to retain customers, Zendesk
- Customer retention rate: How to calculate and improve it, Zendesk
- CX Trends 2022: Unlock growth with customer service, Zendesk
- Personalizing the customer experience: Driving differentiation in retail, McKinsey & Company
- 70 Powerful Customer Retention Statistics You Need to Know in 2021, SEMrush
- Brands Creating Change in the Conscious Consumer Era, Sprout Social
- Consumers, Investors Hold Corporations’ Feet to the Fire, Aflac
- We use our position to influence change, Ben & Jerry’s
- Leading benefits from personalization according to marketing professionals in the United States as of March 2020, Statista
Ready to continue your learning on retention? Use our Mastering Retention playbook to get to the next level.

Sam Edwards
Former Global Technology Partner Manager, Amplitude
Sam is a global technology partner manager at Amplitude and former solutions engineer and customer success manager. She specializes in helping businesses reach their revenue goals, scale for growth, and build the best product for their users.
More from Sam


