The Ultimate Guide to Setting up Analytics for Ecommerce
Ecommerce analytics is the key to optimizing your online business for success.
Ecommerce analytics is how businesses measure and analyze data related to their online stores. This analytical information helps ecommerce businesses better understand consumer behavior and their customer journeys, informing them on what to tweak or where to optimize their efforts for increased profits and conversions.
Worldwide, there’s an enormous opportunity for growth and high levels of competition. Ecommerce sales continue to grow and are expected to exceed $5 trillion in 2022—a 20.3% increase from 2020. Companies that use ecommerce data to provide elevated customer experiences are more equipped than competitors to attract new customers and retain existing ones.
Key takeaways
- Analytics for ecommerce allows businesses to measure and analyze the performance of their online stores.
- When reporting on business analytics for ecommerce, it’s important to collect metrics that give you information about:
- Your audience
- Your acquisition and conversion rates
- Your customer retention and loyalty levels
- Enterprise-level ecommerce sites should conduct regular performance analyses to determine the effectiveness of their platforms. Some areas to look into include:
- Website speed and security
- Personalization
- Call-to-action (CTA) effectiveness
- Product conversion drivers
- Cart analysis
What should you include when reporting on analytics for ecommerce?
When it comes to ecommerce reporting, there are several metrics you could look at. You can break down your business into different performance areas to make it easier to choose which ecommerce metrics and data sets to collect and analyze.
Your audience
To help contextualize the data you’ll collect, start by obtaining as much information as possible about your current audience. Some key metrics you might want to consider include:
- Demographics include basic information such as your customers’ age, gender, income, and level of education.
- Bounce rate tells you how many people visit your landing page and leave immediately without taking further steps, such as visiting another page or viewing a product.
- Online store access tells you which device they use to access your online store (mobile, desktop, tablet, etc.). It also tells you which channel they’re coming from (search engines, social media, email campaigns, paid advertising, etc.).
You can dig even deeper into the customer journey by looking at user behavior:
- Viewing a new customer’s time to first purchase. This is the time elapsed between taking an action like creating an account on your platform or signing up to your newsletter to making a purchase.
- Studying features commonly used by your repeat purchasers. Optimizing and promoting these features could be the key to attracting more new customers.
- Defining your power users. These are your loyal and repeat purchasers.
- Analyzing common paths used by both first time and repeat purchasers. This includes all channels and marketing messages users interact with before making a purchase.

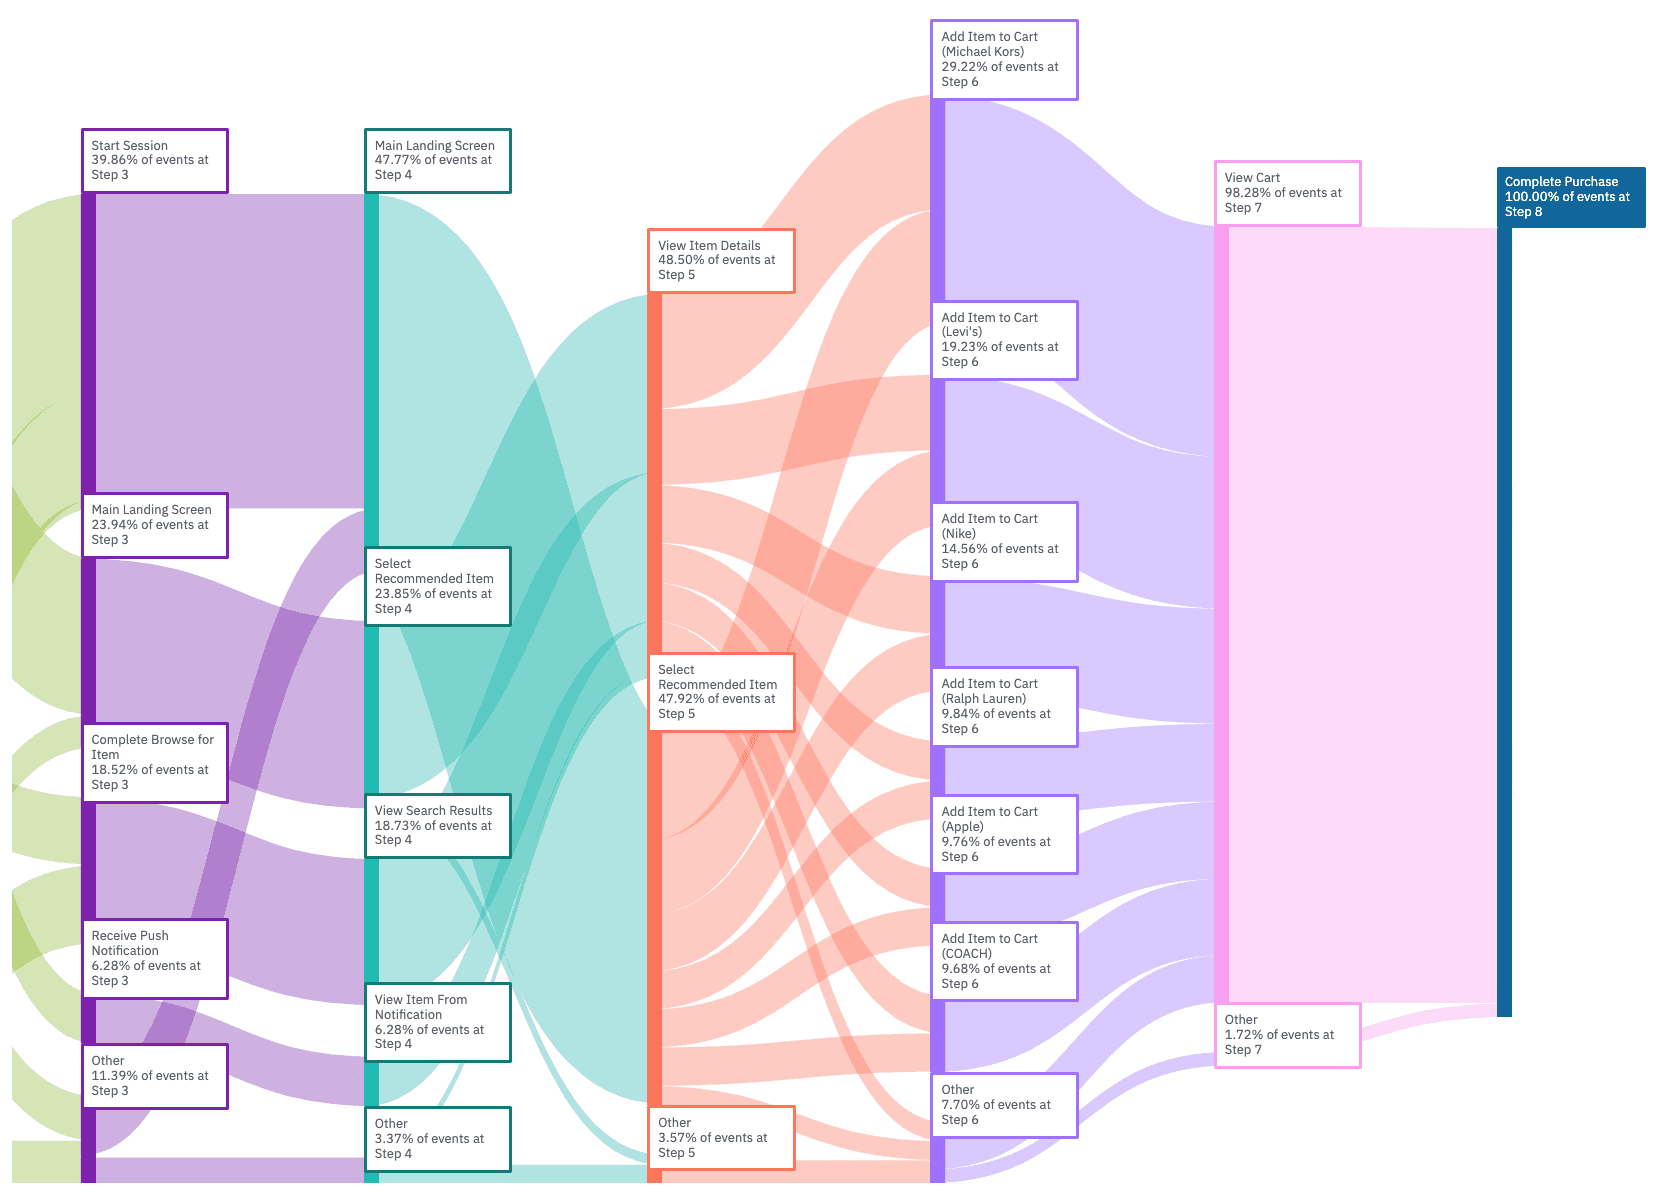
Amplitude’s Journeys chart shows the top paths customers take before completing a purchase, including which brands are frequently added to cart. Try this analysis for free using your online store’s data, or explore this example in our self-service demo.
Finally, you can look at various engagement metrics from your social media and email marketing efforts, but make sure not to rely too heavily on them as they are often considered vanity metrics.
- Reach tells you how many people have actually seen your social media posts or emails.
- Impressions tell you how many times people have viewed your posts. It gives you more information than reach since it also considers users who’ve viewed your posts more than once.
- Engagement is the first step toward acquiring and then converting users to customers. Beyond simply viewing your posts, you want people to react, share, and click CTAs on your posts.
Customer acquisition and conversion
Beyond bringing people to your online store, you need to understand which visitors you’ve converted to actual customers and the monetary cost of acquiring them.
- Customer acquisition cost (CAC) tells you how much you spend on bringing new customers. It’s calculated by dividing the amount of money you spend on attracting customers (such as your marketing activities and campaigns) by the number of customers you acquired in that same period.
- Click-through rate (CTR) shows you the effectiveness of your paid advertising by telling you how many people actually engaged with your ad. It’s measured as the number of clicks an ad receives divided by the number of impressions it receives.
- Sales conversion rate is the percentage of people who visit your sales channels and make a purchase. It’s calculated by dividing the number of conversions by the total number of website visitors and multiplying that by 100.
- Average order value (AOV) tells you the average amount of money spent when a user buys something from your ecommerce website and other channels. It’s measured as the revenue divided by the number of purchases.
- Cart abandonment rate tells you the percentage of people who add items to their shopping cart but don’t go through the checkout process. It’s calculated by dividing the number of orders completed by the number of orders initiated and multiplying that by 100.
Customer retention and loyalty
You need to understand your ability to retain customers after making their first purchase and also their loyalty to your brand. Returning customers mean more recurring revenue for your business.
- Customer lifetime value (CLV) is how much monetary value a customer has for your business for as long as they remain loyal to your brand. CLV is measured by multiplying their average purchase frequency by their average purchase value.
- Customer retention rate is the percentage of customers who remain loyal to your business over a specific period. You can calculate your retention rate using the formula [(E – N)/S] * 100. E is the number of customers at the end of the period, N is the number of new customers you gained during that period, and S is the number of customers at the beginning of the period.
- Customer churn rate gives you information about the customers you have lost (churned) during a specific period. To calculate it, you divide the number of customers lost by the total number of customers at the start of the period and multiply that by 100.
- Returning customer rate refers to the number of customers who’ve made more than one purchase with you. It’s calculated by dividing the number of return customers by the total number of customers and multiplying that by 100.
Learn more about the best metrics to boost conversion, loyalty, and revenue in The Amplitude Guide to Product Metrics.
Nine analytics tools for ecommerce
There are several analytics tools for ecommerce companies available to you. Here are a few you might want to check out.
Amplitude
Amplitude Analytics is a digital analytics platform that offers self-service insights about your ecommerce business. It empowers ecommerce teams to make data-driven decisions that will enhance the customer experience and boost sales. Questions you can answer with Amplitude include:
- What is your total revenue and average order value (AOV) over time?
- What is your checkout conversion rate and where do dropoffs occur?
- Which customer behaviors are correlated with conversions?
- How long does it take customers to make their first purchase?
- What are the top paths customers take before completing a purchase?

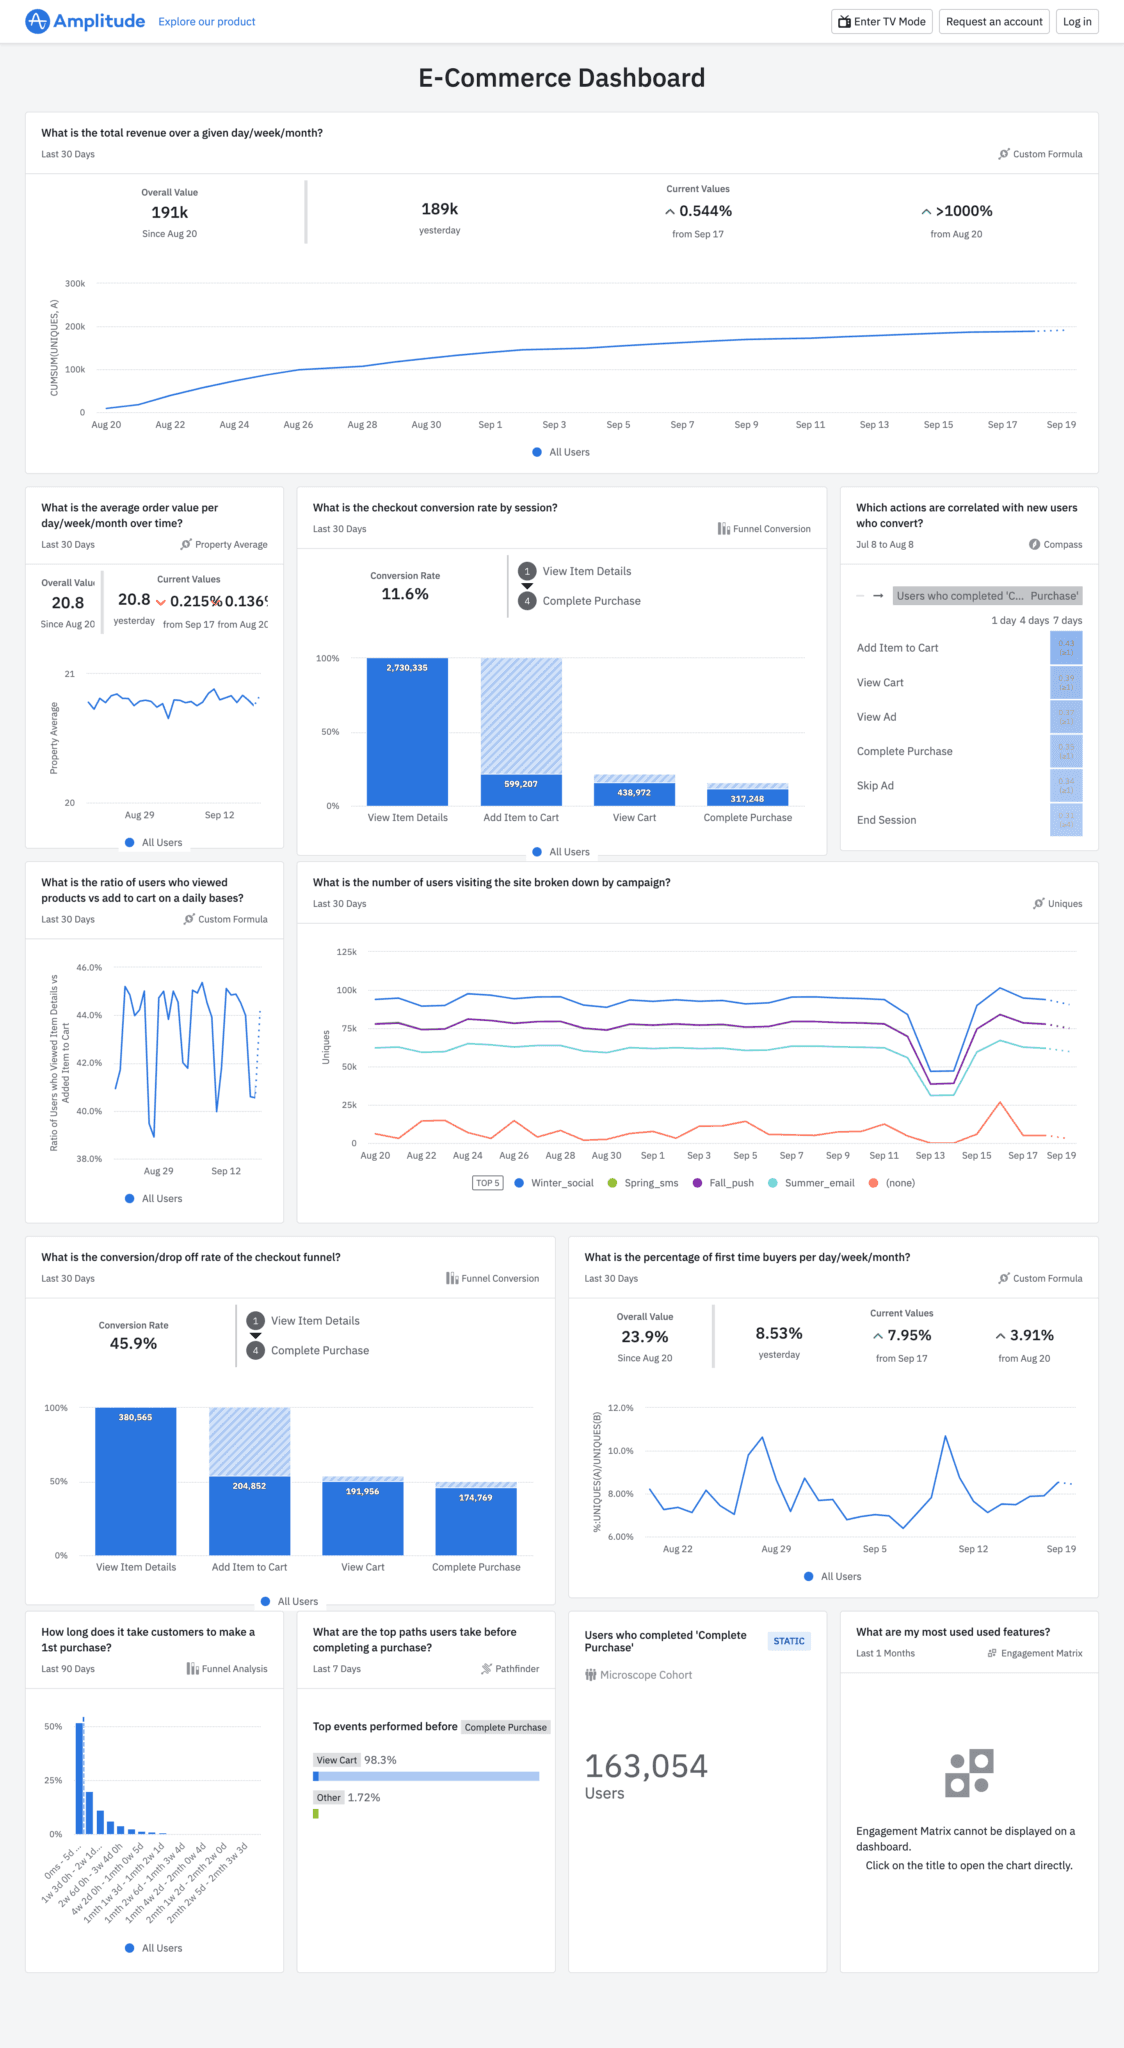
Amplitude’s ecommerce dashboard answers the questions above and more. Explore it yourself with our free demo and see what insights you can unlock for your digital storefront.
Besides Amplitude, other analytics for ecommerce tools include:
You can also check out review websites like G2 for a roundup of some of the best analytics tools for ecommerce.
Regardless of which tool you use, you need to implement your ecommerce analytics accurately. See our Ecommerce Implementation Guide for more information on ecommerce taxonomy, instrumentation, business questions, and more.
Enterprise-level ecommerce performance analysis
A good way to understand the overall effectiveness of your ecommerce store is to conduct a performance analysis. This process involves using ecommerce website analytics to identify problem areas on your website, obtain actionable insights, and take the necessary steps to fix them.
Website speed and security
Speed and security play a large role in how customers perceive your website.
- Speed: Research has found that half of potential customers will abandon shopping carts if they feel web pages don’t load fast enough. 53% of customers expect load times of 3 seconds or less. You can use tools like Google Page Speed Insights to check your website’s loading speed and get other data about your website’s performance.
- Security: Security and privacy are crucial factors in the customer experience. Tableau Public found that 48% of customers churned due to privacy concerns. Use tools like SSLTrust to analyze your website’s security. SSLTrust checks your site using over 60 databases for various security features.
Personalization audit
According to McKinsey, 71% of customers have come to expect personalized marketing messages from companies. There are several things to look out for to ensure that you’re utilizing personalization in your marketing strategy.
You must first be sure you’re gathering behavioral customer data and demographics in real time. Knowing where your customers are accessing your website enables geotargeting—displaying location-specific content to offer customers enhanced ecommerce experiences.
Amplitude Audiences gives you insight into your customers’ purchasing history, allowing you optimize your cross-sell efforts by surfacing personalized offers throughout the customer journey. These include items complementary to recently purchased products, items that pair with ones already added to cart, or items that match the customer’s search intent.
Ecommerce analytics tools such as Amplitude make it easier for you to segment your audiences into groups, or cohorts, based on their behaviors. You can build cohorts around content, brand, or product affinity, then use cohort analysis to analyze whether certain groups have higher revenue or conversions.

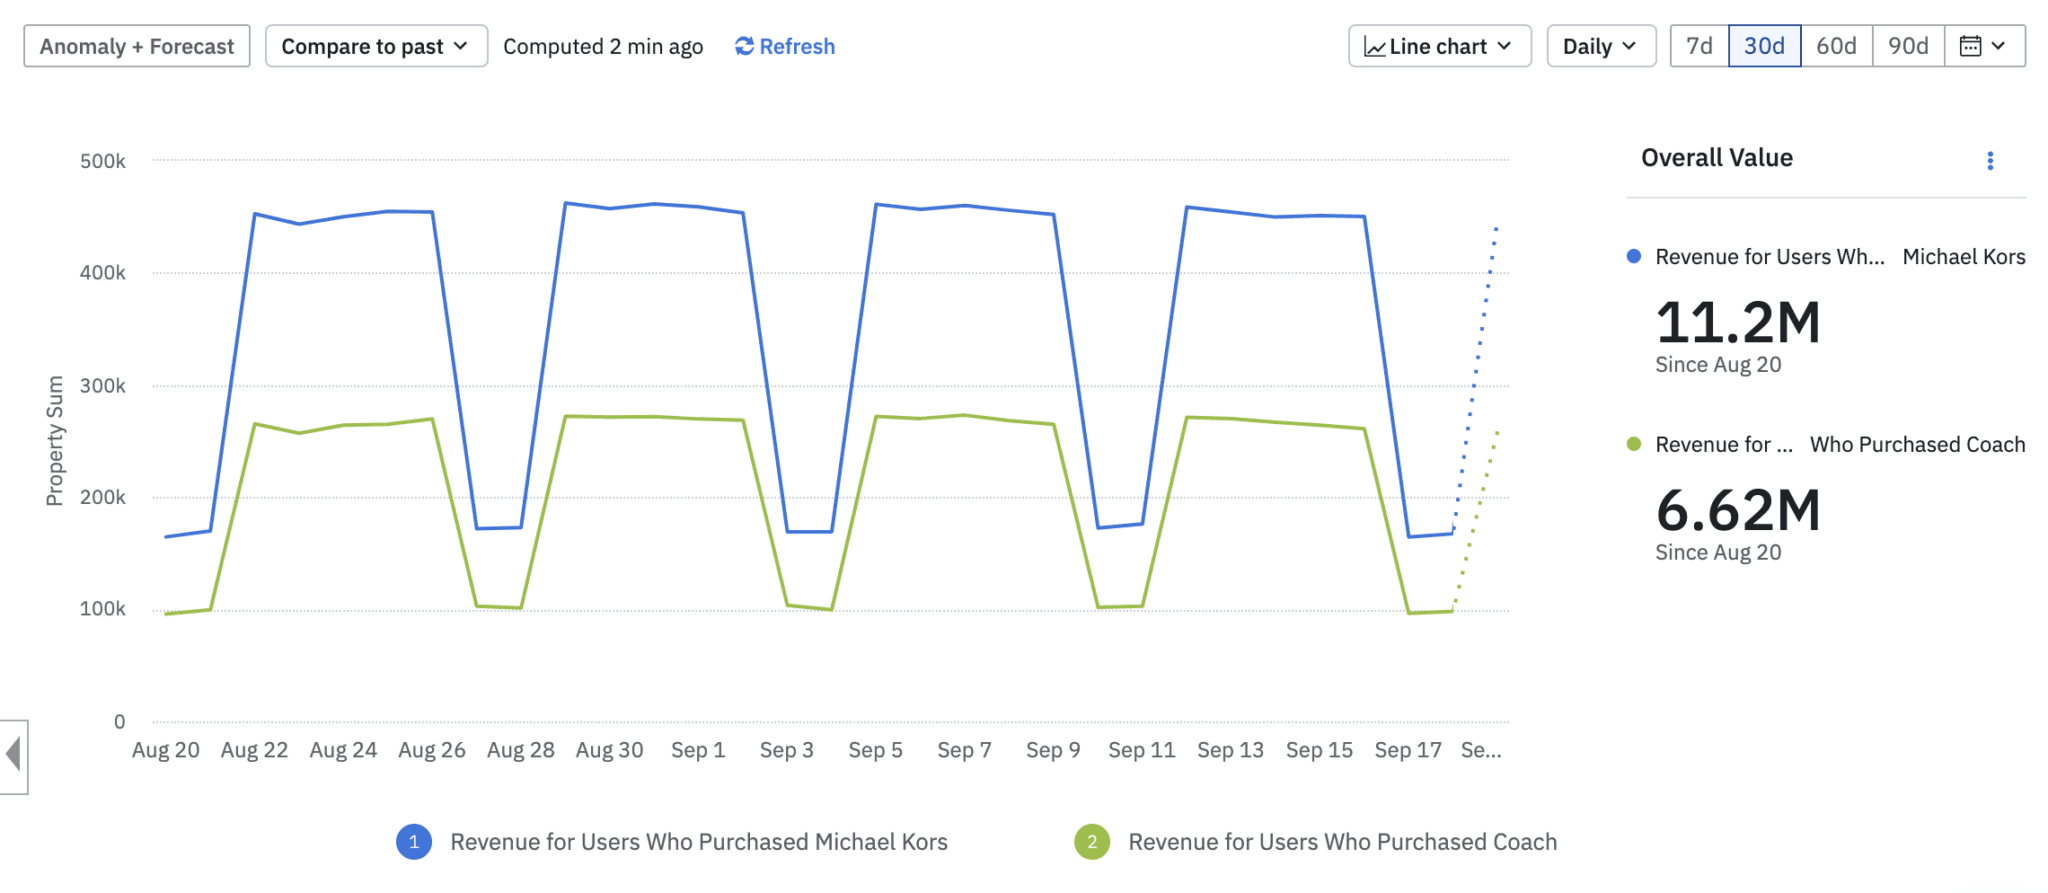
Amplitude’s Event Segmentation chart shows that cohorts of customers who purchase Michael Kors (blue) have higher revenue than those who purchase Coach (green). You can use this insight to design more targeted marketing campaigns for your Michael Kors brand lovers since you’ll likely see high ROI. You can use a similar analysis to re-engage cohorts of customers who abandoned their cart before purchasing.
On-demand delivery startup Rappi started using Amplitude to target their high-impact customer cohorts more effectively. With Amplitude, they were able to pull segments of new users quicker based on important factors that defined their first-time experiences. They were able to drive a 10% increase in the number of users who completed a first-time order and decrease CAC by 30%.
Call-to-action enhancements
Calls-to-action (CTAs) are crucial for websites and search engine optimization (SEO). A good CTA is a clearly defined next step you’d like your customers to take. For ecommerce platforms, CTAs are responsible for converting visitors to customers.
You can use funnel analysis to analyze the effectiveness of your CTAs and understand which CTAs are driving users to where you want them to go.

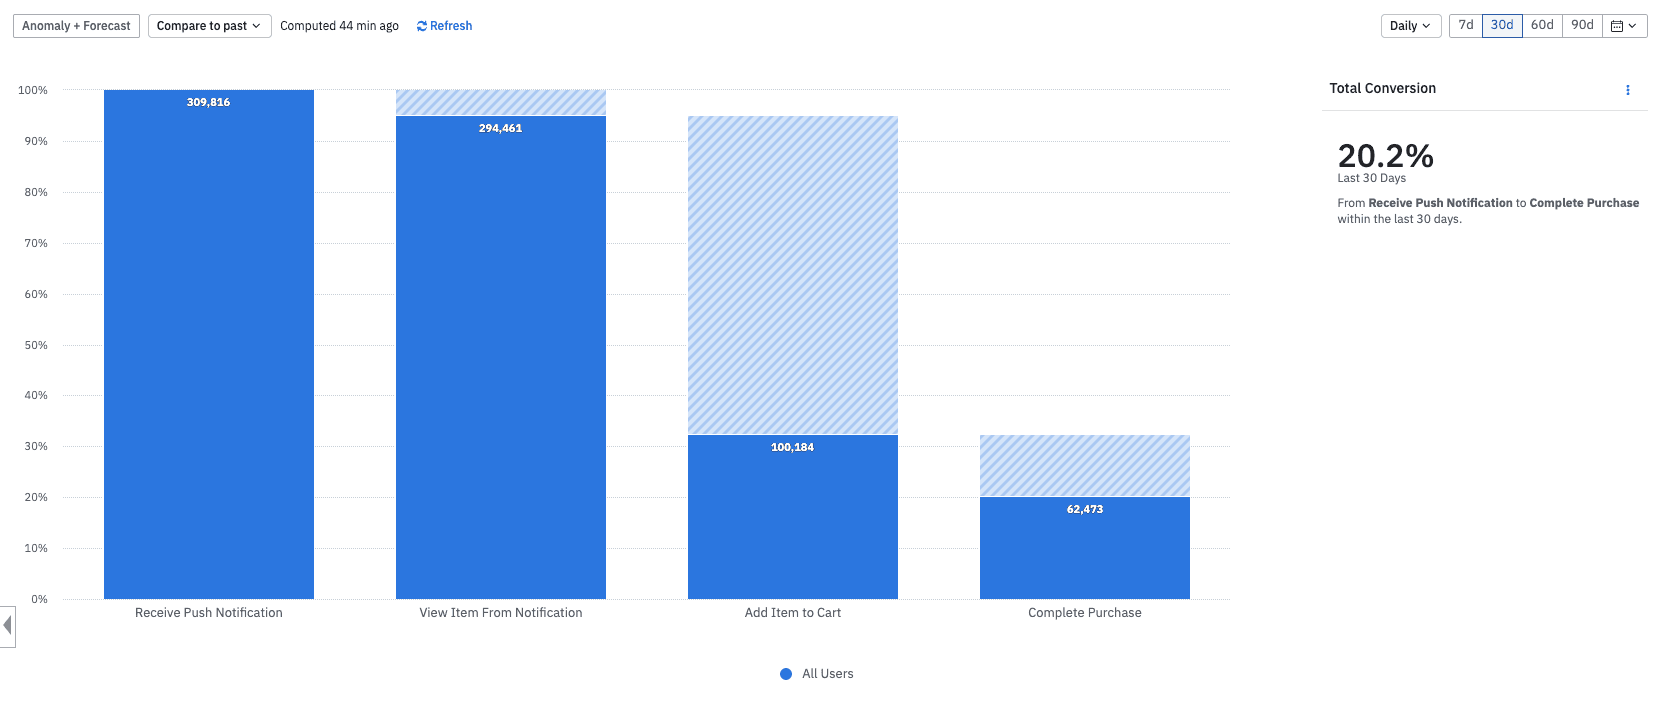
Amplitude’s Funnel Analysis chart shows conversion after receiving a CTA from a marketing push notification. The conversion rate to completing a purchase is 20.2%.
Product conversion drivers
Product conversion drivers identify what features are being used by customers that are likely to lead to increased revenue and conversions. These include things like favorite lists, social sharing, free shipping, upsells or cross-sells, and differences on the product detail page like product images versus videos. You can then A/B test these features with a subset of customers to determine causation. Watch the video below to learn how to increase your shopping cart values with conversion drivers.
Cart Analysis for transactional insights
Cart Analysis helps unlock new insights about customer transactions and better understand purchase behavior. With Amplitude’s Cart Analysis, you can answer questions like:
- What are our top-performing product categories?
- How do different products convert through the checkout funnel?
- What are the most popular product combinations?
- How can we increase basket size through upsell opportunities?
Watch the video below to learn more about Cart Analysis.
Go further with your ecommerce analytics by using a free tool like Amplitude. Get started with your data today or see what’s possible in our demo.
References
- Global Ecommerce Forecast 2022, eMarketer
- Customer Acquisition vs. Retention, Invesp
- 1 in 2 visitors abandon a website that takes more than 6 seconds to load, Digital
- Staying cyber-secure while working from home, Tableau Public
- The value of getting personalization right—or wrong—is multiplying, McKinsey & Company
- The Power Of Personalization In E-Commerce User Experiences, Nylas

Ganit Bar-Dor
Sr. Director, Global Professional Services, Amplitude
Ganit Bar-Dor manages Technical Services & Success at Amplitude, working with companies to gain actionable insights and effectively manage their data. She has worn many hats within professional services and product teams, building, executing and consulting with customers. Ganit Bar-Dor graduated from Concordia University in Montreal, Canada, with a degree in Computer Science.
More from Ganit


