How to Find Value in a Failed A/B Test
Running an A/B test is easy, but making the most of your results is a learned skill.
For a new marketer reading about mobile A/B testing, the possibilities can feel limitless and bright. Statistically significant changes abound, and tweaking the color of a CTA is enough to earn a 10 percent lift in conversions.
In reality, A/B testing is not this pretty. Many A/B tests return results that are negative or — sometimes even worse — flat. Furthermore, testing too many variables at once could return seemingly contradictory results, where it’s difficult to correlate a specific change with a specific outcome.
But there’s still value in these “failed” A/B tests. It all depends on how you interpret the results. Let’s go over a few ways in which you can learn something new from an otherwise inconclusive test.
(Source: Unsplash)

Dig Deep to Find Hidden Winners
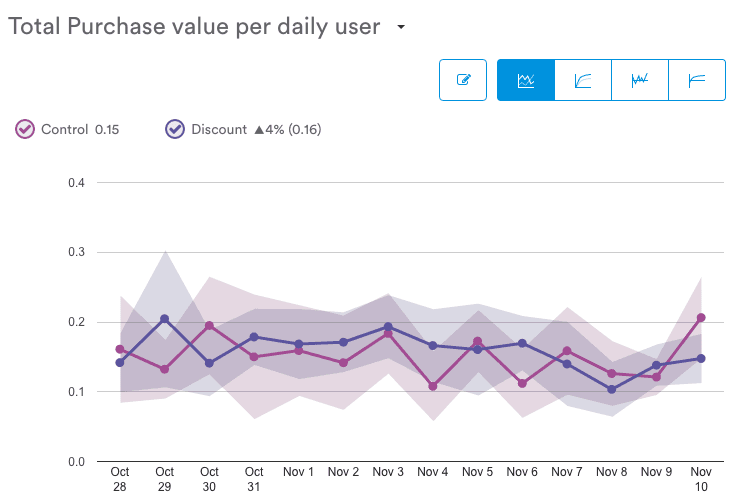
Below, we see the results of an A/B test that compared the effects of a discount on total purchase value per DAU.

On the left, we see the total purchase value per user in dollars. In this example, the discount variant slightly edged out the control with an average purchase value of $0.16.
You can tell at a glance that the results of this test aren’t very useful. Indeed, the current results report only an estimated four percent difference — well within the margin of error, which is represented by the shaded area around each line. Since the shaded areas are touching throughout the span of the test, we cannot be certain that the discount truly represents a four percent increase.
This test was never able to reach statistical significance, suggesting that there’s no meaningful difference between the control and the variant.
Or is there? Before jumping to that conclusion, consider diving into the data to discover hidden winners.
Try filtering your results by various categories. You can look at:
- Device OS
- Location
- App-specific events
- User attributes
- User acquisition source
Even if the aggregate results for this metric are flat, there’s a chance that there’s a significant difference within a specific segment of your users.
Of course “significant” could mean positive or negative. With A/B testing, the goal is to learn — don’t worry if your flat result turns out to be negative. Take note of it for next time.
Track the Right Metrics
What you track is as important as who you test it on. Optimizing a single metric — especially if it’s the wrong one — gives you a skewed picture of how users respond to your changes.
Here’s an example. Let’s say you make a change to your retail app that’s supposed to increase a micro-conversion, such as completions of the Add to Cart event. It’s important that users complete this event (otherwise they can’t complete a purchase!), but it’s not the end-all be-all of shopping. The macro-conversion that really matters is purchases — how many of these users went on to complete the transaction and generate revenue?
If you tweak your app UI with the sole goal of boosting instances of Add to Cart, you run the risk of optimizing for the wrong metric.
What would happen if you implemented a UI with small buttons that are too close together? Users might accidentally press the “add to cart” button when they intended to click the “reviews” button, for example. The Add to Cart event metric would soar, but conversions would remain unaffected.
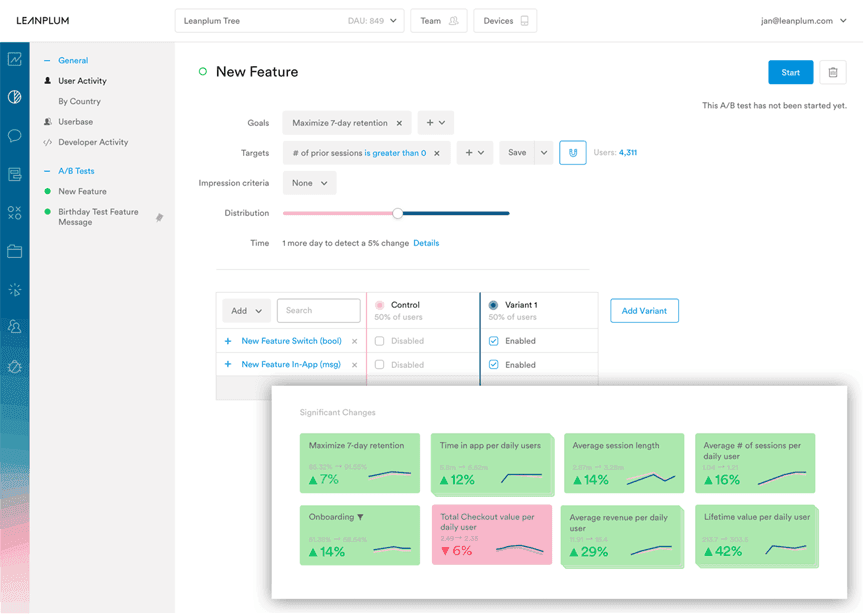
The easy solution to this problem is to brute force it by testing everything. This isn’t as crude as it sounds — dedicated mobile marketing solutions like Leanplum are configured to track every major metric by default. Leanplum goes a step further by automatically surfacing statistically significant changes, so tracking everything doesn’t mean sifting through 10x the amount of data. The analytics dashboard highlights what you need to know.

If you’d prefer to run a minimalistic setup and only track what you need, it’s worth adding important macro-conversions to every A/B test. That’s the only way to be sure that your optimizations aren’t hurting your top line.
Double-Check Your Hypothesis
There’s no sugarcoating the fact that A/B tests don’t always work out. Try as you might, there may not be any actionable insights lurking in your data. But there’s no shame in going back to the drawing board.
When creating an A/B test, it’s recommended that you start with a hypothesis. This educated guess, qualitative though it may be, is the guiding force behind your experiment. You could argue that the purpose of an A/B test is to find quantitative evidence that backs a qualitative opinion about the app. Therefore, if an experiment fails altogether, it’s time to change the hypothesis.
Let’s pick a simple example: you’re trying to optimize your user onboarding flow, and you’re wondering what color the “register” button should be. In your A/B test, you compare bright red to solid black, with the hypothesis that the red CTA will attract more attention.
However, plenty of factors affect your event completion rate besides the button’s color. Maybe your onboarding flow is already doing its job and people are signing up regardless. Or maybe white text on a black button contrasts as much as white text on a red button, so the change doesn’t attract more clicks.
If you’ve A/B tested both options thoroughly and came up with nothing, it’s safe to assume that both button colors are equally effective. Instead of making further tweaks to this experiment in an attempt to find the optimal color, it may be more efficient to revise your hypothesis and find another method to increase sign-ups.

Running an A/B test is easy, but making the most of your results is a learned skill. It takes a certain amount of diligence to pore over your results and identify where and how your changes made an impact. Software simplifies the process, but the user must know what to look for.
With these tips in mind, you’re ready to take on your next unsuccessful A/B test with confidence. Turning experimental failure into actionable data will take you a long way on your path to mobile app optimization.

Stefan Bhagwandin
Writer, Leanplum
Stefan Bhagwandin is a social media and content intern at Leanplum. Leanplum is an all-in-one mobile marketing platform for driving engagement and ROI.
More from Stefan


