Getting Your Product Team to a Growth Mindset Requires KDIs — Not KPIs
Key diagnostic indicators measure the true performance of your product. Here’s how to make the switch.
Have you ever worked really hard in delivering the best feature you possibly could and, right after launch, your key performance indicators (KPIs) go down?
Imagine thinking afterward that you did everything in your power to make sure the feature worked: you followed all the best practices and got user feedback. So how could your work show a negative trend on your performance indicators—the indicators your performance is linked to?
With KPIs, this story is personal. The story your data is telling you has a direct impact on your ego. Your work = the performance of the product. This is the problem with the key performance indicators.
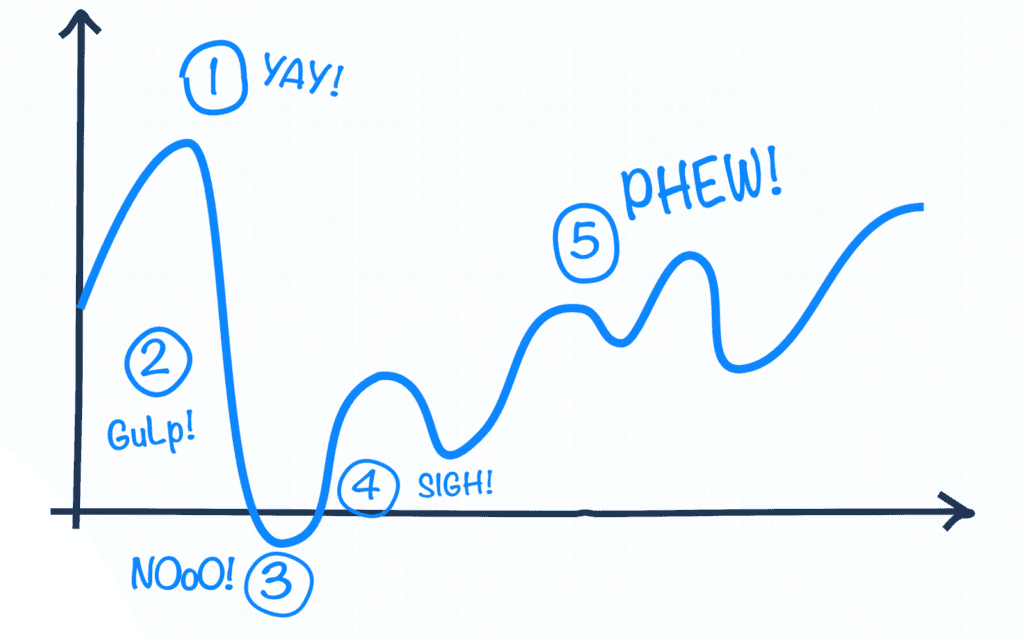
As a growth leader, you know the performance of a product looks more like this:

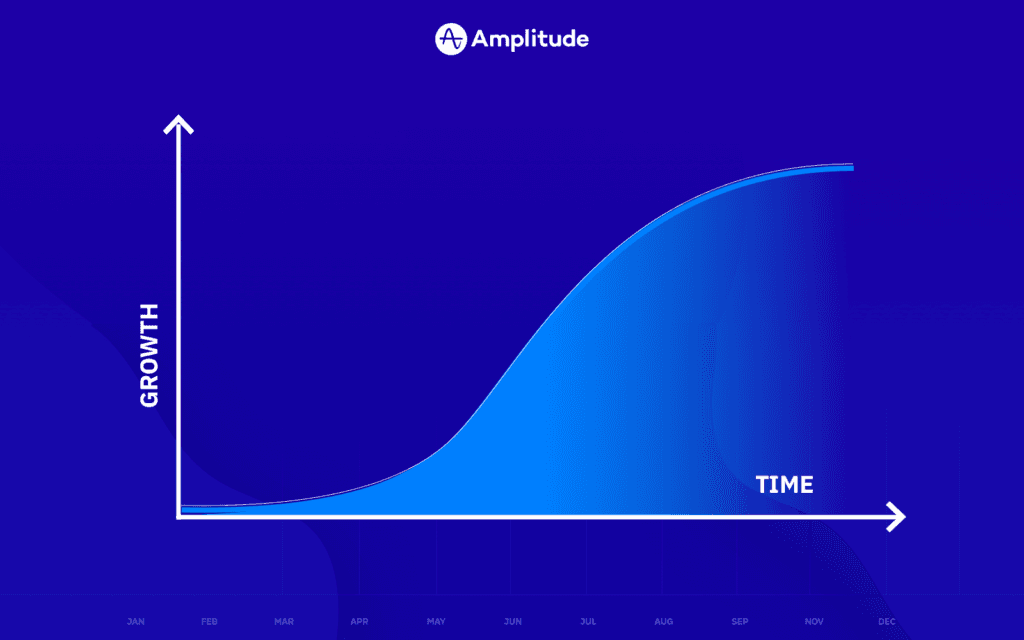
Than it looks like this:

Naming your data “key performance indicators” puts a lot of pressure on the team to meet performance levels that prove they are good at what they do. But It’s stories like these that create the world of vanity metrics.
When you are optimizing the product around vanity metrics that you can hack to make go up, you are sacrificing the true growth of your company so that your employees can feel good about their effort.
The true measure of success is if your team is learning, not if they are meeting a specific level of a vanity metric. In order to help switch your team’s mentality to growth and ensure they are learning, change your KPIs to KDIs using the guidelines below.
How to Change Your Key Performance Indicators to Key Diagnostic Indicators
1. Understand which of your KPIs are vanity metrics and delete them from your team’s nomenclature.
Common vanity metrics include:
- Site traffic
- Reach
- Engagement rates
- Video views/page views
- Revenue
2. Create KDIs that measure the true performance of your product.
I like to align KDIs to the product lifecycle moments, which are:
- Interest
- Acquisition
- Activation
- Habit formation
- Retention
In some cases, you may need to add in revenue if your revenue metric is not aligned to your retention metric. If your revenue metric is aligned to your retention metric, leave it out. Revenue is a hackable metric since the business can offer discounts and promotions that can cause it to go up, without a coinciding change in the value of your product.
It takes some amount of analysis to define what these product metrics mean for your product. Again, you want to think about how these metrics will show the true, unhackable performance of your product. Ideally, you are aligning these metrics to your coinciding product strategy for each one of these lifecycle moments.
Here are some examples of metrics you could use. Note that all are visitor based.
- Interest
- Non-single page view visitors
- Visitors who viewed an intro video
- Visitors who signed up for email, but did not convert
- Customer acquisition cost
- Acquisition
- Has purchased
- Created an account, particularly if your product is free to use
- Word-of-mouth growth
- Activation
- Visitors who engaged with the part of your product that shows the value of the product for the first time
- Habit Formation
- The number of visitors who have performed an action enough times where it is predictive of long-term retention.
- Retention
- Align your retention metric with the natural usage of the product’s closest alternative
3. To diagnose your product’s performance, always write clear hypotheses for all your features.
A hypothesis is made up of 4 components:
1. Who: A specific person or behavioral segment…
- It’s best to define this as a specific behavioral target, such as “new visitors who are visiting from our awareness campaign and click a button that shows they are interested.”
2. What: Will perform some action…
- This should align with your KDI framework. In this example you may say, “The audience defined will have a higher conversion into acquisition than if they did not click that button.”
3. Why: Because the rewards system elicits this motivation.
- This is the one that’s usually excluded. You need to layer in the psychology of why someone who clicks that button would be more likely to purchase. In this example, the reason people will be acquired more frequently after clicking that button is because the page reveals content that leans into the framing cognitive bias.
4. Outcome: To say this is a success we need to see some conversation rate. This is what will be defined in the measurement strategy.
- This is the lift you need to see to prove that the new feature is driving the right psychology for growth in your product. It’s really important you include any cost implications into this equation. For example, if it costs $100 a day to host the personalization product serving up the right framing bias, then you need to have a lift in acquisition conversion rate that earns you more than $100 a day.
If you have a clearly written hypothesis, you can diagnose why things didn’t go as you anticipated or didn’t have the lift that you were anticipating making it worth your while. In this example, if you found that the audience did not convert into acquisition at a higher rate, you know that the content you included after the button click is not correct. That insight is different than those who clicked the button weren’t as interested as the other cohort. Without the why, you may attribute the outcome to something that is not true.
If you empower your team to learn as opposed to always hitting numbers, you are well on your way to a growth mindset.

Shayna Stewart
Director, Strategic Business Development, Turner Sports at NBA Digital
Shayna is a Director, Strategic Business Development at Turner Sports, NBA Digital. In this role, she helps guide teams that gather insights to strategically evolve product roadmaps. After many years of standing up effective analytics testing and insights teams, she is now an advocate for consumer-centric data approaches that empower consumer-centric product strategies.
More from Shayna


