Conversion Funnel and Holding Constant
Learn how a simple feature in Amplitude can greatly increase your analysis capabilities.
One of my favorite things about working at Amplitude is when I come across a product feature that enables customers to do something I haven’t been able to do in the past. I have worked with many digital analytics platforms, and back then, I was pretty good at hacking them to do amazing things. But sometimes, there are things a product just can’t do, or you have to bend it so much that it breaks.
An example of this is a feature in Amplitude called holding constant within conversion funnels. In the example below, I will show how this small but powerful feature in Amplitude can answer the following question:
How often did visitors convert from View Item Details to Add to Cart to Complete Purchase with the same product in each step?
But before we dive into this question and the holding constant feature, let’s review conversion funnels. A conversion funnel is a report type where you select a specific set of milestone events. The digital analytics platform shows how often users converted or dropped off between the steps. For example, you may want to see how often customers who view products add them to the cart and then purchase the product.
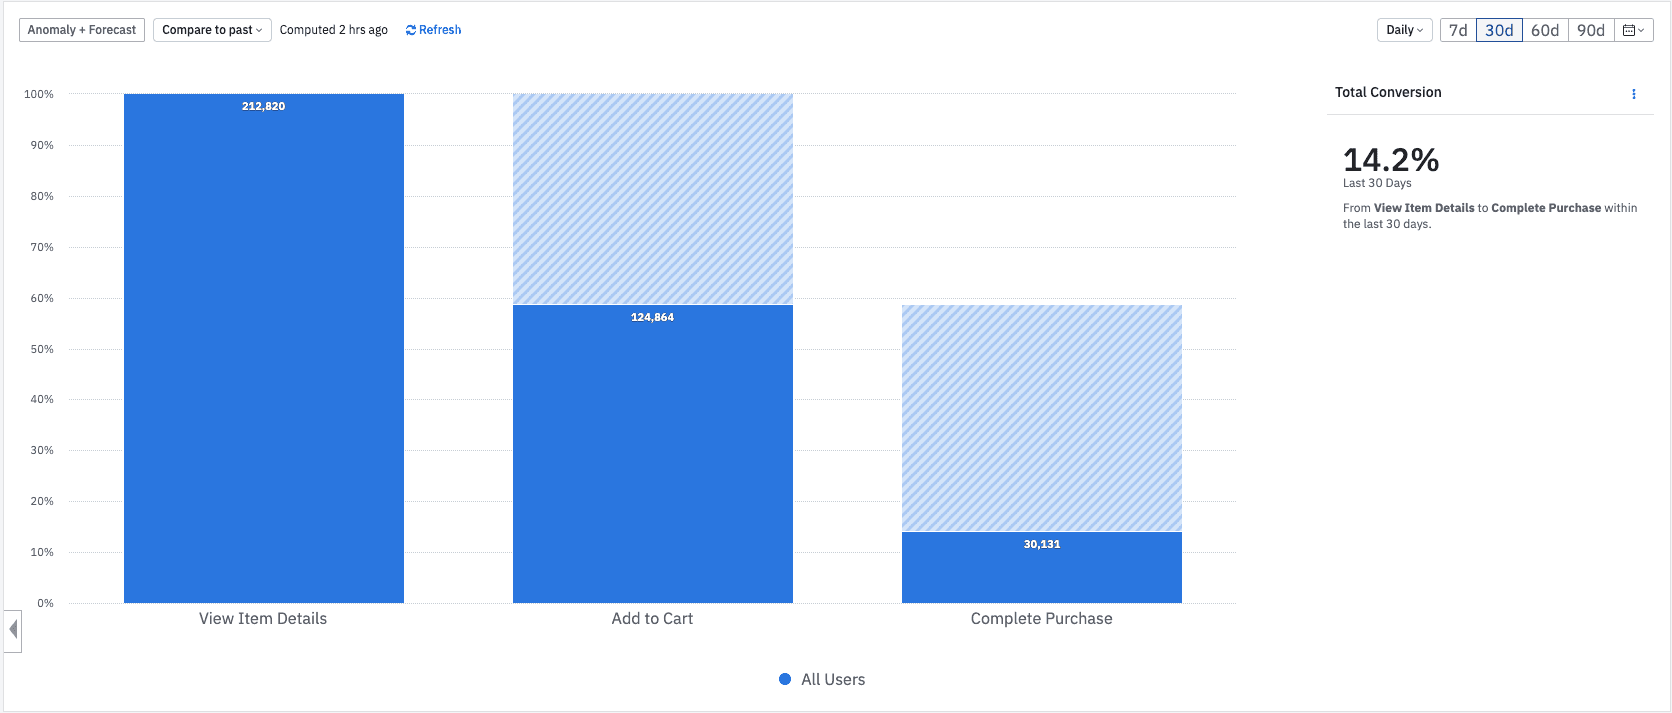
In this scenario, the conversion from View Item Details to Complete Purchase is 14.2%. This conversion funnel is basic, and most digital analytics platforms can do this.
If you wanted to get more complex, you could modify this conversion funnel to filter each step by a specific property value. For example, if you wanted to view how this conversion funnel changed when only looking at visitors from the city of New York, you could filter each step as shown here:
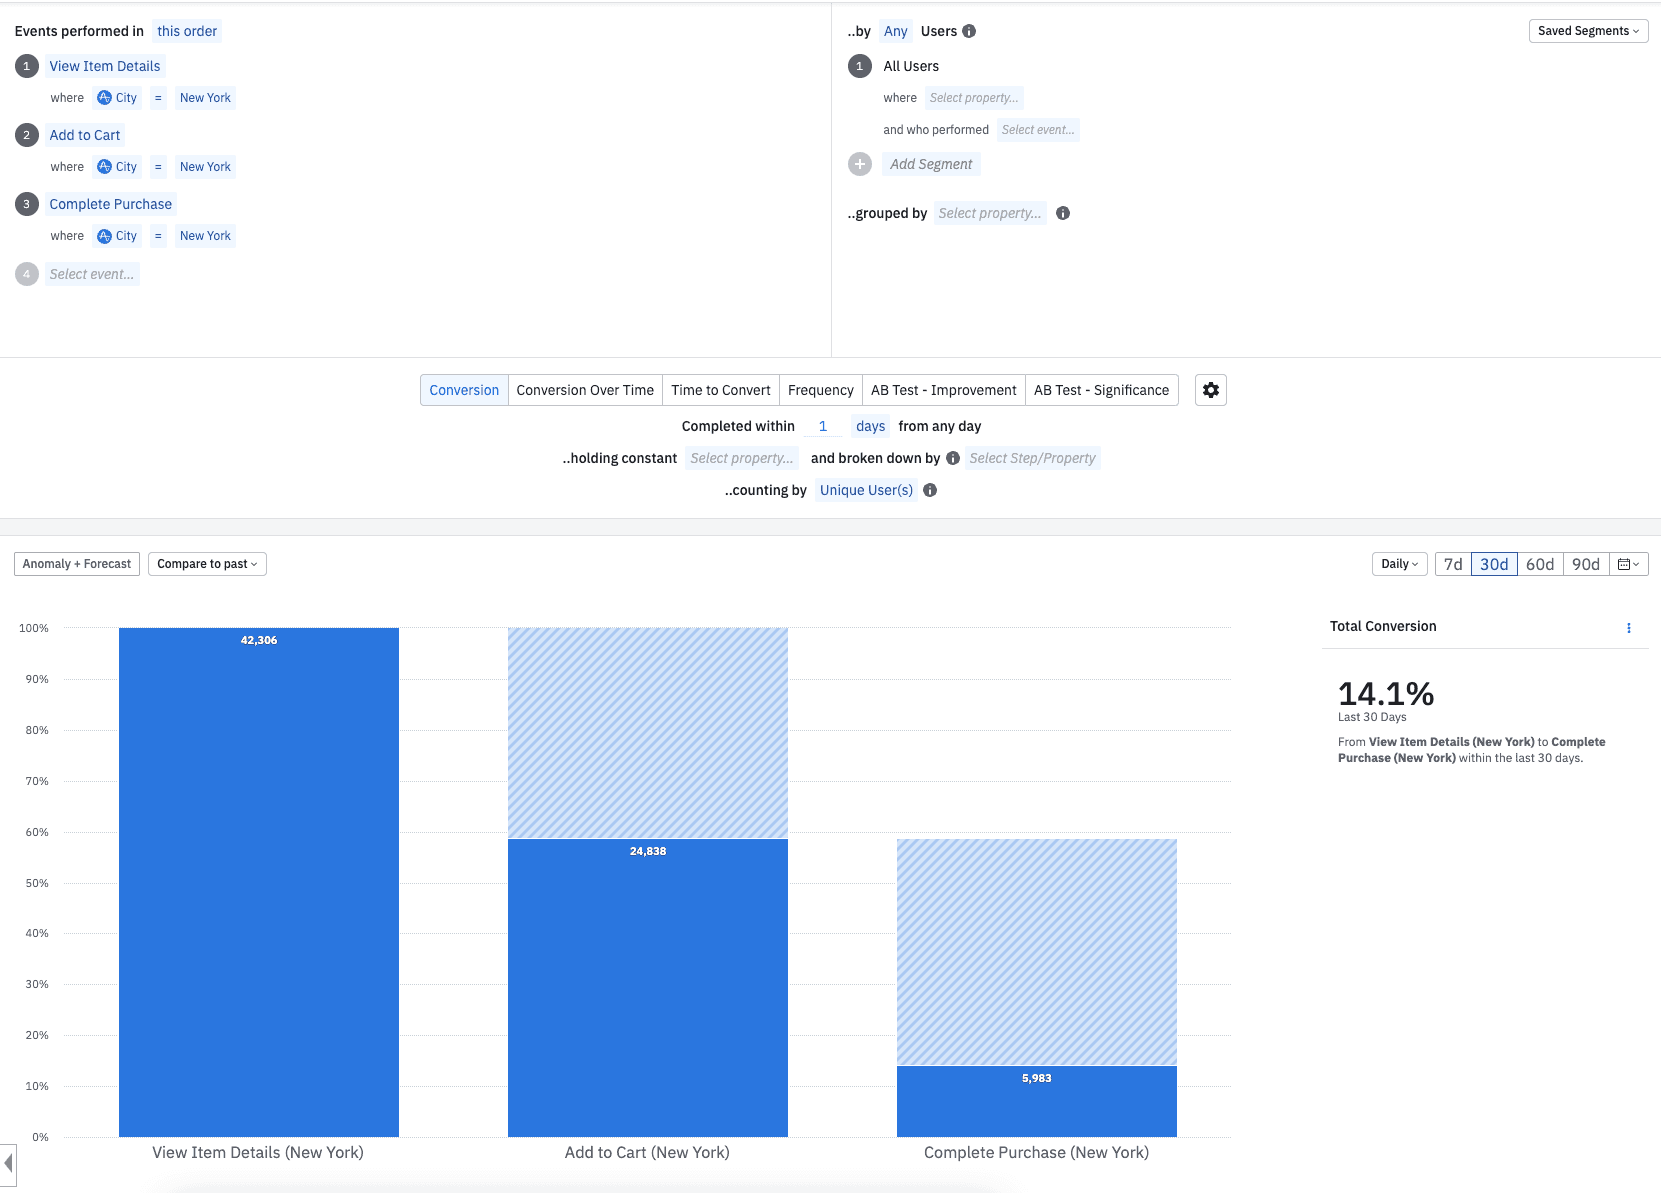
In this case, the overall conversion rate dropped from 14.2% to 14.1%. Again, this is routine in most digital analytics platforms.
But one of the interesting things about the previous two conversion funnels is that the customer could have performed the specified events for any number of products. For example, a customer could have viewed item details for products A, B, and C but may have only added products A and B to the cart and only purchased product B. The preceding conversion funnels count unique visitors that performed each event one or more times in the specified order, but it doesn’t specify if each step was performed for the same product. This distinction is important since a conversion funnel could have contained different products at each step and inflated the numbers. For example, a customer could have viewed item 94, added item 95 to the cart, and purchased item 96. The chart above would count as a conversion, but it doesn’t show us the conversion rate when each step is for the same product.
Of course, if desired, you could filter the conversion funnel for one specific product. For example, here is the conversion funnel filtered for item 96:
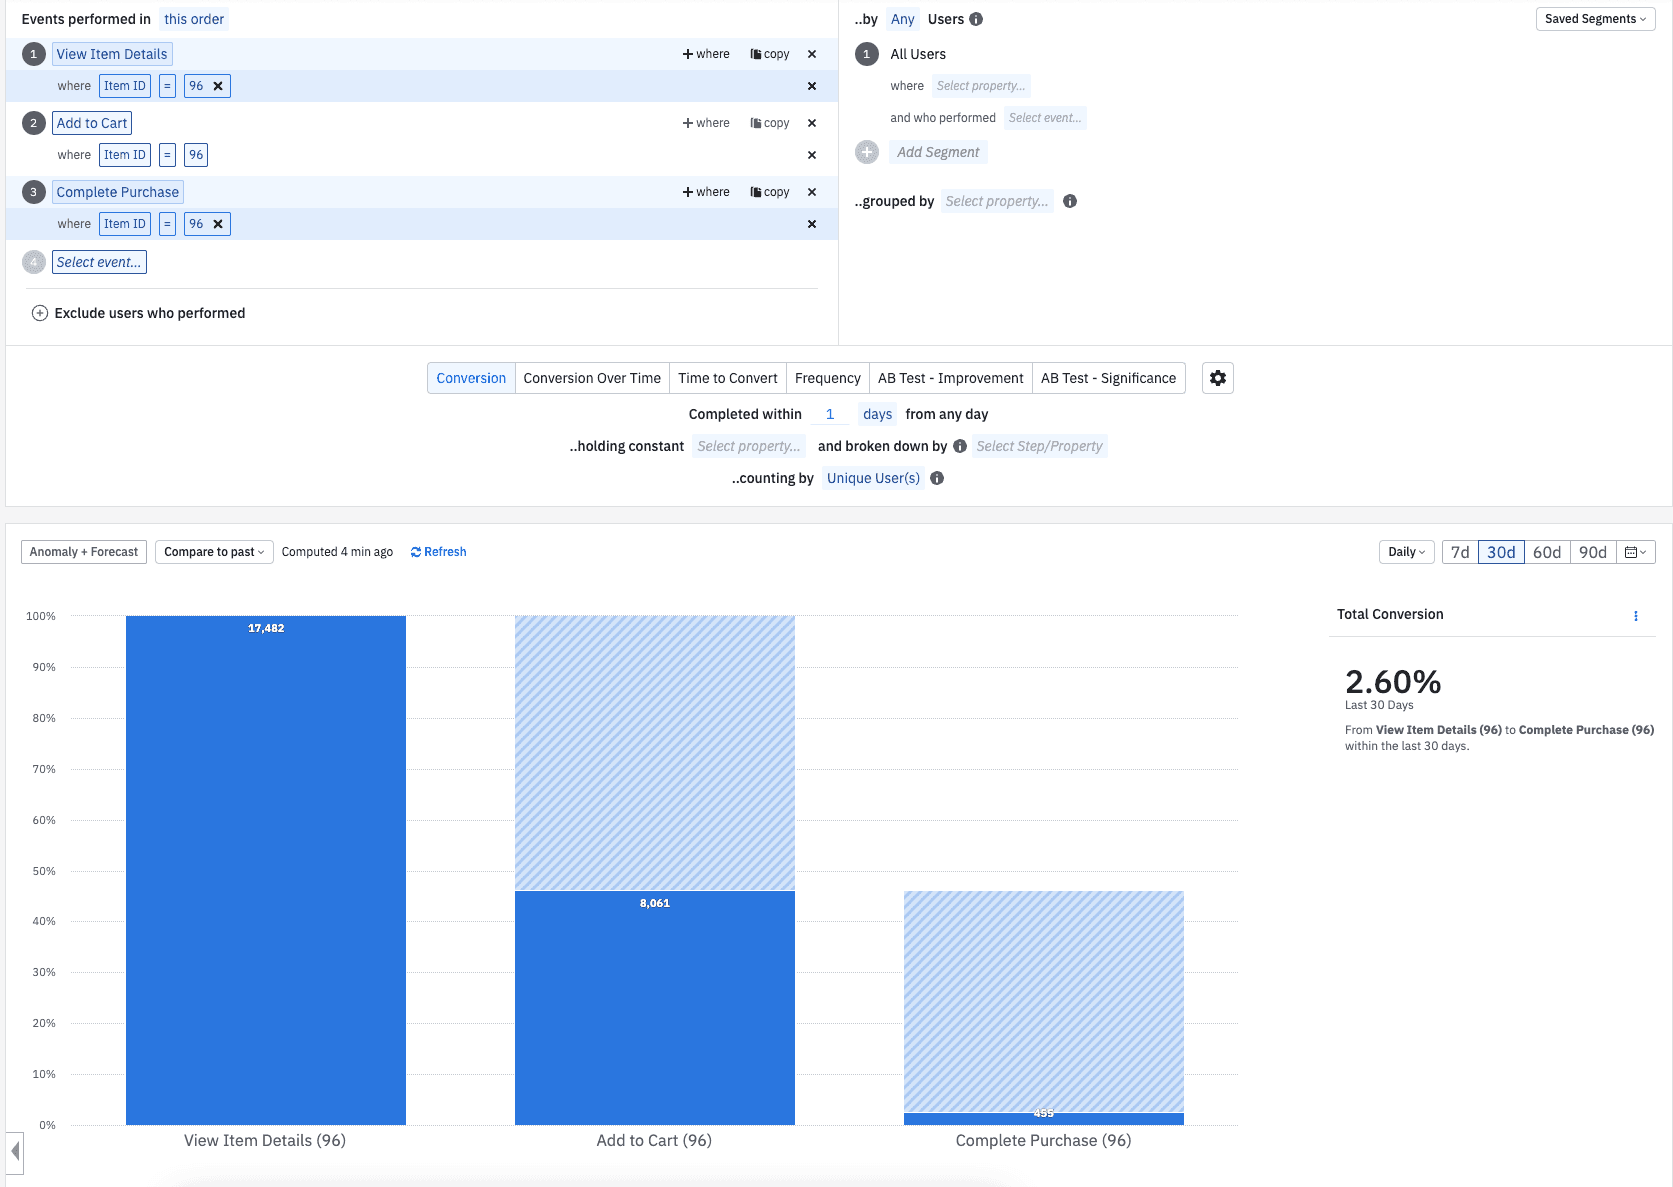
Now we can see that the conversion rate drops to 2.6% since the steps only count if they are for product 96.
But in our original question, we wanted to see the overall conversion rate for all products but only see the cases in which all three funnel steps were for the same product. While this may sound easy, it isn’t. Most digital analytics platforms cannot do this. Of course, you can build a separate conversion funnel for each product like the one for product 96 above, but that isn’t feasible if you have many products and it still doesn’t answer the question. The digital analytics platform must review all conversion funnel steps and only count cases in which the same product is present in all three steps but perform that conversion calculation for all products simultaneously. In Amplitude, you do this using the holding constant feature.
To use the holding constant feature, you specify the property that you want to hold constant within the report settings area. In this case, you would specify the Item property as shown here:
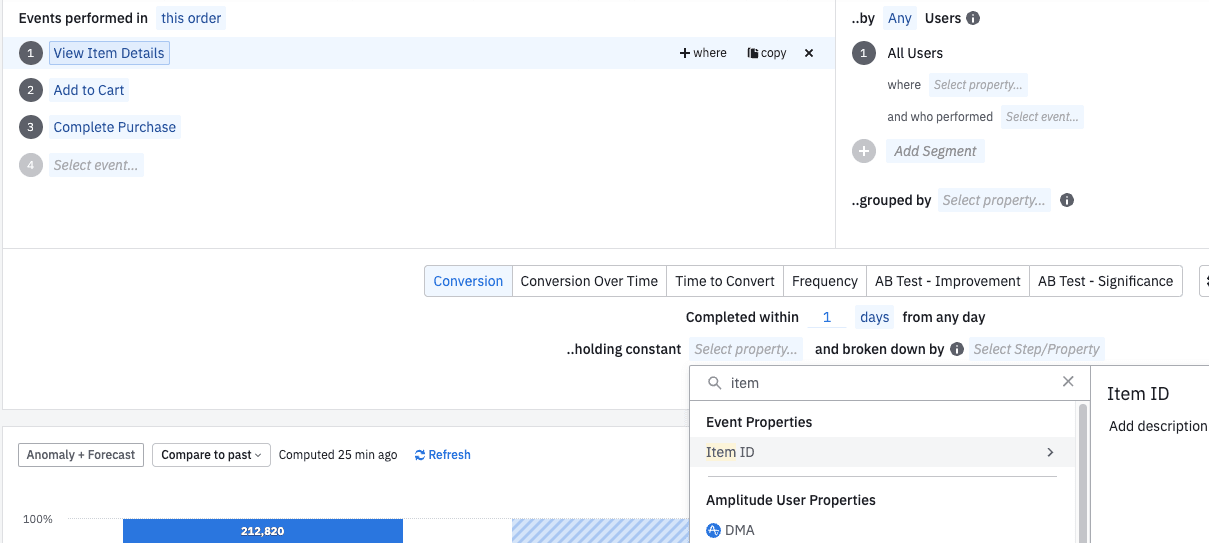
With that minor change, Amplitude will filter all conversion funnel events to ensure they are all related to the same item/product, and the conversion funnel would recalculate to show this:
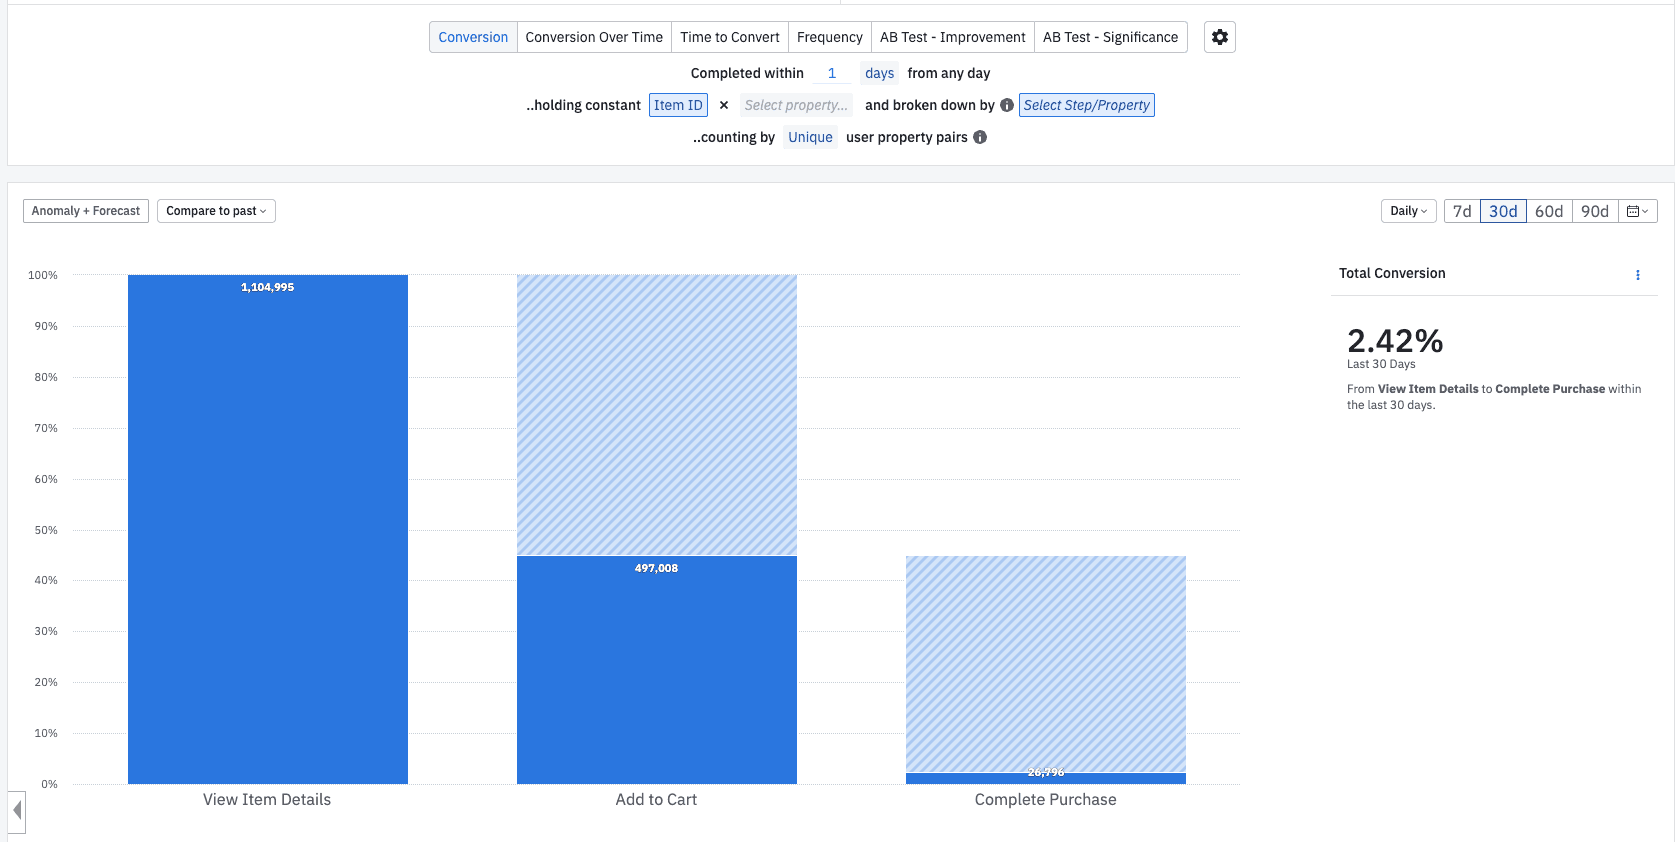
Now you can see that the overall conversion rate from View Item Details to Complete Purchase when it is the same product is 2.42%. This significant conversion drop indicates that visitors view and add many different products to the cart but are much less likely to bring one product through all three conversion steps. While performing this type of analysis in Amplitude is easy, I can assure you that it is virtually impossible with other digital analytics platforms. I am amazed that Amplitude can so easily do something so powerful!
If you want to take things one step further, add an additional holding constant property. For example, let’s say that I want to see the conversion funnel for the same product and only show conversion when the steps take place in the same session. This scenario is the same principle, except we now want to keep the Session ID constant. To do this, we can add Session ID to the holding constant settings area:
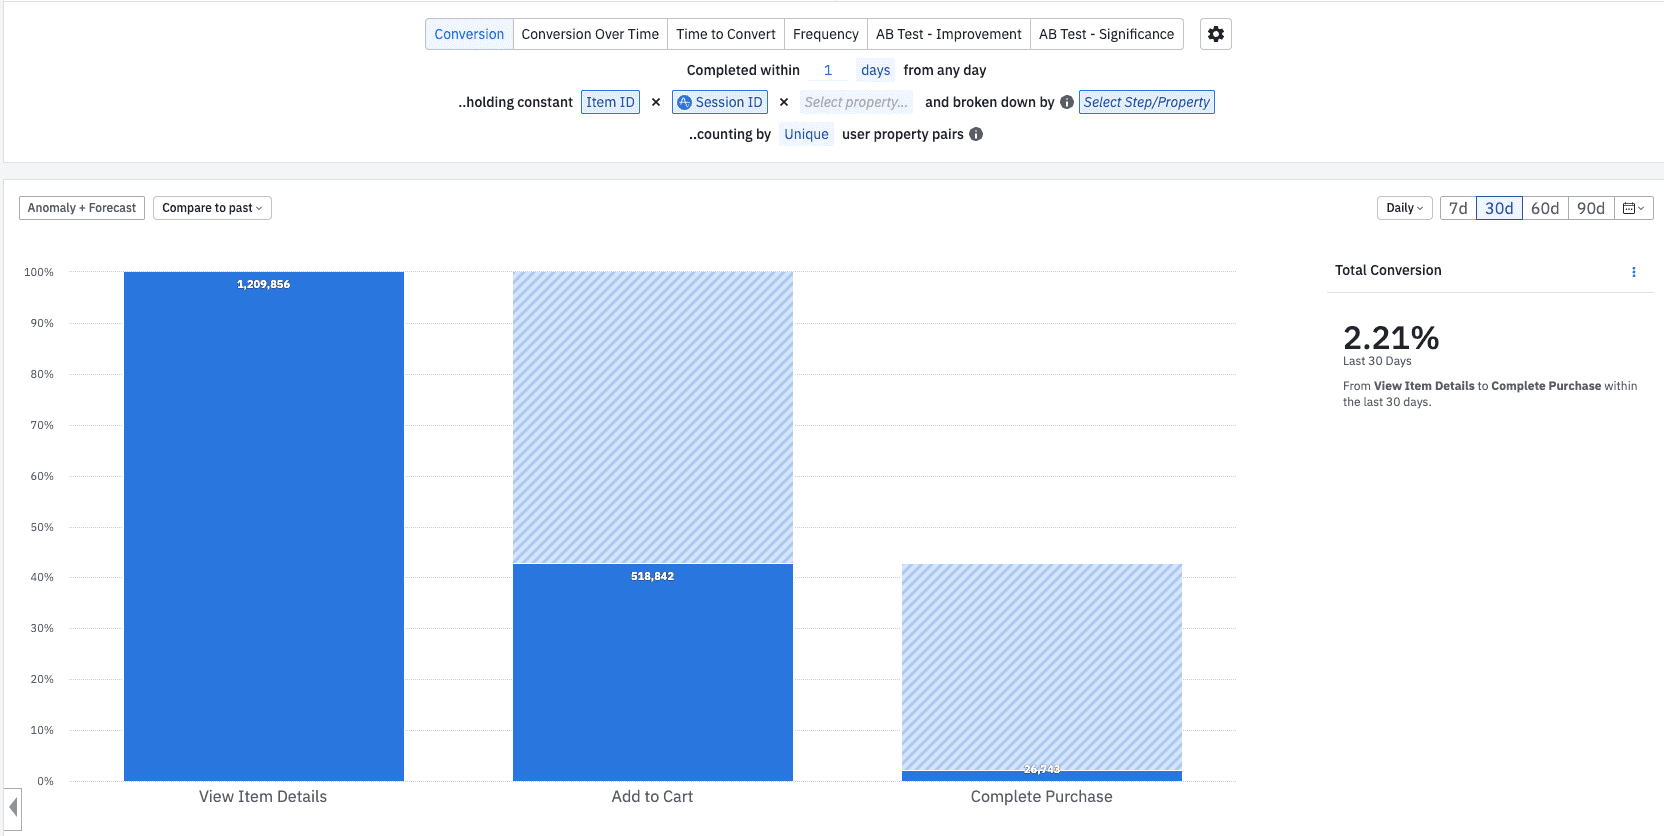
In this case, the overall conversion rate fell from 2.42% to 2.21%, which tells us that most customers convert within one session.
While it is easy to say that all digital analytics platforms are the same, I have found that when you dive into the details, you often discover what your chosen platform can and cannot do. I have been pleasantly surprised by how many things I assumed would not be possible based upon my past experience turn out to not only be possible but relatively easy in Amplitude!
If you want to learn more about conversion funnels in Amplitude, click here or click on the CTA below.

Adam Greco
Former Product Evangelist, Amplitude
Adam Greco is one of the leading voices in the digital analytics industry. Over the past 20 years, Adam has advised hundreds of organizations on analytics best practices and has authored over 300 blogs and one book related to analytics. Adam is a frequent speaker at analytics conferences and has served on the board of the Digital Analytics Association.
More from Adam

