
The hardest part of a designer’s job is evangelizing the impact of your design. Often times, it’s a matter of debate and something I like to call committee-jira-ticket-creation. Ultimately, these conversations are rooted in opinion and even you, the designer, will never truly be able to fully predict whether or not a design is “good/successful”.
It is not my job to become a data scientist, but it is my job to uphold experience quality. After joining Amplitude about a year ago, I picked up a healthy little habit. I now set metrics against the design I ship, and it has changed my life. It’s one of my favorite things that the design team practices here.
I have fully embraced metrics-driven design for three reasons:
1. “Failure” is empowering.
Setting a metric will seem like you’ve now attached the notion of failure or success to your design when that is not at all the point. What happens if you don’t meet your metric? You now have the opportunity to fix it. You can now improve on the MVP you were forced to scope down.
2. Moves product design beyond the pixels.
As professional perfectionists, product designers get trapped in a circular loop of always improving the product. Seeking out perfection is never ending and exhausting. If you make perfection your goal, you will never reach it. How often have you looked at a design and realized that you still see every flaw and make a mental note of what you could have/should have done.
When you set a target, and you meet it, you’ll look at a feature and you’ll be able to say “we increased the conversion rate by 3%” even though the spacing was off by 1 pixel.
When you become accountable to an outcome, you stop caring about perfection and instead start thinking about what will best serve the customer as soon as possible.
3. Celebrate something real.
It’s tempting to celebrate the moments you see your ideas come alive—when the feature ships. But just because something is built, does not mean it was beneficial. We don’t get excited when we release features. We celebrate when we hit our success metric. It is your .
Related Reading: How to Set Metrics for Product Launches
Example of metrics-driven product design
Let’s use a real life example of a feature improvement of something we’ve been working on: Search.
The current lay of the land:
The current lay of the land
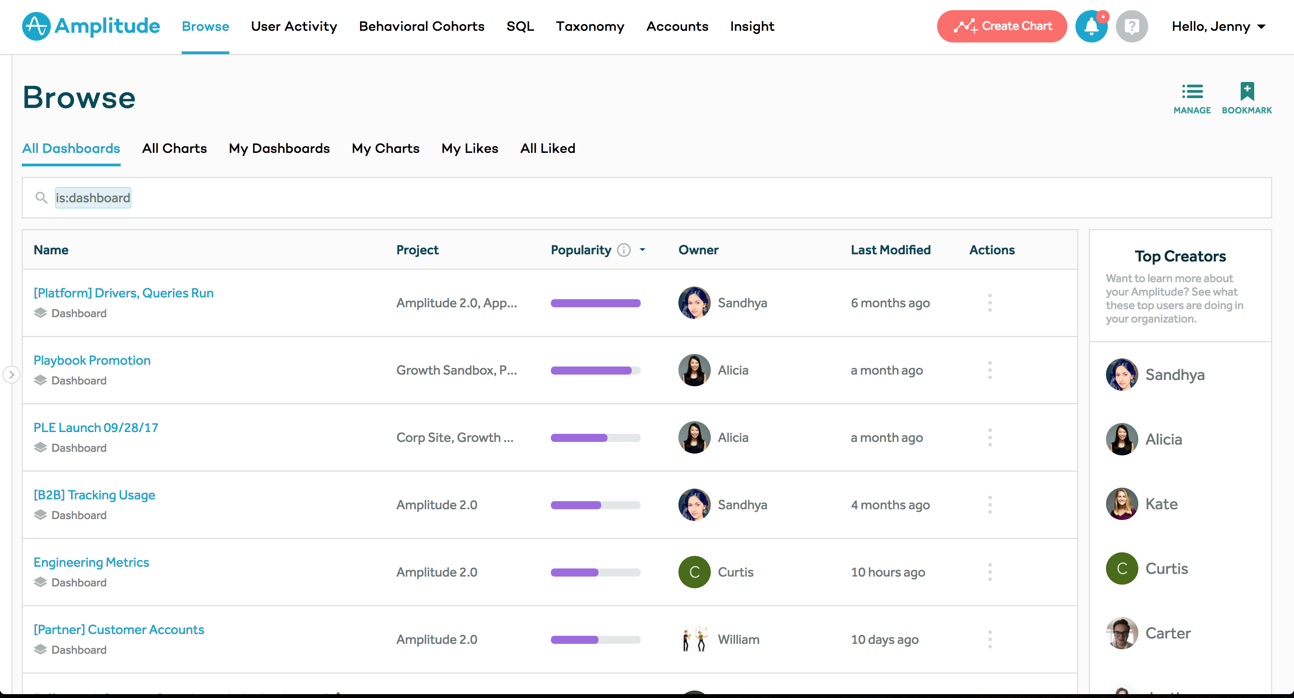
We’ve added and added onto our search over the years. Through qualitative research calls (and consistent complaints), we’ve discovered that our existing experience is very jarring. 2.3% of our users actually make a search on the page!
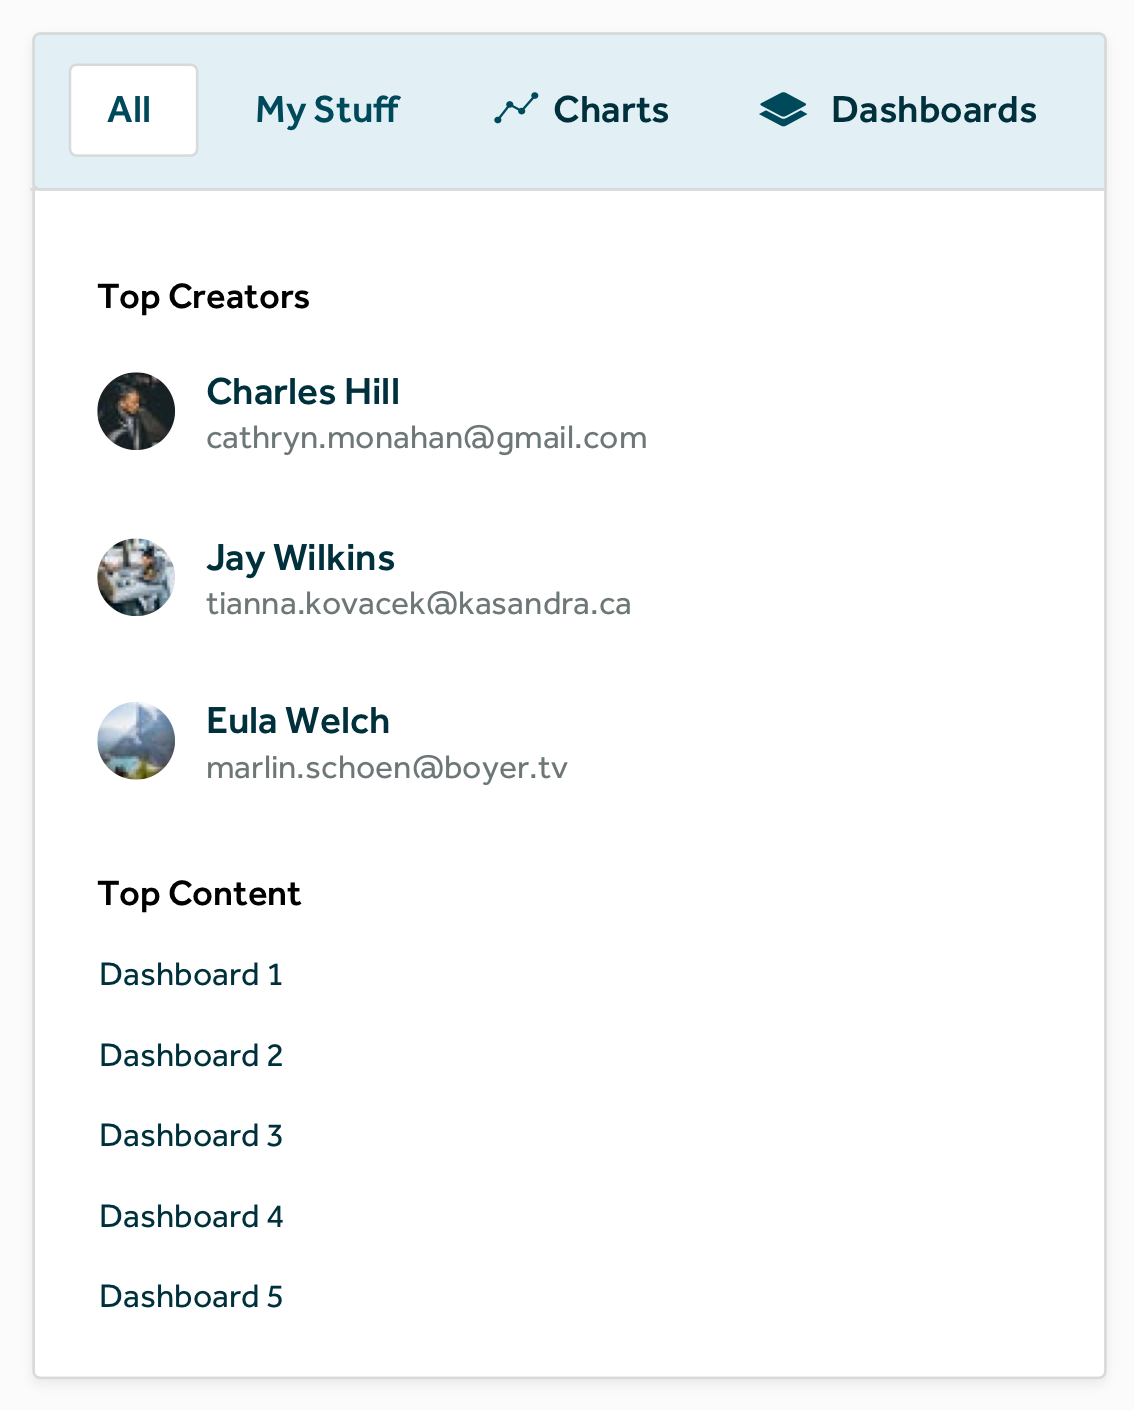
The proposed design:
The proposed design
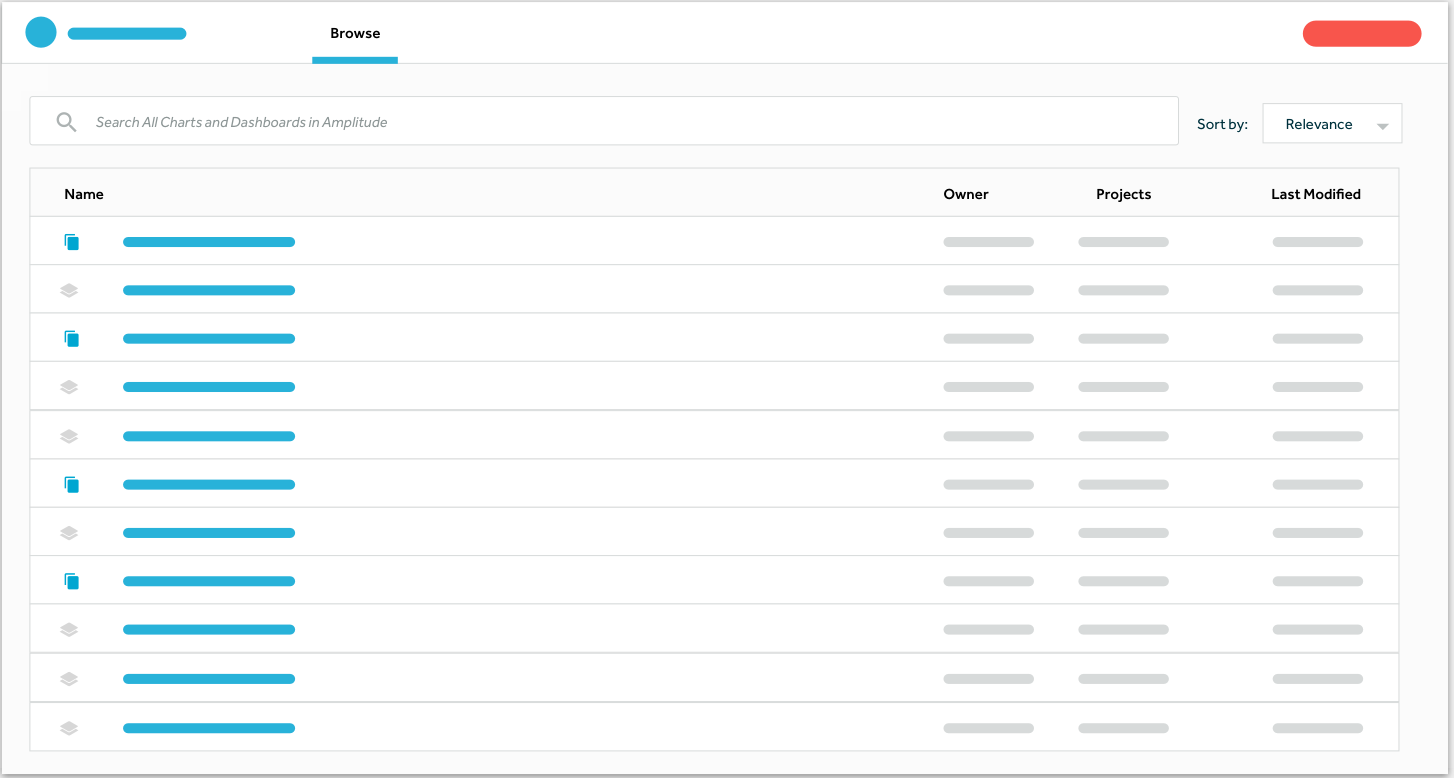
The proposed design
Our hypothesis for this new design
This new design came with a multitude of aggressive decisions around simplification. Our strong hypothesis, validated by , was that every element on the page increased the of a user. It created the need for a user to take in everything on the page, and by doing so, intimidated them and had prevented from actually searching for what they wanted. How did we hold ourselves accountable in validating this hypothesis?
Related Reading: Every Product Needs a North Star Metric: Here’s How to Find Yours
We looked at the metrics that currently exist. We had been tracking every filter and element on the page and seen which elements had low adoption and which elements had high adoption. We then made the decision to eliminate the ones that users weren’t using and keep ones that users were using. Here’s my dashboard that I used to track everything:
my dashboard that I used to track everything
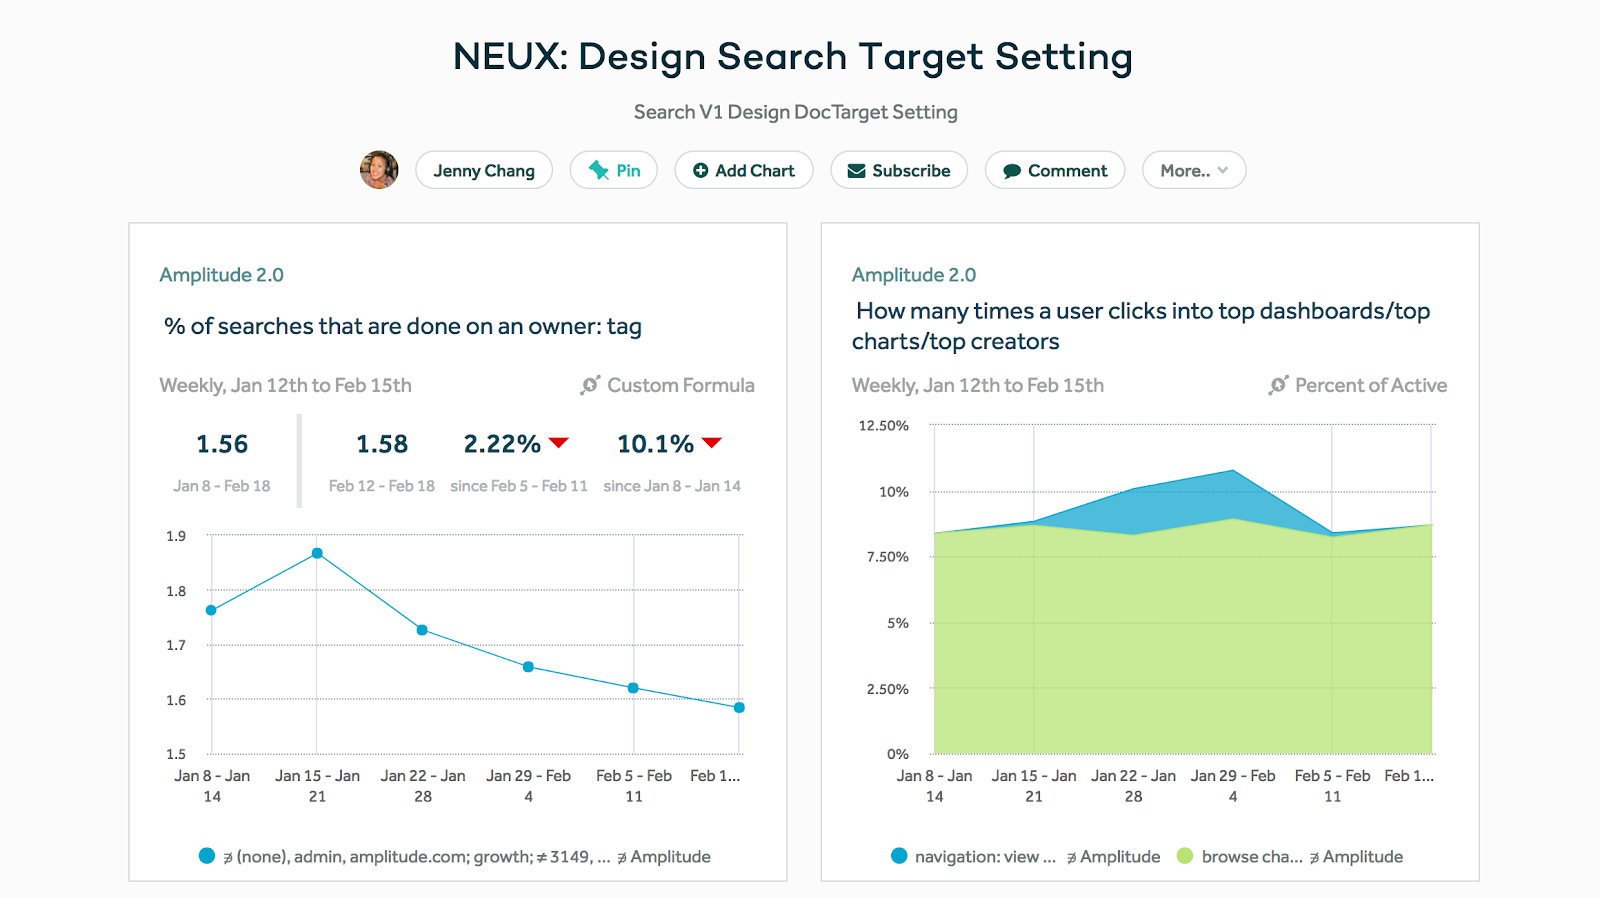
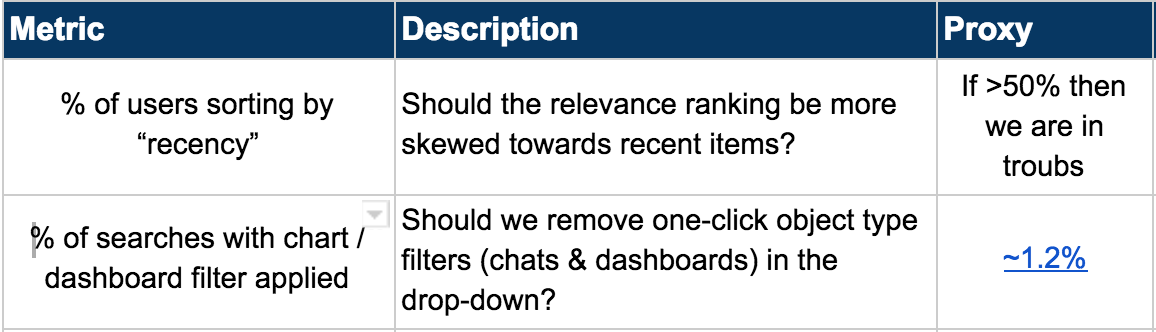
And the existing behaviors that were indirectly related to our hypotheses (Proxy metrics).
There are two that I want to dive into:
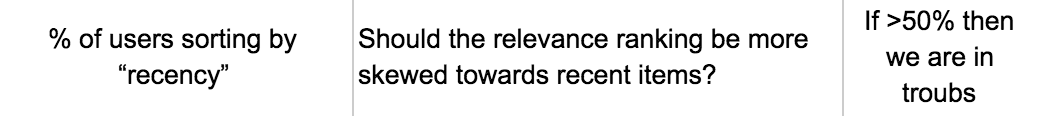
- The number of times users change their default sort
- Frequency of users filter on object type
Looking at the first one: How often do users change their default sort?
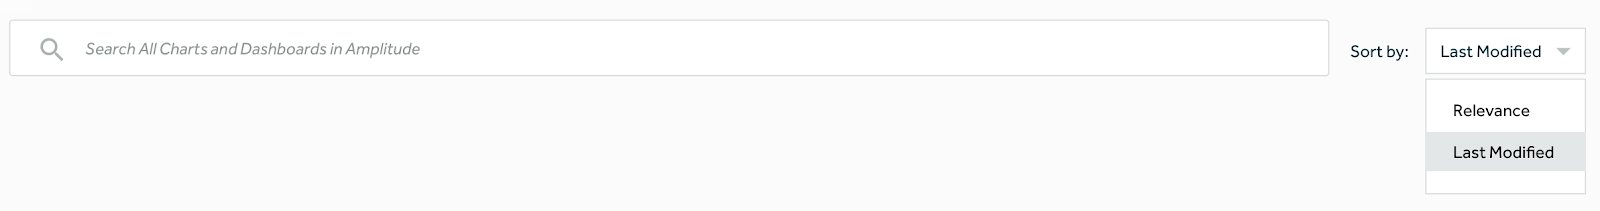
What’s the deal with this dropdown choice? We could have easily left this out of our first version.
It’s there to test out our new relevance ranking!
A fun experiment to run with releases is to see what kinds of signals you’re able to test with intentional design decisions. Not everything has to improve an existing proxy! If a user is performing an action to change a default setting, it is a good measure of something that isn’t working.
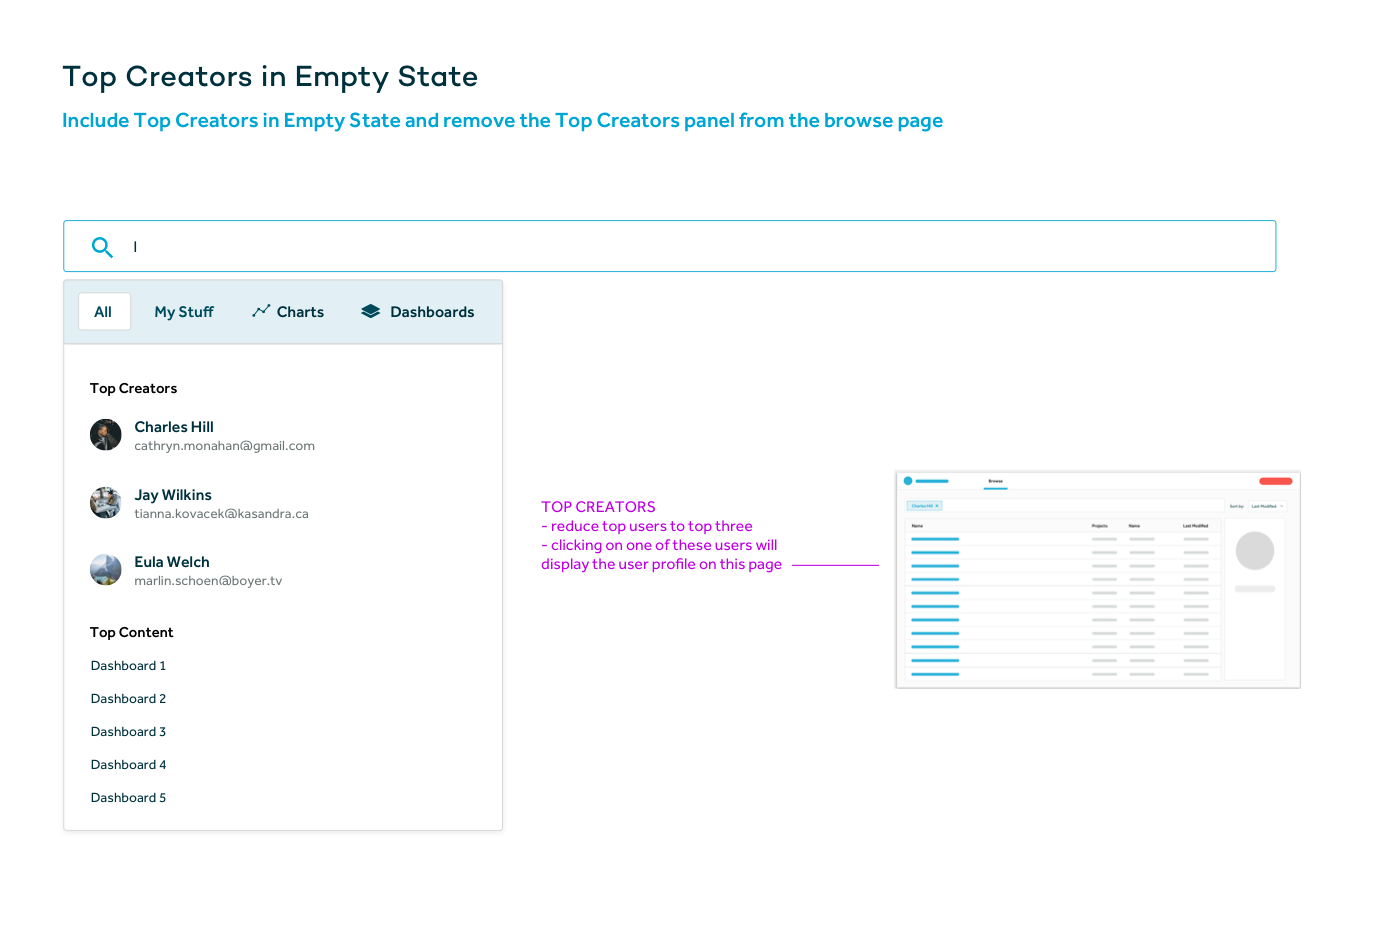
Now for the second one, How often do users filter on object type?
In Amplitude, we have two types of objects available in our search page: Charts and Dashboards. Our proxy metric told us that only 1.2% of our users filter on Charts and Dashboards. It could be a discoverability issue OR users don’t care about it.
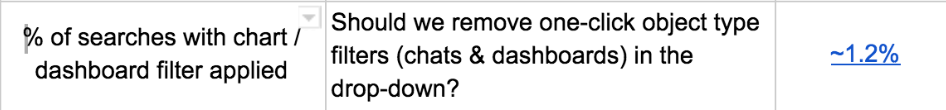
The new design (shown below) displays filters in a dropdown so that a user is able to more easily filter between object types, however, if this does not significantly increase we’re definitely removing those filters from this dropdown.
It’s easy to agree to a “nice to have” by slapping on filters all over the place but holding yourself accountable to what actually matters to the user is the key to a simple and meaningful simplistic user experience.
We have since shipped this new design, and currently our team is currently working on the next iteration. Our jobs are never done because the data always inspires us to work on the v1.1. Stay tuned for more data + design examples on the features we ship. We’re always looking to be inspired with what you’re building as well. Reach out to us if you have similar experiments you’re running with your designs!