Increase Shopping Cart Values in Ecommerce in 6 Clicks
Get customers to add more items to their shopping carts and increase average spend on your website using this simple strategy from Amplitude.
If you work in ecommerce, you’ve probably asked yourself, “How can I get our customers to increase their average order size?” Well, look no further. Here’s a data-driven strategy to maximize your customer value.
Run an Ecommerce Funnel Analysis
Funnel analysis is something you can do with Amplitude, starting off with a Funnel Analysis chart.
Here, we have a typical ecommerce conversion funnel. I can see how my customers go from viewing items to adding those items to their cart to finally completing a purchase. I see here that there’s a significant drop off between the first two steps of the funnel: viewing an item and adding it to their cart.
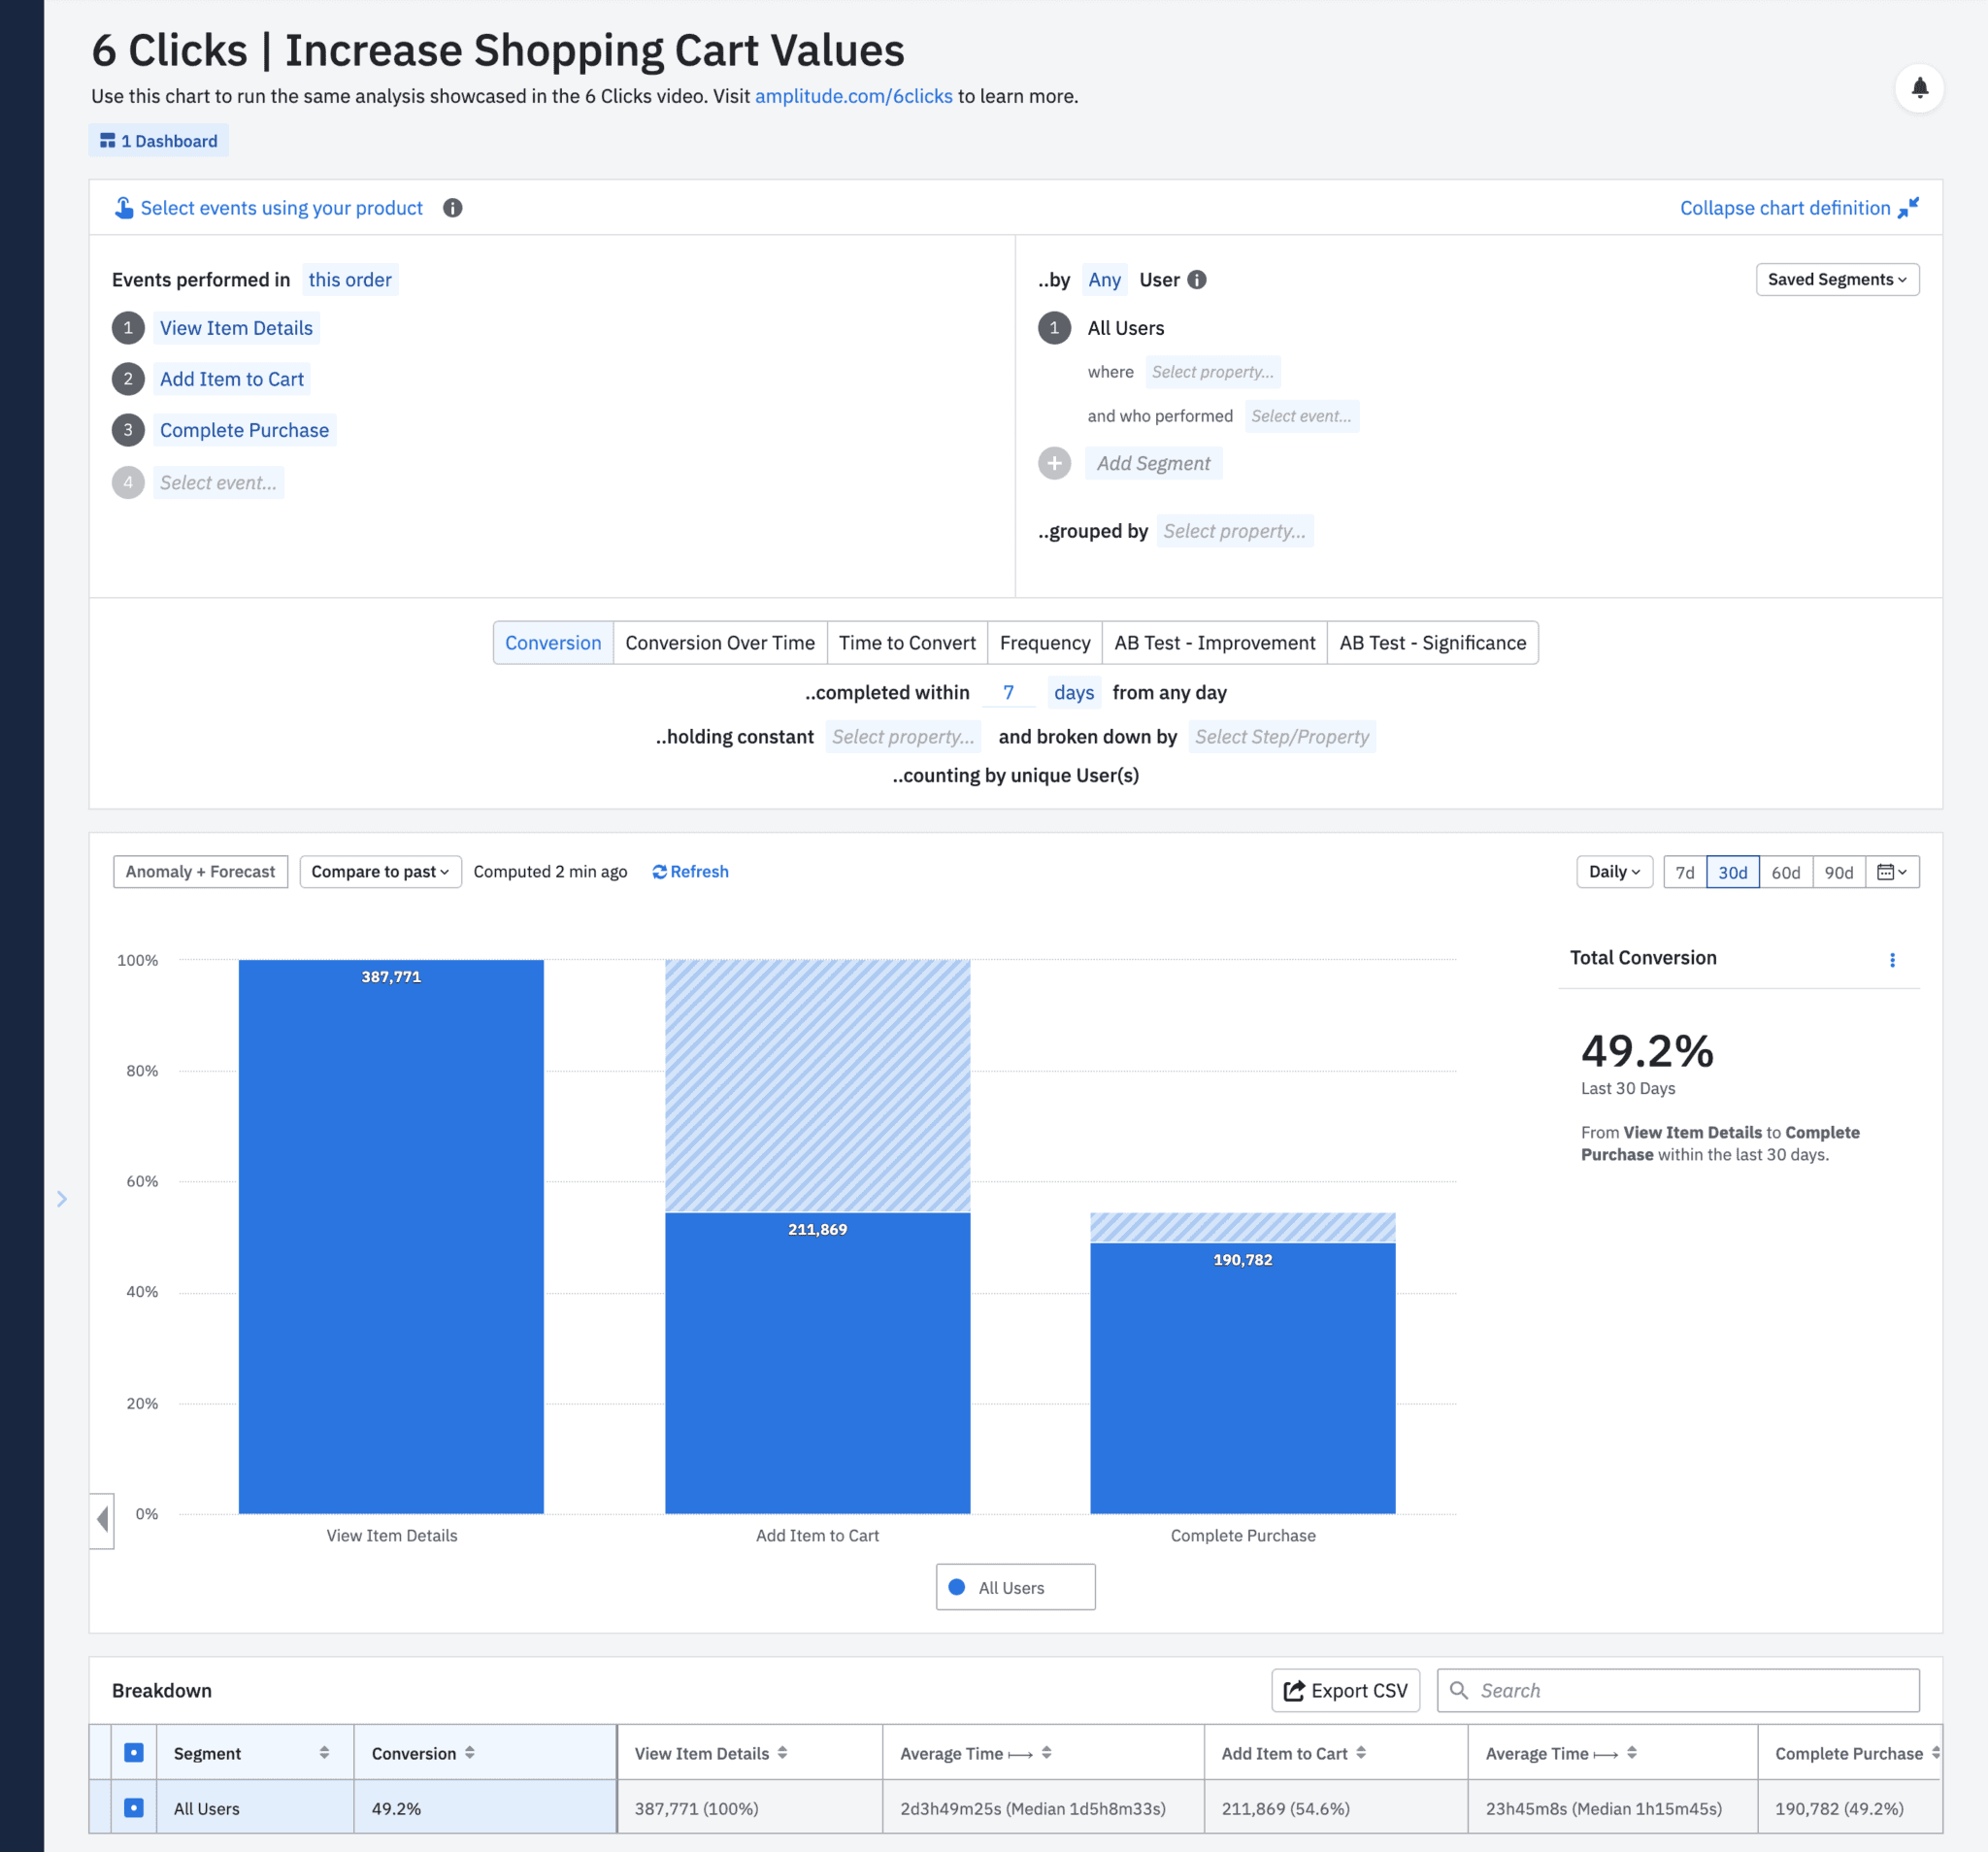
This is a big opportunity for improvement. The solid blue bar represents everyone who converted from the first step. However, the grayed out portion represents everyone who dropped off. I’m going to explore the behavior of these converted customers to see what compelled them to take this action.
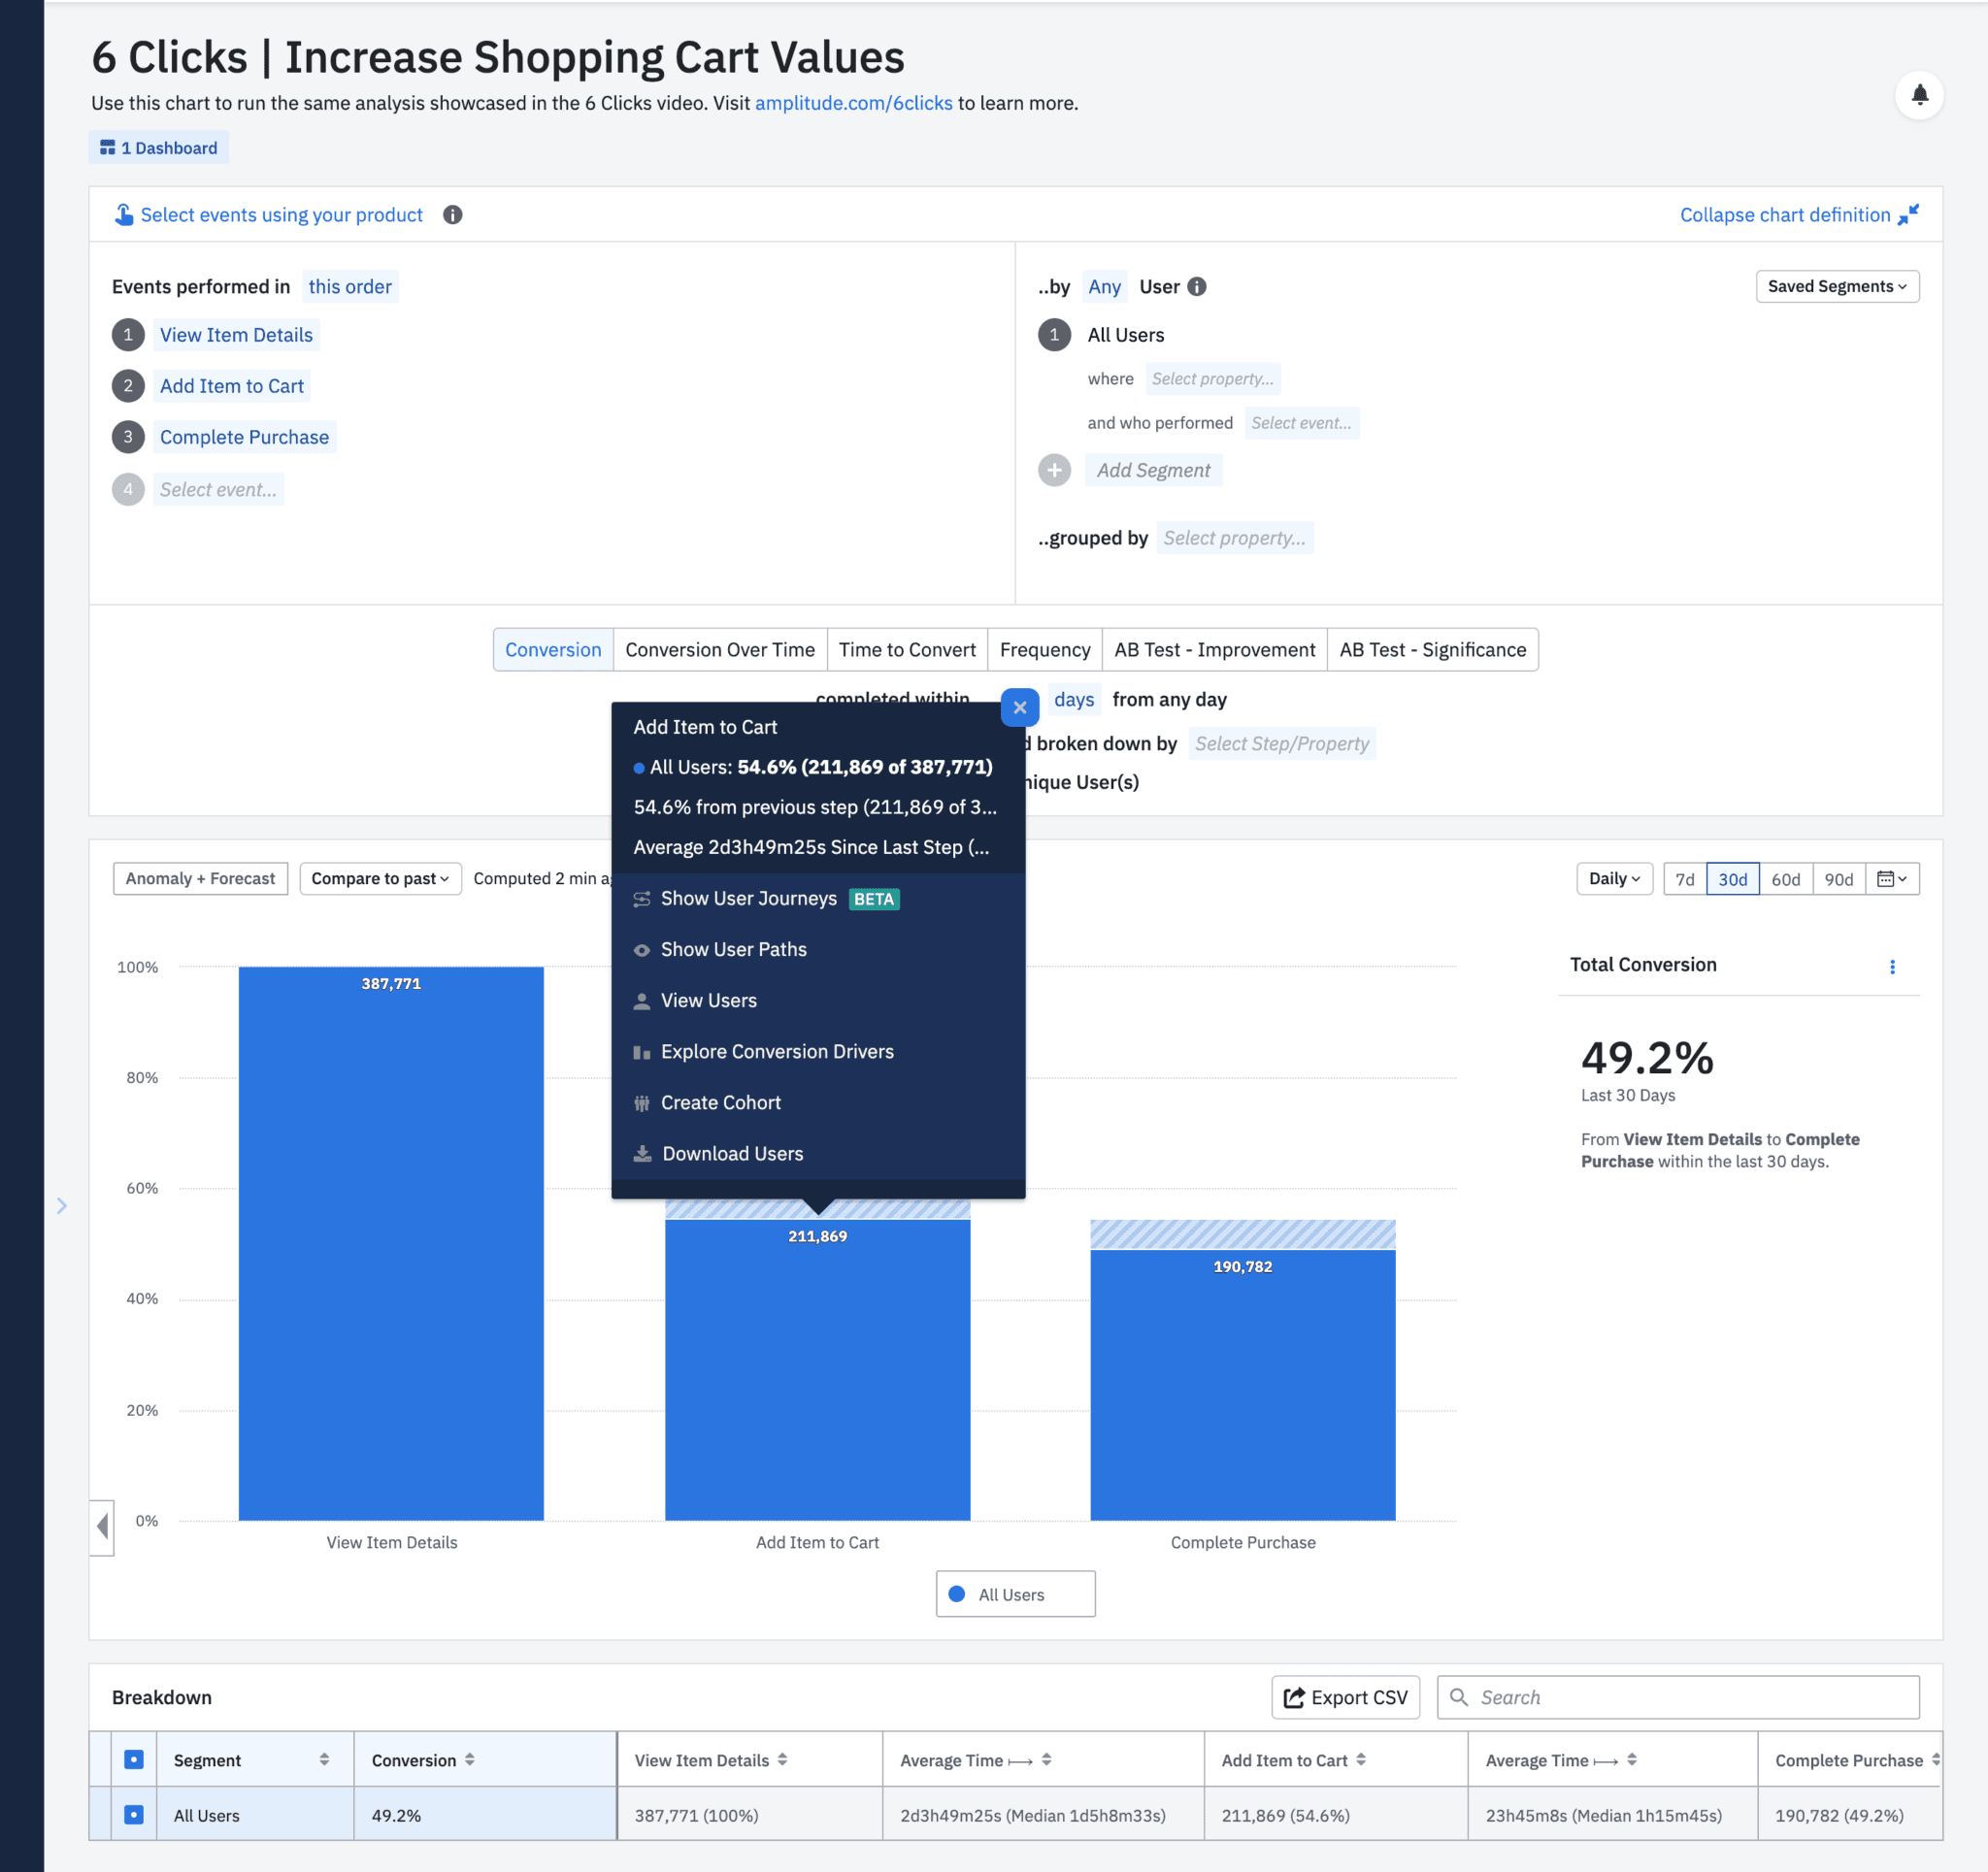
First, I click the solid blue portion. That’s click one.
Find Which Actions Are Correlated with Adding Items to the Cart
Then, I select “Explore Conversion Drivers.” This opens up a panel called Conversion Drivers. It’s a really cool feature that literally shows me which events are correlated with a successful conversion between two steps.
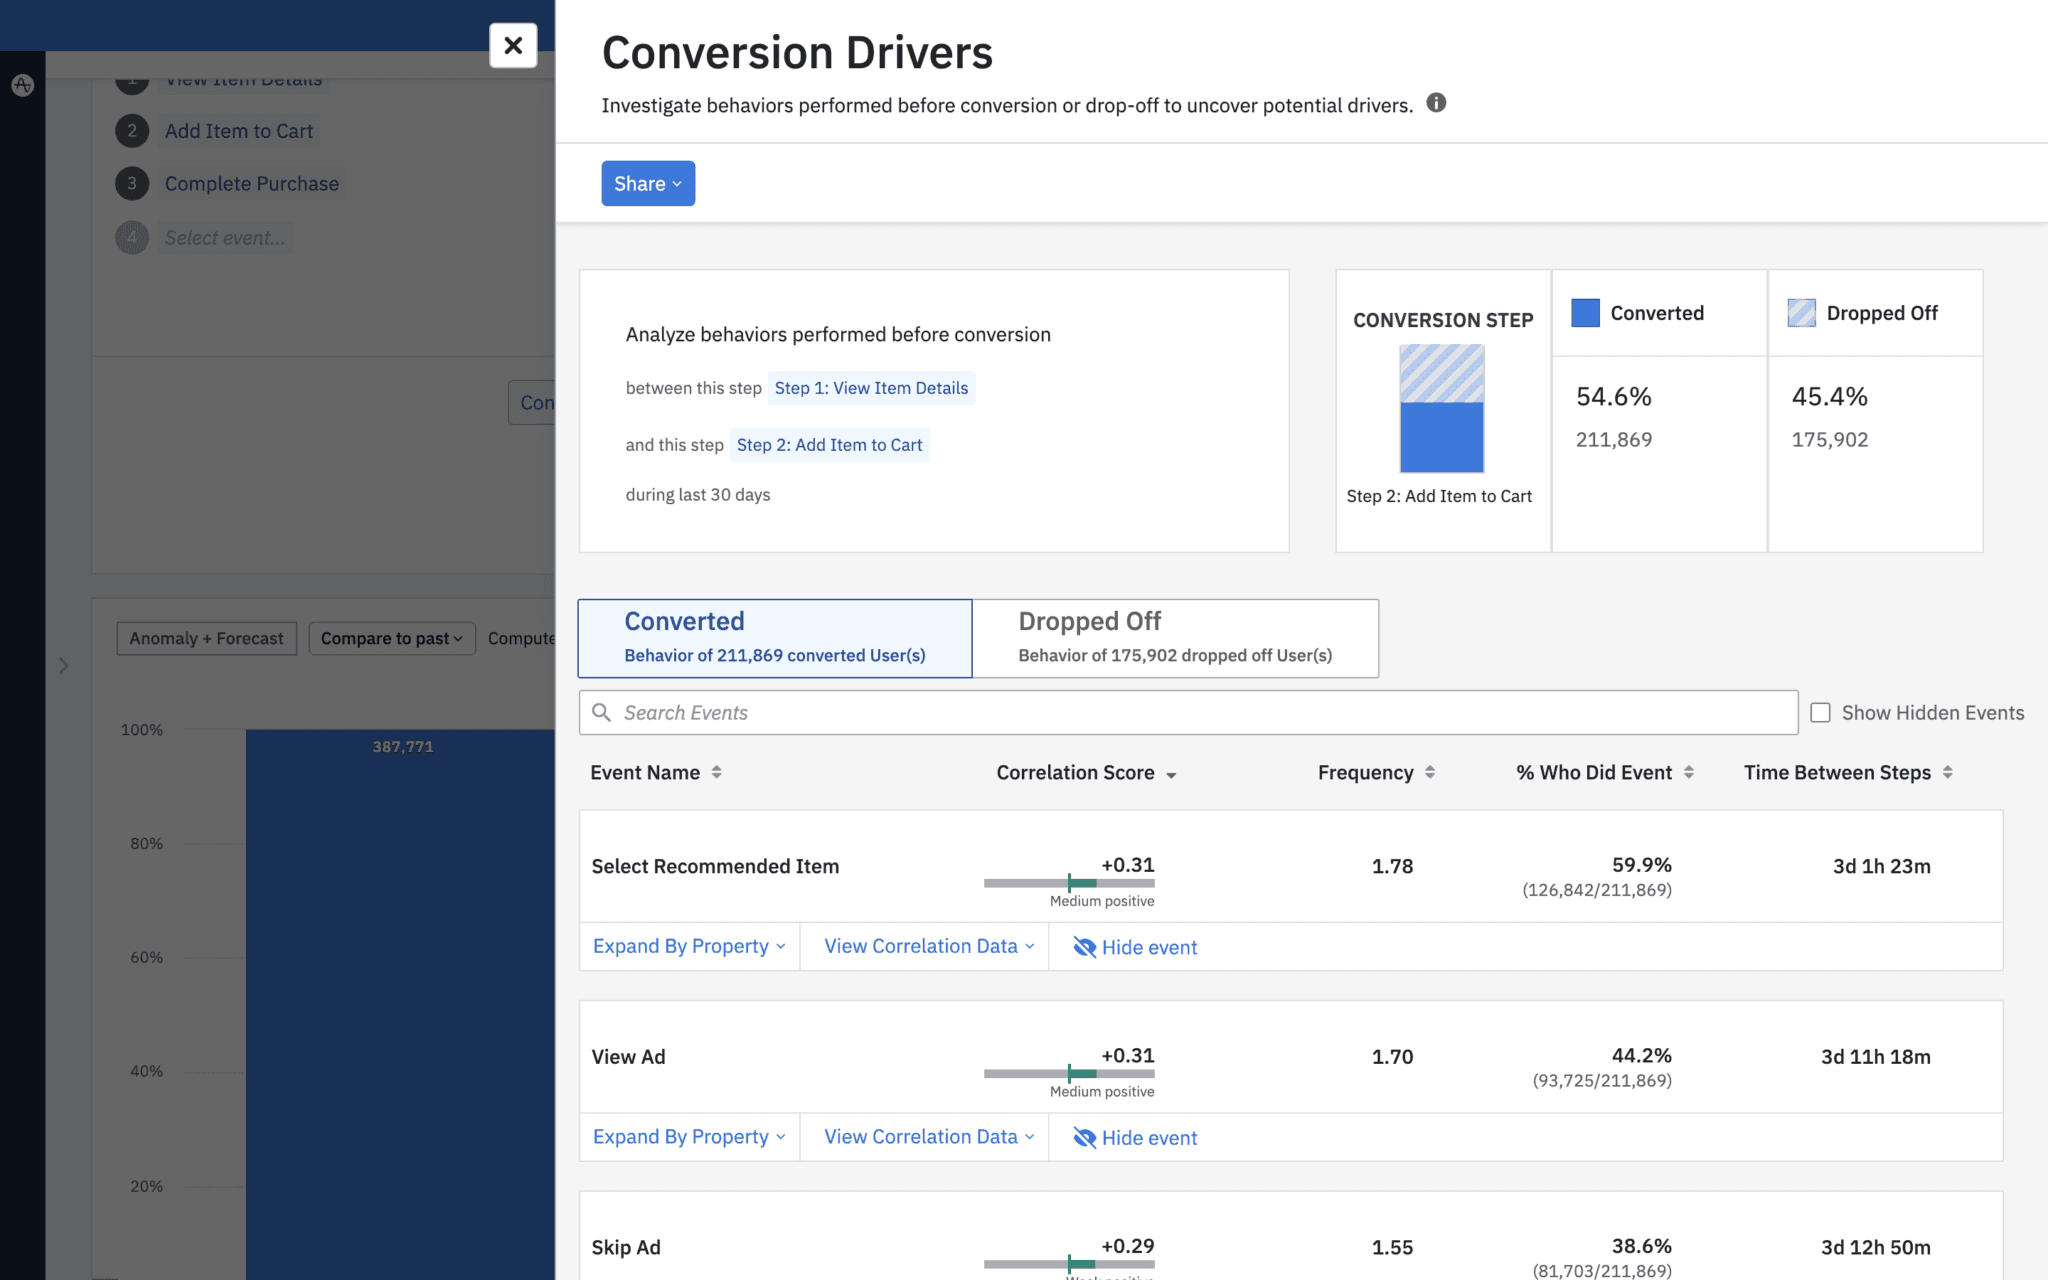
So this view is looking at all of the customers who converted on step two, and it’s showing me what they did after step one, viewing an item, but before step two, which is adding an item to their cart. In other words, Amplitude is saying, “Hey, I looked at the behavior of more than a 100,000 customers who have successfully converted and this is something they tend to share in common.
Here, I see that the action most correlated with driving conversion is this event called “Select a Recommended Item.” That’s a huge insight. My customers may be more inclined to add an item to their cart if they see and then select an item that’s been recommended to them.

Now, I could stop here. We’ve already found one way to increase sales, and that means that if we recommend more items, more customers will purchase them. But with something like Amplitude, I can always keep asking questions of my own data; there’s always more to learn. So let’s go deeper.
Now, I definitely want to know which recommended items helped users convert at a higher percentage. So I’ll click “Expand by Property.” This shows me a number of options to choose from, but for now I’ll select “Brand.”
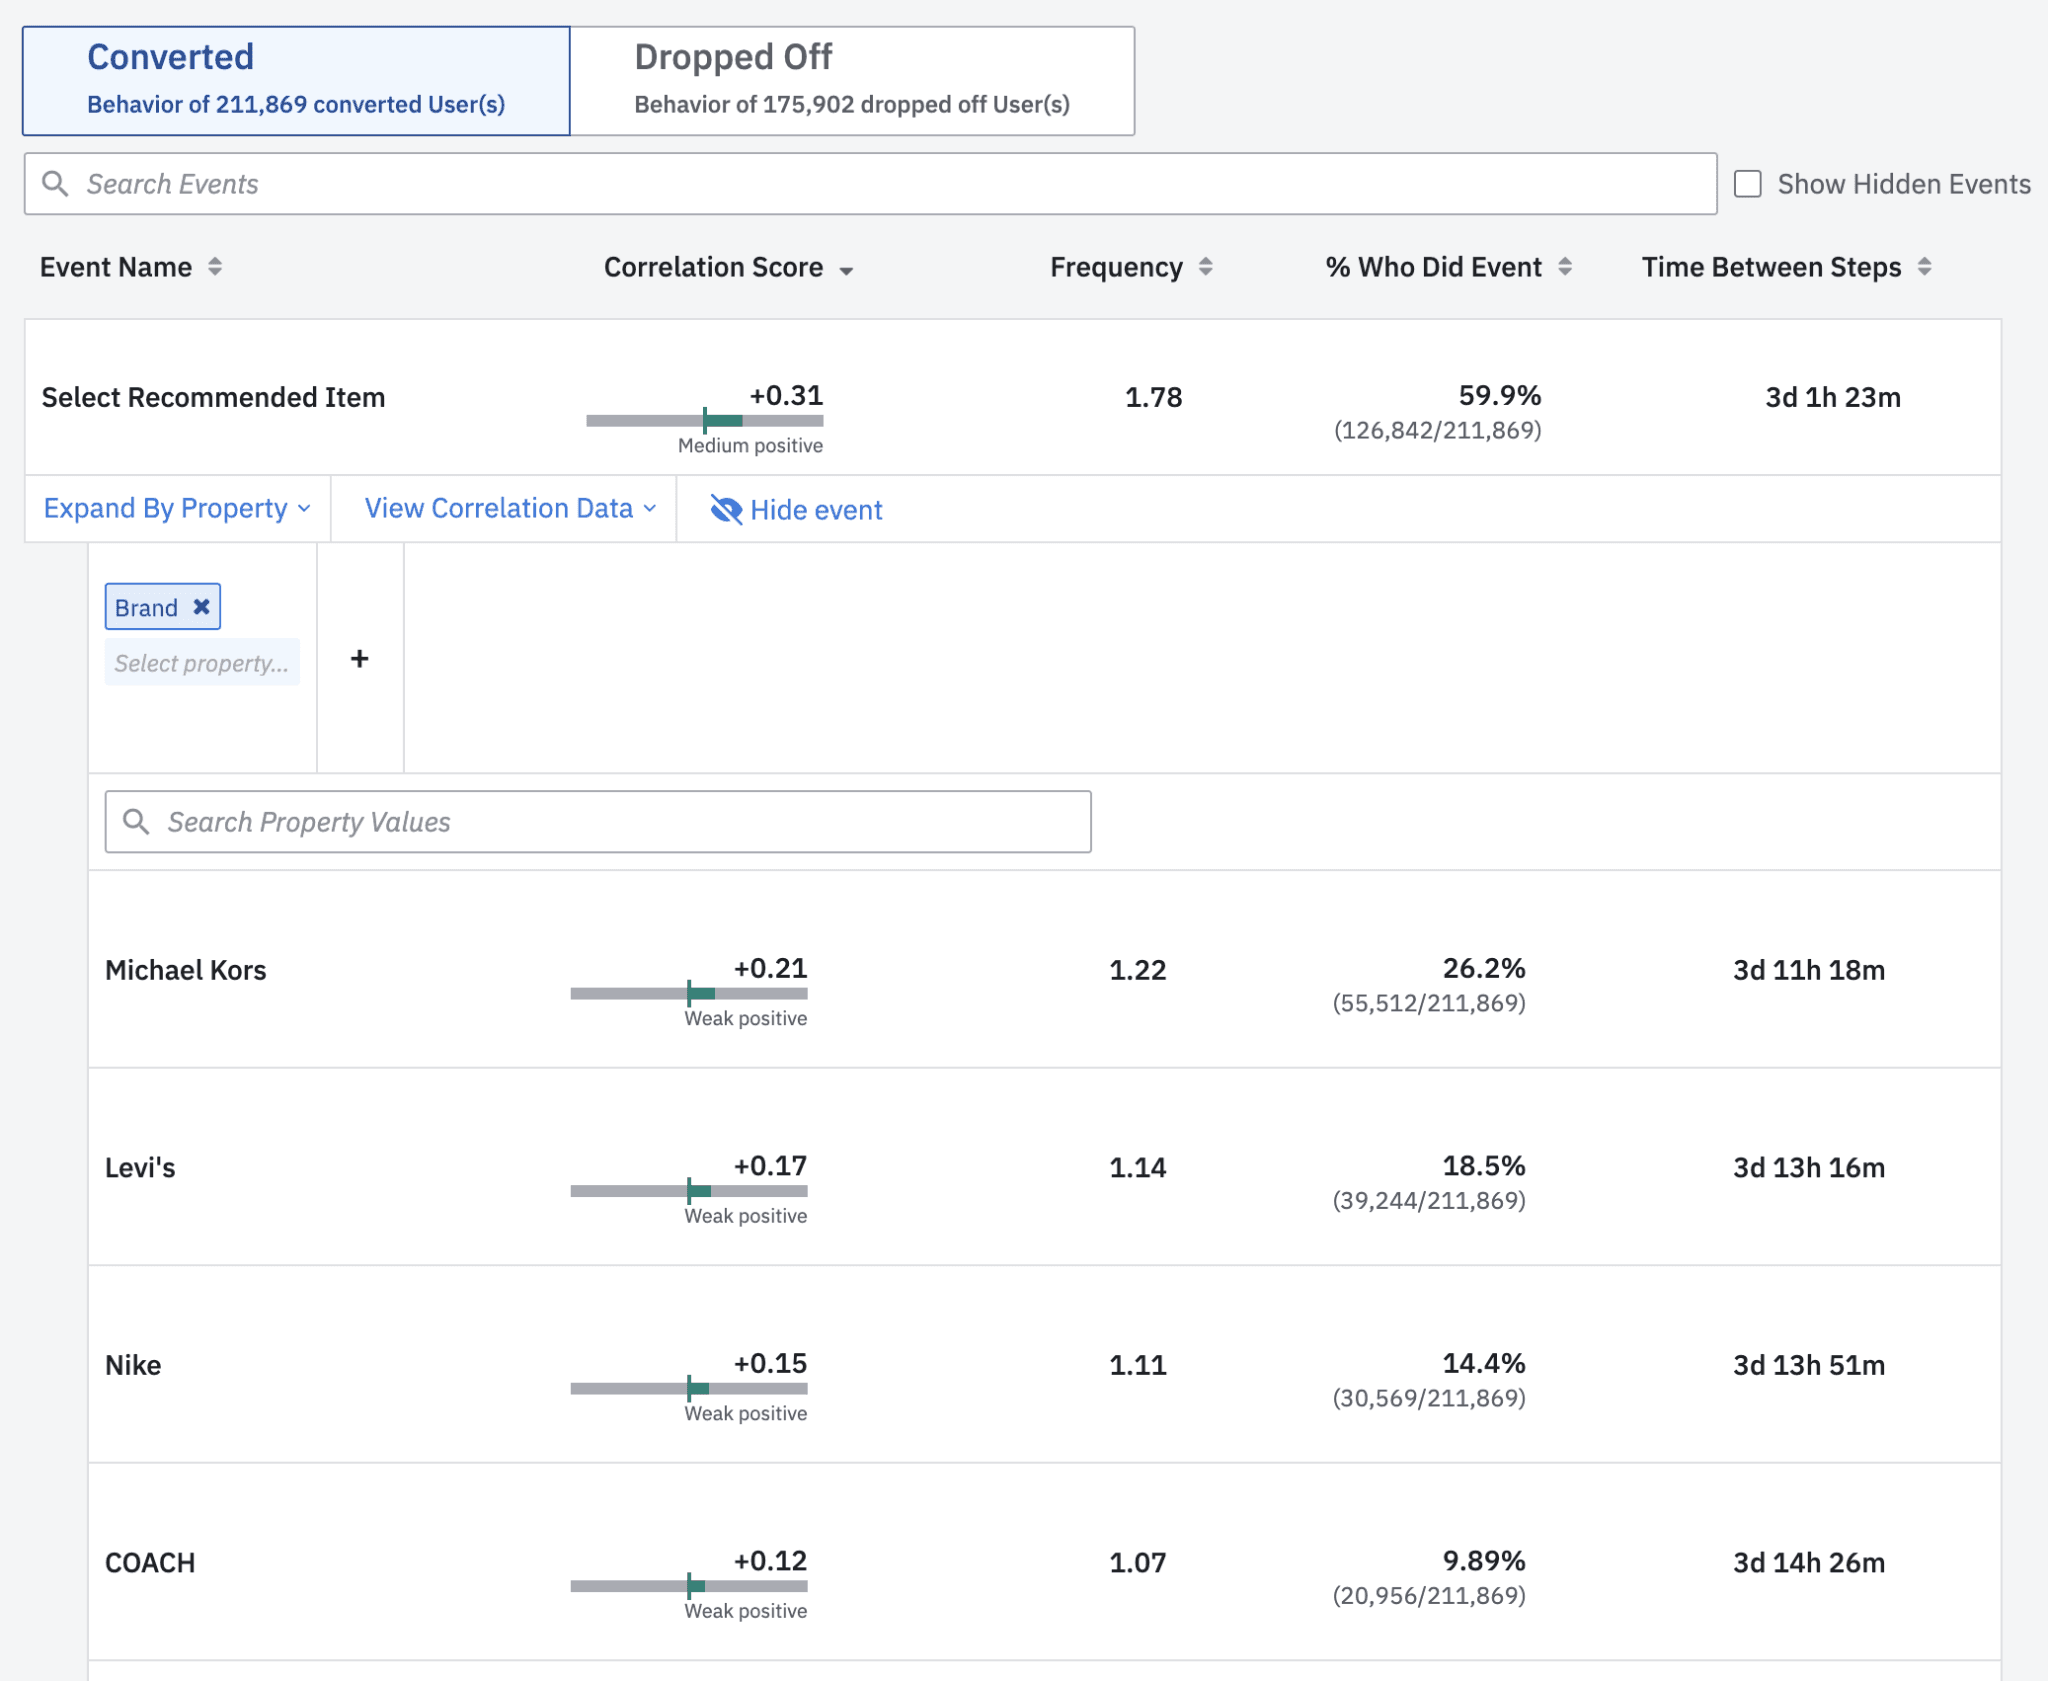
I now see which brands are most correlated with a successful conversion when they’re listed as the recommended item. It looks like our users really like Michael Kors, Levi’s, Nike and Coach because they’re the brands that drive the top conversion rates.
This is powerful information to have in our hands. We now know that these brands are the top drivers of conversion so we know that we can run more promotions and recommend them more often.
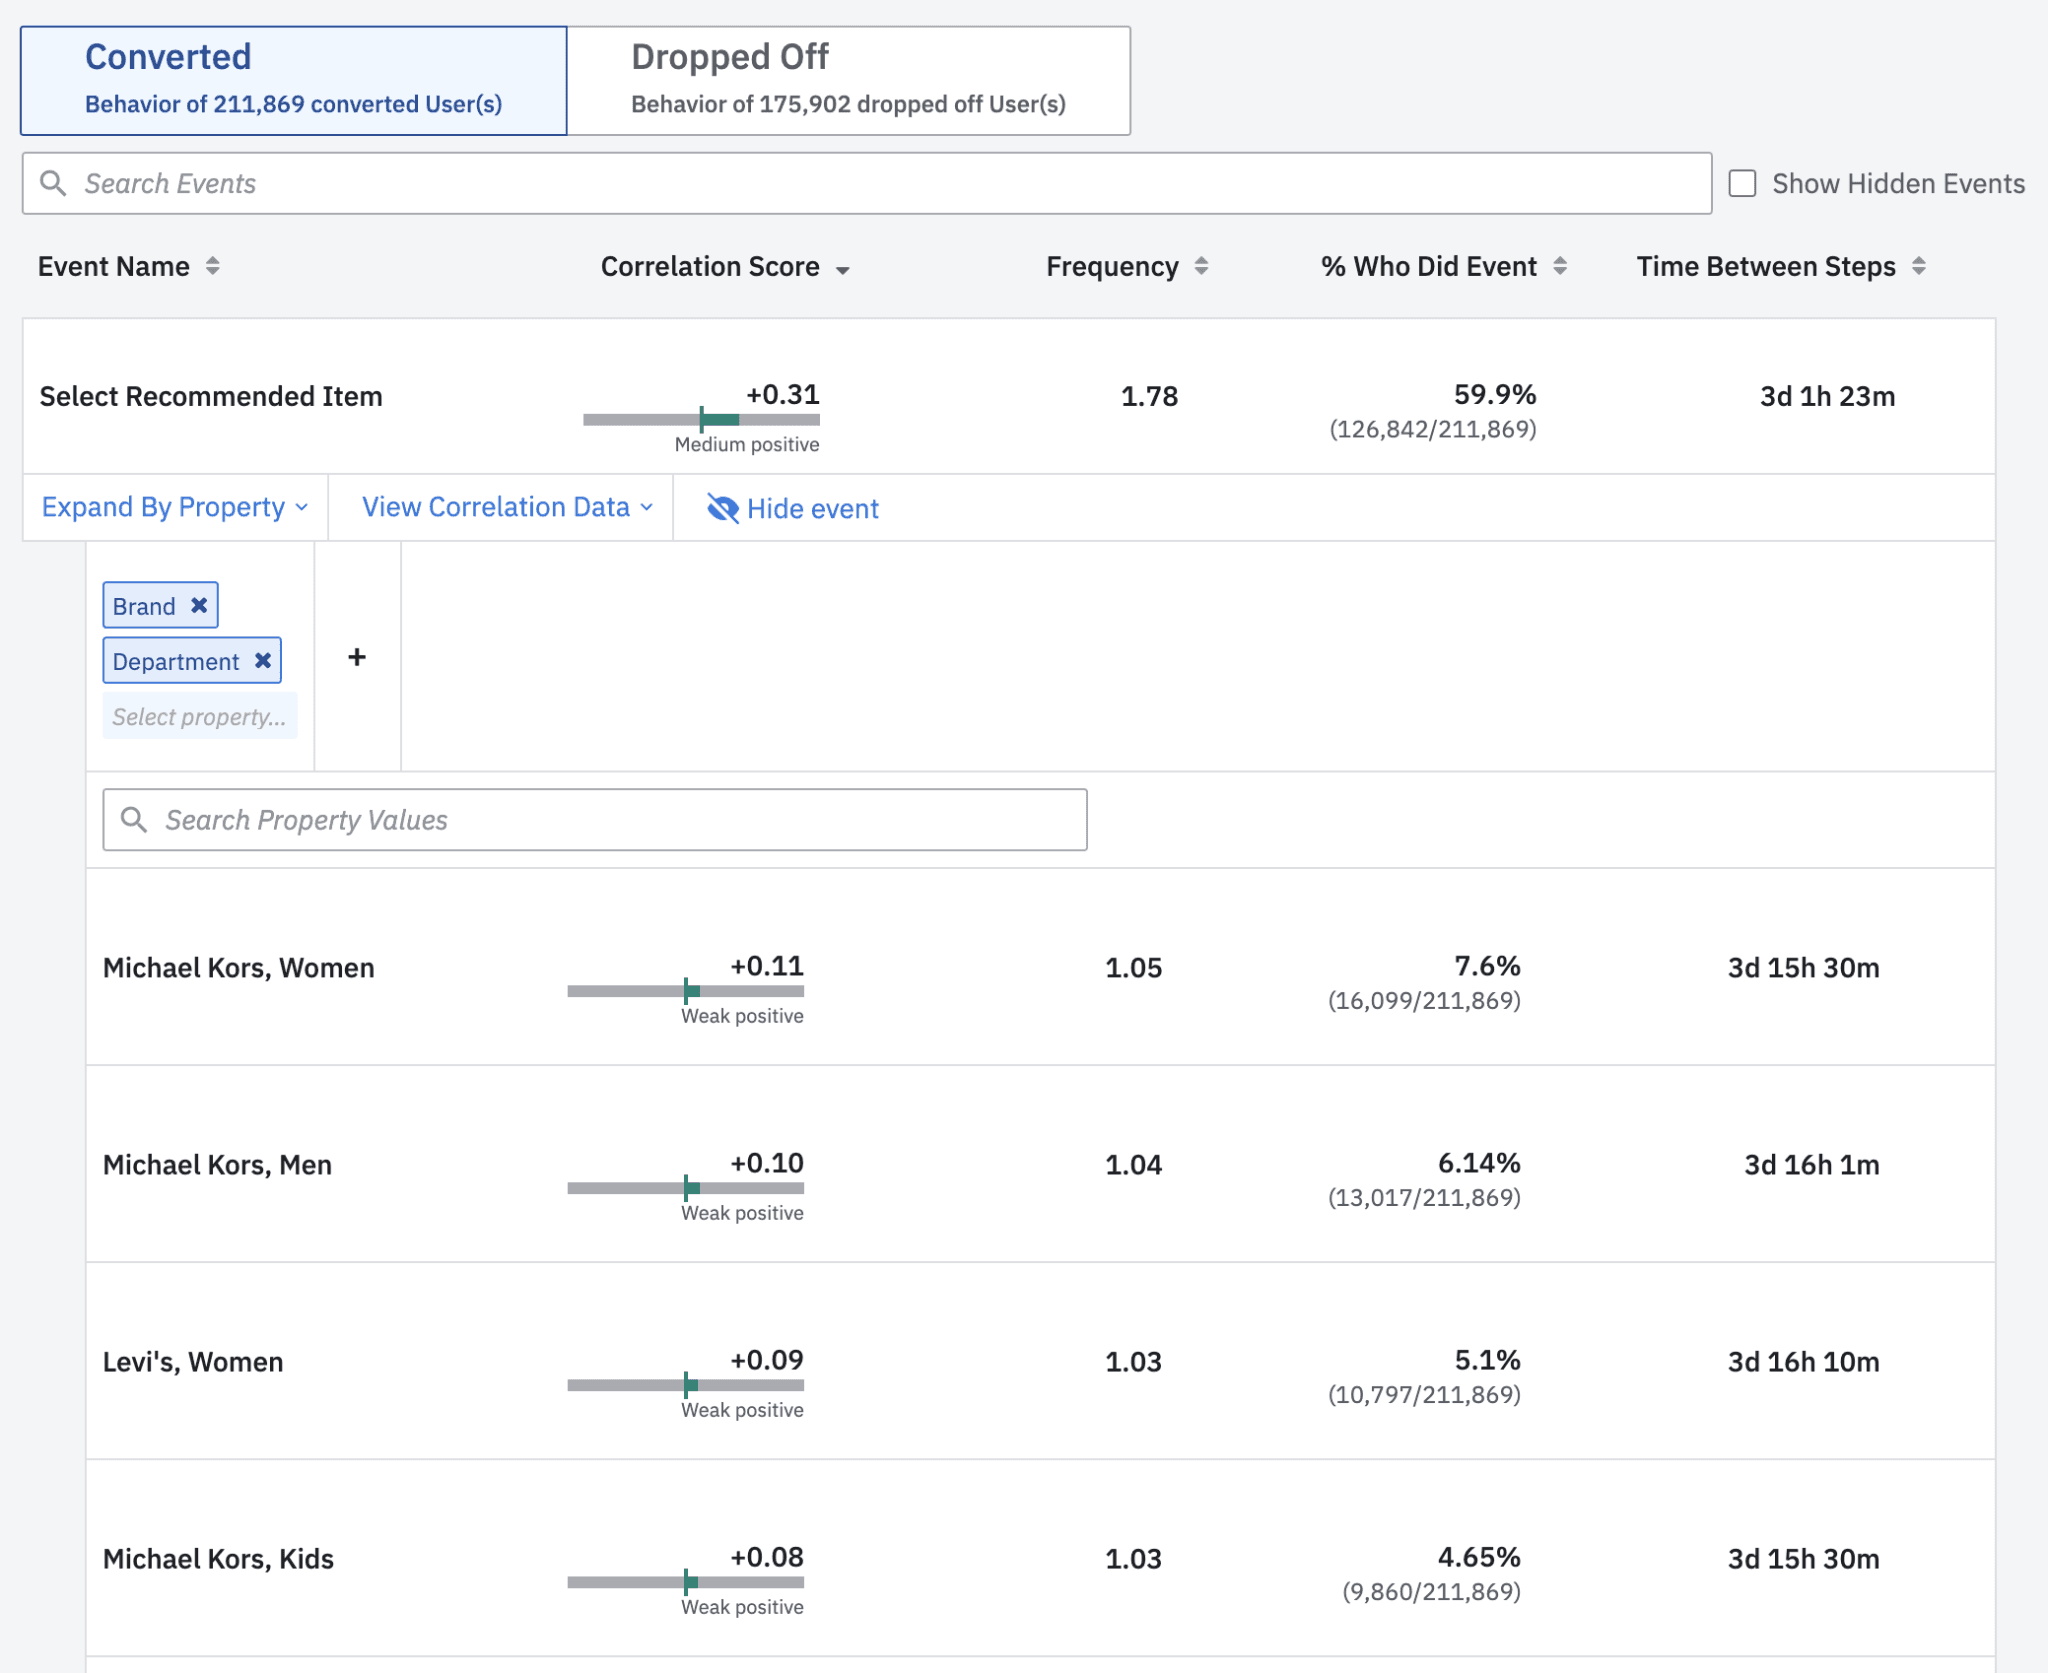
But we’ve still got two clicks left, so let’s see what else we can find out. I’ll click “Select Property” again, and this time I’ll add “Department” to the analysis. Now I see which brands are driving conversion for different categories: men, women and kids. Clearly our customers love Michael Kors.
Leverage Customer Insights to Drive Conversion
In just six clicks I have this amazing insight on what user behaviors drive towards conversion. To increase average cart values I’m going to ensure that these specific recommendations are surfaced more frequently to my customers. I could even think of a strategic marketing campaign for the users who didn’t convert and propose those recommended brands and departments to them.
But that’s for another video. To learn more strategies, visit amplitude.com/6clicks. You can also try this analysis yourself in the Amplitude demo.

Sam Edwards
Former Global Technology Partner Manager, Amplitude
Sam is a global technology partner manager at Amplitude and former solutions engineer and customer success manager. She specializes in helping businesses reach their revenue goals, scale for growth, and build the best product for their users.
More from Sam
