
There are moments when a user falls in love with a product. Perhaps it’s the first time they completed an order. Or the second time they received a mobile delivery. Or the third time they finished a workout with a fitness app.
Regardless of the action, these critical points are milestones that propel users on their journey to becoming a high-value customer.
Milestones are where customer behaviors shift. It’s where customers become more engaged, more likely to stick around, and more likely to advocate for the product. If you can identify these milestones, you can build product experiences so that more users reach them and become high-value customers.
Even though product teams have vast amounts of data available to them, sorting through millions of user events to identify critical milestones in the customer experience is difficult and time-intensive. So when teams have hunches about their milestones, they have to set aside valuable hours and resources to verify them.
Until now.
Building on Amplitude’s proprietary infrastructure, NOVA, we’ve created a technological breakthrough. NOVA makes it possible for teams to conduct relative time analyses. This means that the concept of a milestone analysis—in which product teams can identify critical milestones in the customer journey—has gone from being a weeks-long search to a three-click discovery.
Milestone analysis can be performed through the new Historical Count feature in Amplitude. With Historical Count, product teams can identify milestones in just a couple clicks. What was previously an assumption — that high-value customers performed similar actions a specific number of times during their journey — can now be validated. Once a team has identified their product’s milestones, they can create digital experiences that compel more users to follow that path.
You’ll wonder how you ever built products without it.
“Creating customer pathways is like playing chutes and ladders. If a user hits the right milestone, it’s a quick journey toward accelerated growth. Historical Count makes it easy to analyze behavior patterns and build the right experiences to direct users to key milestones. Historical Count has changed the game for our marketplace analysts, developers, and marketers.”– Alexander Soria, Senior Director of Data Science at Mindbody
Why We Created Historical Count
We created Historical Count because our customers were already trying to understand their user milestones but couldn’t. Ecommerce companies, for example, thrive when they have repeat users, and while they can more easily track the discount or promotion that attracted a first-time buyer, they’re usually not sure what drives second and third purchases. We’ve heard this struggle across industries and company size.
The challenge is that there has been no good solution to understand and drive milestones. Some of our customers tried running complex SQL queries and allocating precious engineering resources to instrument event counters. But these approaches were time consuming, and even if they could finagle an answer, the answers quickly became outdated. Every change in the product or in the customer journey meant the analyst team had to start all over again.
“Our data team spent tons of time implementing lifetime counters, tracking the right data, and analyzing it in custom SQL queries. It was a long and arduous process that could take weeks. Now Amplitude’s Historical Count removes the need for complex instrumentation and lengthy analysis.”– Siyun Li, Product Analyst at MAJORITY
Our clients were asking the right questions: How many articles does a reader need to consume before subscribing to a digital publication? How many projects does a SaaS admin need to create to be retained? How many products does an online shopper need to view before making a purchase? But answering them took months of work that returned results that were too rigid with no ability to explore and often too difficult to interpret to be useful.
The reason our clients were going through all this work was that they understood the power of customer milestones. And so do we. We built a powerful solution with Historical Count to help teams flexibly explore their milestones and align around driving users through them to expedite their journey to becoming high-value customers.
What You Can Do With Historical Count
At Amplitude, we believe in empowering teams to answer these kinds of questions with data, and to explore their data to find new questions they hadn’t thought of. Amplitude is uniquely positioned to help teams do milestone analysis because of our technical breakthrough in our proprietary infrastructure that uses relative time analysis to power Historical Count.
With Historical Count, you can easily view the first, second, or fifth times a user completes an event, understand how achieving this milestone changes their behavior, and see how this impacts outcomes like retention and conversion. For instance, you can validate that exposing a user to a certain campaign for the first time or getting them to engage with a feature for the third time actually drives them to convert or retain.
Historical Count can help you answer the burning questions you already have:
- What drives users to subscribe-watching their first or fifth video?
- Does creating a second or fourth project drive an account to renew?
- How many products does an online shopper need to view before making a first purchase?
Then, you can explore and ask deeper questions, such as:
- What are the critical milestones I haven’t thought of?
- What are the leading indicators of my milestones?
- What kinds of users achieve milestones, and why?
With the answers to these questions, your teams can collaborate to drive users to reach important milestones and move toward becoming high-value customers.
How Historical Count Works
Historical Count works by looking back at a year’s worth of historical data and differentiating whether events were performed for the first, second, or Nth time. Historical Count is more accurate than just differentiating between new and returning users. Instead of categorizing a user’s events as “new” because they were new to your product that week or month, we’re now able to measure how many times a user has done this specific action—ever.
Current product analytics tools store and analyze events in a single timeline, without context for when the user started their journey and no appreciation for whether the user is firing this event for the first or 50th time. Analytics solutions today can show you users who were new in April and watched five videos. They can’t tell when users watched their fifth video and whether the fifth watch affects their likelihood to subscribe. If you were to ask a question like, “How many purchases happened last week?” there’s no distinction between first-, second-, or third-time purchases.
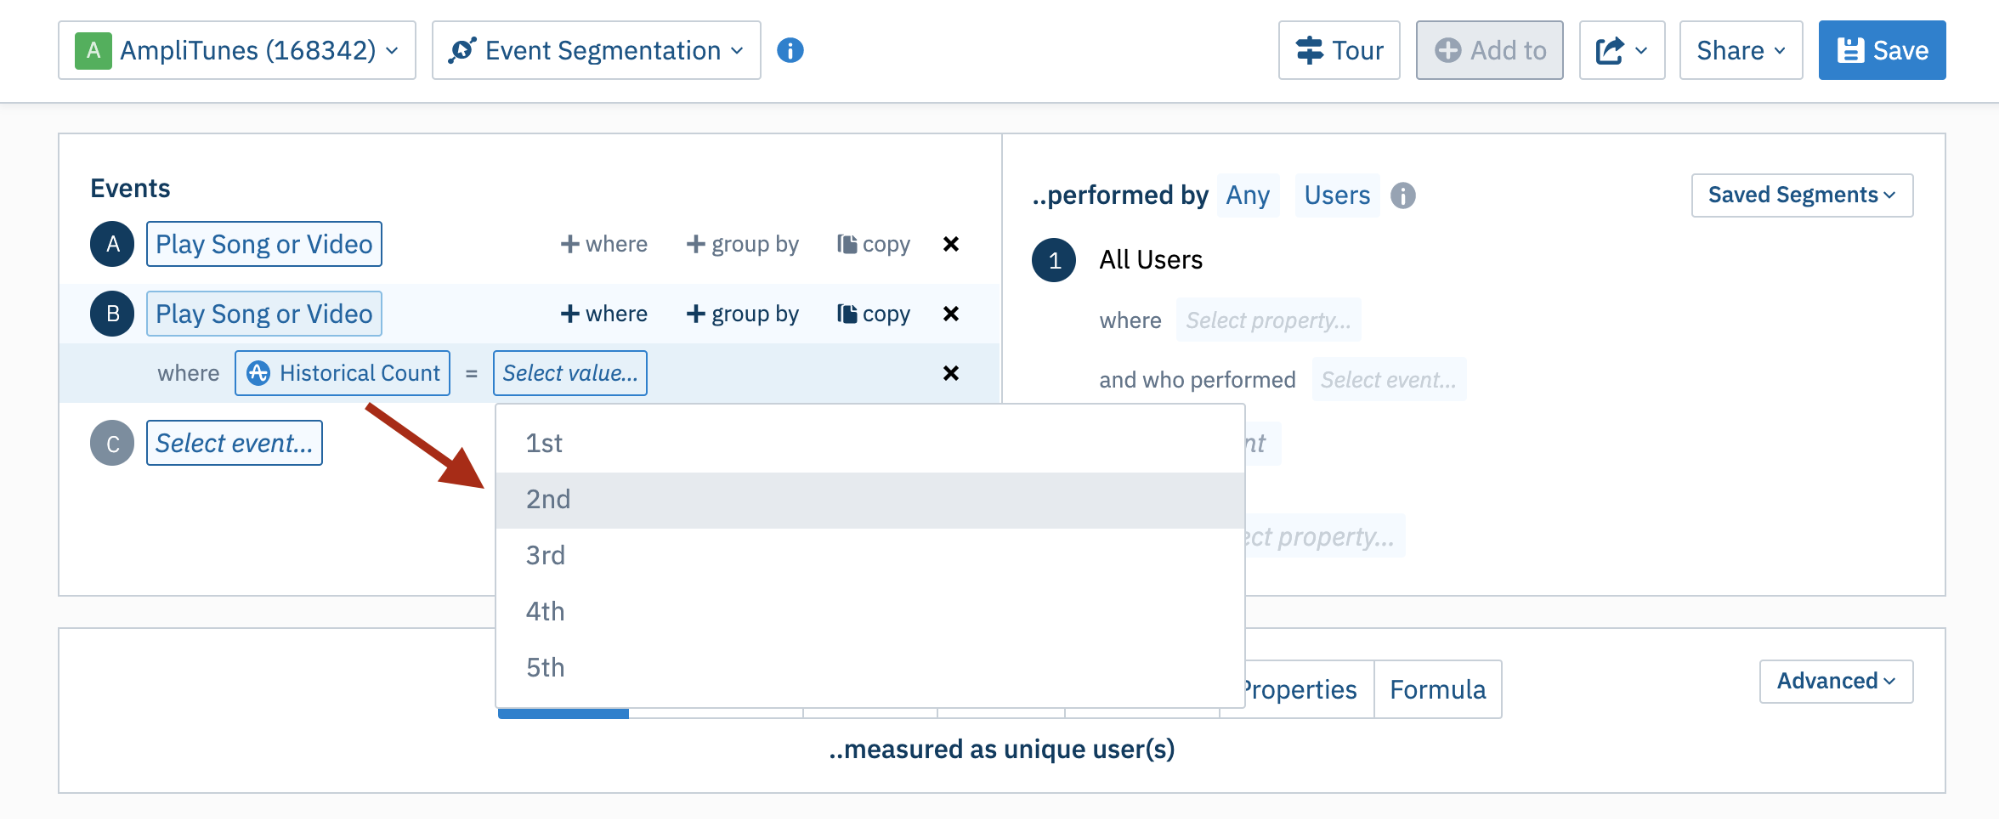
Now, with Historical Count, you can filter events for “Nth time” performed, just as you would filter for any other event property.
Here’s an example from our demo music streaming app, Amplitunes. The following query will count how many users performed “Play Song or Video” in the last 30 days, and how many of them performed “Play Song or Video” for the second time ever.
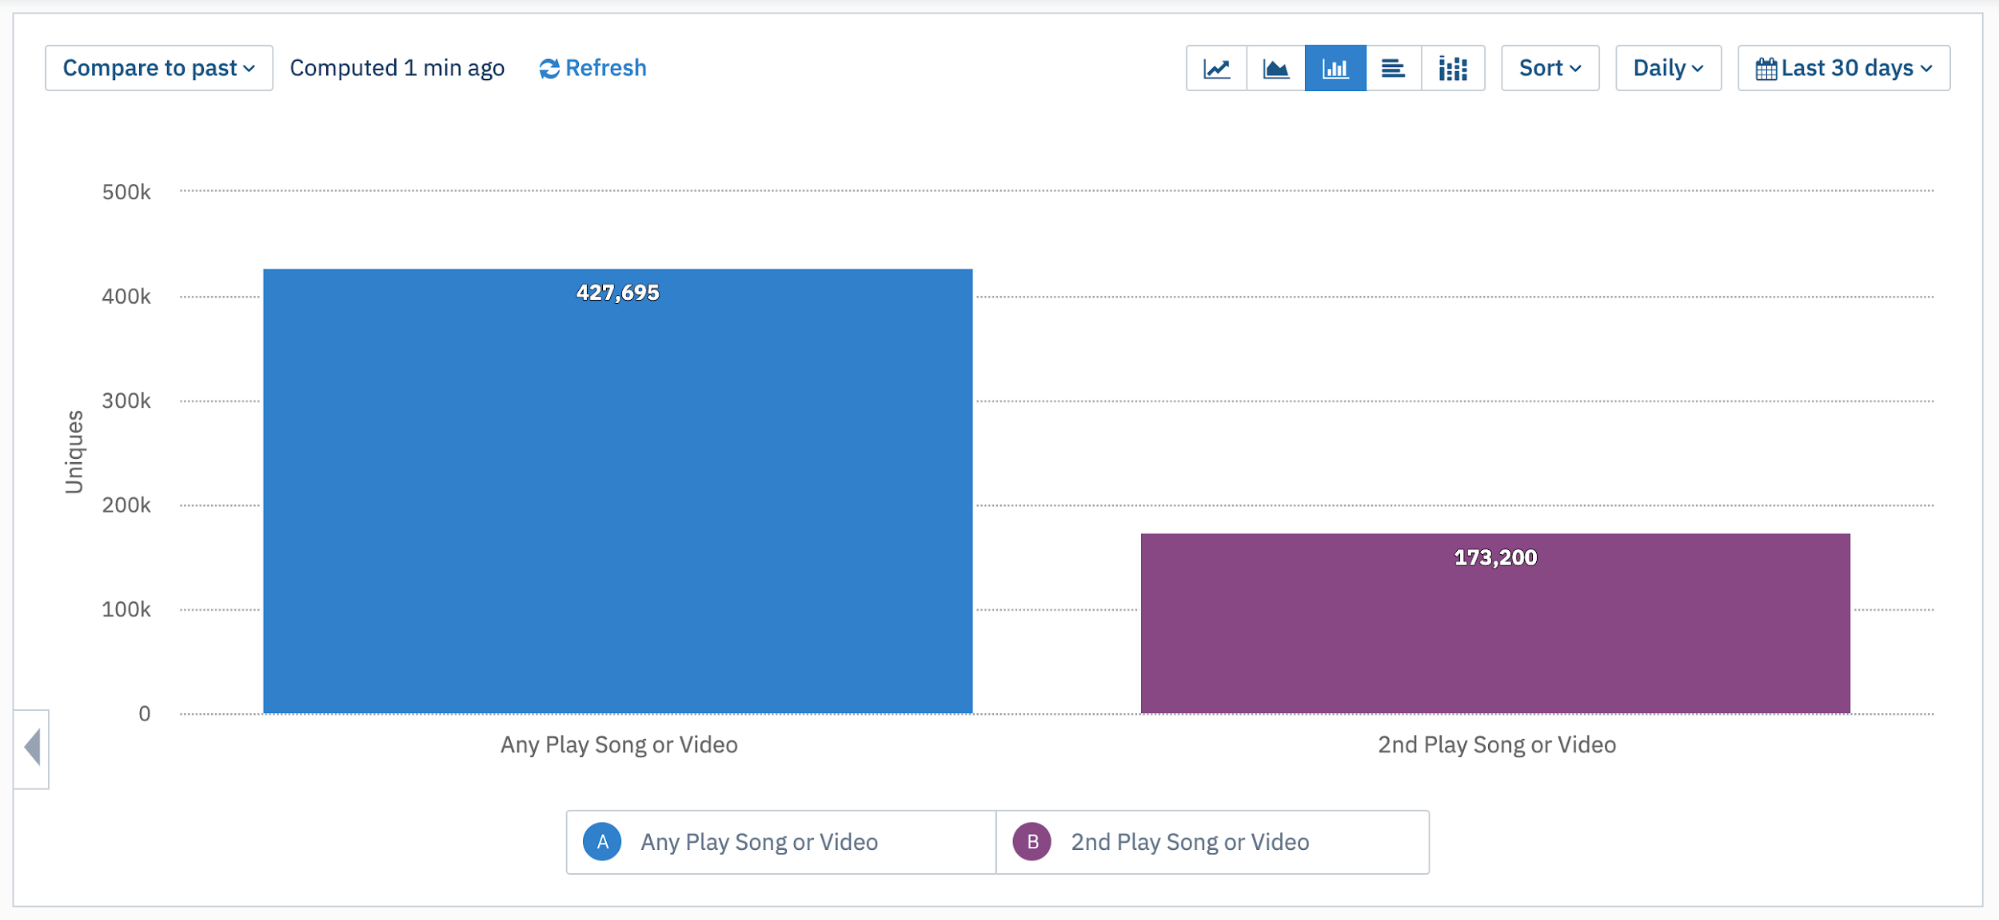
Now here’s the result: 427,695 users played songs or videos in the last 30 days, but only 173,200 users played songs or videos for the second time.
Get Started
Historical Count is live now. It’s fully integrated into the Amplitude dashboard and retroactively applied to existing data. It can be found on these four chart types: Event Segmentation, Funnels, Retention, and Pathfinder.
- Historical Count documentation
- Milestone Analysis Press Release
- Learn more about product intelligence + milestone analysis
Watch as Justin and Alexander Soria, Senior Director of Data Science at MINDBODY, discuss milestone analysis and how product teams can use it:
We are the only product intelligence platform that lets you count events and track milestones in this way. If you’re new to Amplitude, request a demo today.