Introducing the Amplitude Instrumentation Explorer
Analytics instrumentation is an important, yet highly frustrating chore for most engineers. That's why we made the Amplitude Instrumentation Explorer, an analytics instrumentation tool built by engineers, for engineers.
If you’re an engineer who enjoys instrumenting analytics, you’re one of the few. But if you’re like the rest of us, even those of us who work at a product-analytics company, analytics instrumentation is mainly a dreaded experience.
The most frustrating part of the job is QAing to make sure the correct events and properties send the way you want them to. Sure, you can run various tests to confirm that events are working properly, but that is a tedious process, and the solutions out there—the User Activity tab in Amplitude, the network tab in Chrome, or even a few Chrome Extensions created by third parties—lack a user experience worth writing home about.
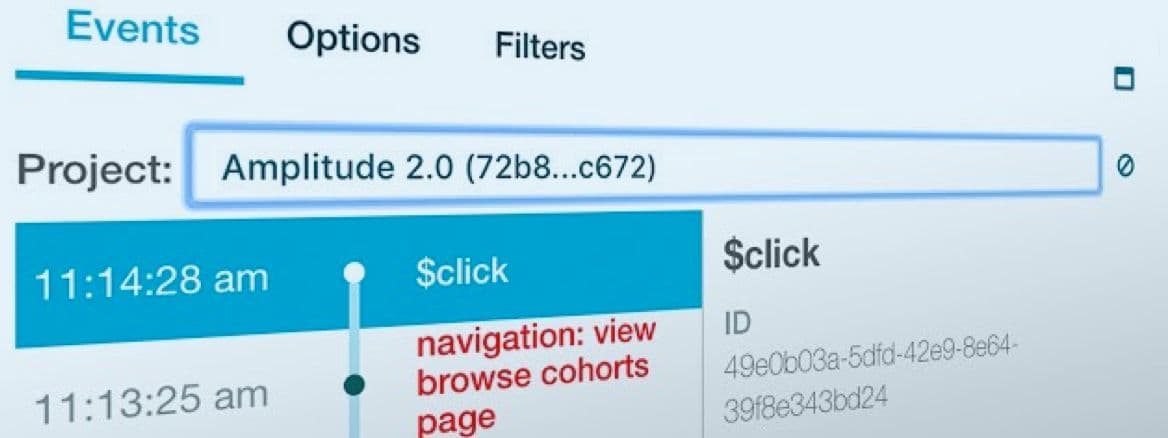
At Amplitude, we weren’t satisfied with the analytics-instrumentation tools available, so we made our own. We are proud to introduce Amplitude Instrumentation Explorer, built by engineers, for engineers. You can use our explorer, a Chrome Extension, to inspect events as they are being sent from your browser to the server. Learn more about the Amplitude Instrumentation Explorer here.

Dana Levine
Former Product Manager, Amplitude
Dana is a former Product Manager at Amplitude. He enjoys building products that make peoples’ lives easier, and using data to answer interesting questions. He has started two companies, worked at a wide variety of startups and larger corporations, and studied Neuroscience and Bioengineering at MIT.
More from Dana


