Increasing Downloads and Deliveries at Jersey Mike’s in a Year of Lockdowns
Learn how Jersey Mike's digital marketing team used Amplitude to feed the growth pipeline and more than double online orders.
Due to the COVID-19 pandemic, e-commerce in the United States experienced 10 years’ worth of growth in just three months, according to McKinsey and Company. Retailers have shifted focus to keep pace with this new reality. For those of us in the food and beverage industry, it’s been sink-or-swim.
Thanks to our digital transformation initiative, Jersey Mike’s Subs was well prepared for this increased demand. Prior to the pandemic, we launched our new online ordering system, complete with the adoption of a strong data intelligence platform. With these tools, we learned more about our customers and boosted engagement with our mobile app.
Hungry for Growth: Embracing Digital Disruption
I joined Jersey Mike’s national sub sandwich franchise in 2017 as the director of digital marketing. My mandate was to expand our digital footprint through avenues such as paid search, social media, and email marketing. As we expanded our digital marketing efforts, it was the perfect time to make better use of analytics.
At the time, Jersey Mike’s had very little analytics, and without that, we couldn’t scale. Although we were ahead of many companies in the restaurant industry, when it came to technology, we wanted to do much better. We had an online ordering platform, but the app was outdated. We wanted to improve the user experience (UX) by enhancing and adding features while building a more intuitive interface. Our customers had modern expectations and wanted a better digital experience. As we grew, we also wanted to make sure our app could handle increases in traffic.
It’s not enough to redevelop an app; you have to determine how best to capture and interpret customer data from that app. Click To Tweet
To create an experience that would engage our customers online and drive sales, we needed to not only redevelop the app itself, but determine how to capture and interpret customer data. We knew overhauling the app would make a huge difference to how we do business, and it became part of a larger digital transformation where we revamped our entire tech stack.
Connecting Analytics with Our Digital Marketing Campaigns
We worked with technology services provider World Wide Technology (WWT) to revitalize our online presence and identify the best ways to prepare ourselves for the future. With their help, we landed on two platforms that complement each other brilliantly: Segment and Amplitude.
From the start, I found Amplitude to be very user friendly. Even without any knowledge of data or analytics, it’s easy to build analytics tracking charts within Amplitude, which was a big selling feature. The dashboards and visualizations also make it simple to understand the available data, and interpret it to get a more holistic view of our customers.
Segment is our customer data platform (CDP) that collects data from various sources, such as our email service provider, app, point of sale (POS) system, and more. It gives us a streamlined view of the customer journey so our team can make the appropriate decisions across all of our marketing channels. Shortly after adopting Amplitude and Segment, we began to use Iterable, a cross-channel marketing platform that personalizes customer communications, such as email, push notifications, and text messaging.
These platform integrations make for a seamless flow of data. Segment almost acts like a data warehouse—all data gets collected there and gets pushed to Amplitude and Iterable. We can also receive data from Iterable and push that into Amplitude as well.
We realized the beauty of Amplitude and Iterable when we began working with behavioral cohorts. Cohorts are customers that are grouped based on a shared trait or set of shared traits within Amplitude. We can then use those cohorts for activities within Iterable. We also use predictive cohorts, which help optimize targeting workflows to generate maximal lift. Within a particular cohort, Amplitude can identify the top 20% with a high likelihood of converting or completing a desired event. We then use Iterable to send that group different messaging and incentives compared to the rest of the cohort, which receives altogether different messaging and incentives than the rest of our users. This use of cohorts allows us to keep conversion rates high, and speak to our most loyal customers in a personalized way.
We also created dynamic cohorts, which allows us to look at results in real time instead of waiting for colleagues to pull a report, send it to the appropriate parties, and then spend time analyzing it. With dynamic cohorts, we can update our marketing in real time if necessary, and adapt as needed with a live campaign.
Finding Collaboration and Support Alongside Amplitude
Amplitude helped us finesse our plan from the beginning of our partnership. Together, we went through all our tracked events. They made recommendations about which performance metrics we should monitor based on our goals, our messaging, and what we wanted to learn. They helped us create different charts based on this data so that it would be most valuable for our marketing team.
Tracking both app performance metrics and #UX improvements holistically boosts a customer’s digital experience. @Amplitude_HQ Click To Tweet
With the data from Amplitude, anyone on the marketing team can see the data on their own, without having to ask the IT team for access. There’s no lag time in analyzing our results or sharing them with the right people, so we can make great decisions faster.
Jersey Mike’s developers use Amplitude as well. With the Pathfinder feature, developers can see how customers interact with the app, and it highlights areas where they can improve the UI/UX and plan new app features. They work closely with our marketing team when designing new features based on the data we want to capture. We make sure to include analytics on redesigned features like call-to-action (CTA) buttons to track impact and improve the overall app UX.

Because Amplitude’s charts are simple to use and understand, it’s easy to share reports with top-level management so they understand the results of a particular marketing campaign. Amplitude makes it easier to collaborate with all teams within Jersey Mike’s.
Increasing Online AOV During Lockdowns
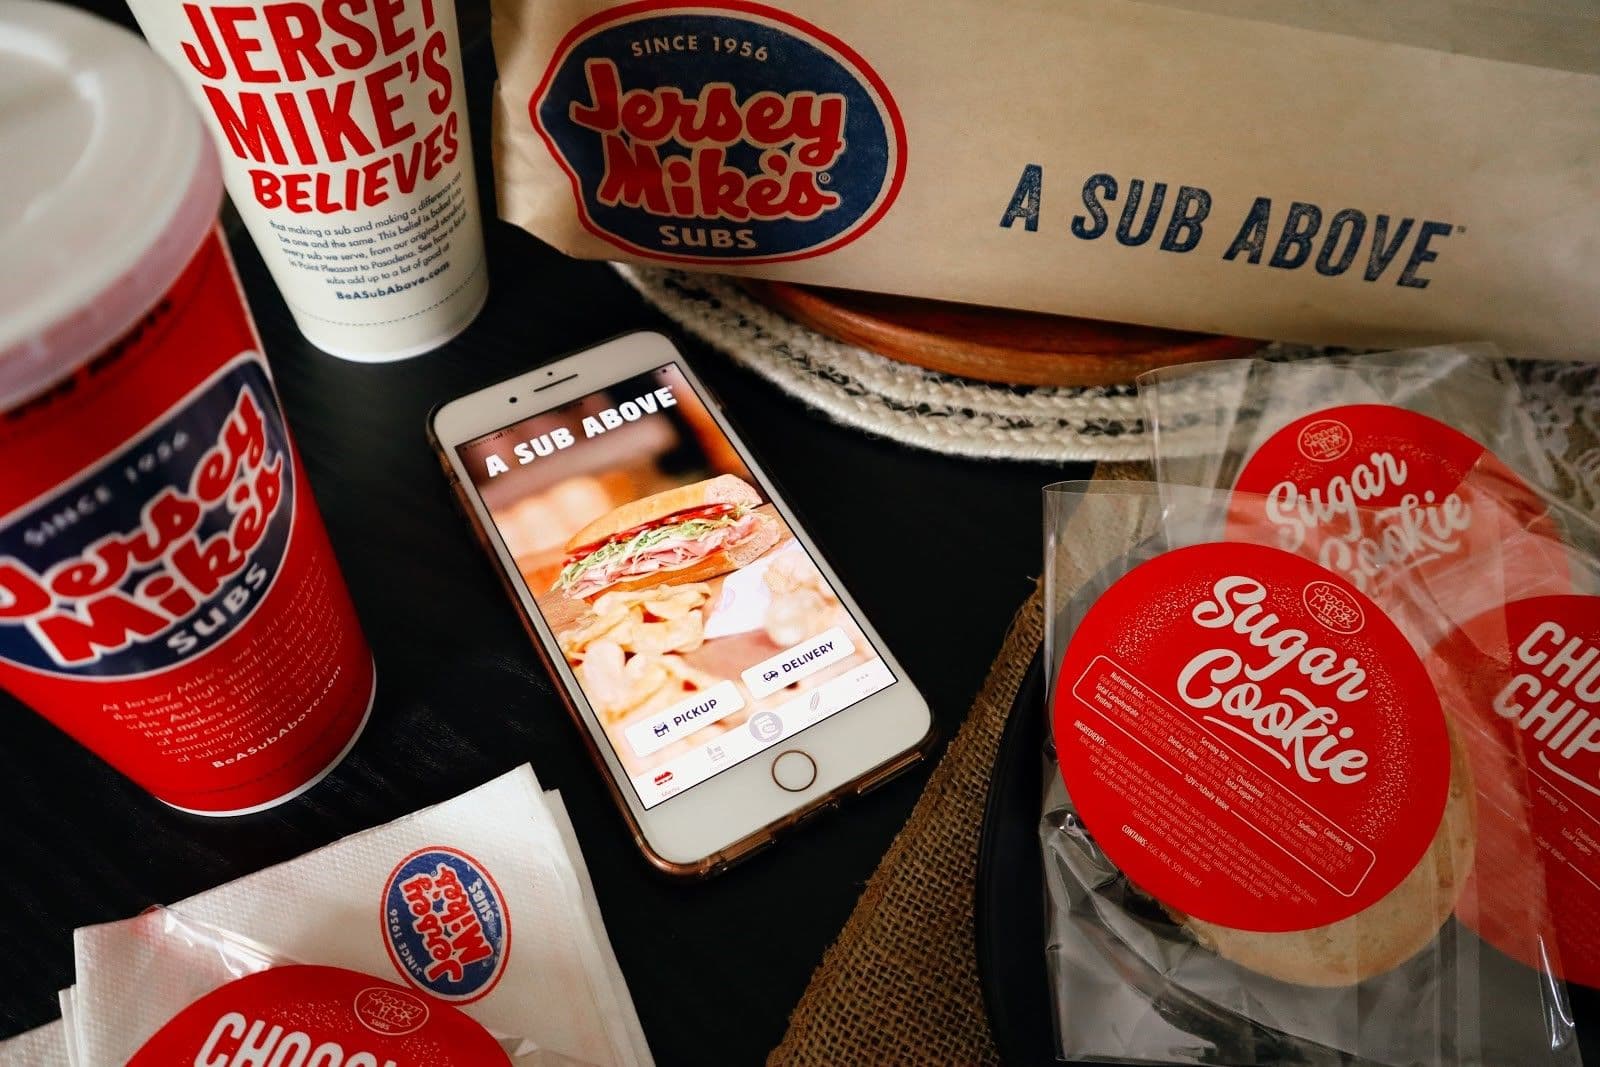
We launched the new version of our online ordering app at the end of 2019. By January 2020, we introduced the delivery feature within the app, which helped us not only survive but thrive during store closures and lockdown periods. No-contact delivery was a big driver for us, and in early 2021 we launched curbside pickup for the majority of our locations nationwide. We moved to a full campaign to promote both our app and delivery via our app, and as a result, we’ve seen a big increase in app downloads.
Increasing online AOV is a matter of tracking what works, what doesn’t, and making the necessary changes. Click To Tweet
The numbers tell the story best: Over the past year, online ordering more than doubled. And the growth of digital orders has outpaced the growth of in-store orders. We’ve also gotten great insights into the customers within our loyalty program, MyMike’s™. Our loyalty customers comprise a big percentage of our everyday sales, so we’ve planned different marketing campaigns to promote our loyalty program and convert more users into loyal, long-term customers.
Using Amplitude to measure the impact of various campaigns, we can see how many people placed an order and compare it to how many people placed an order with a specific promo code. We can see the number of new app downloads and the number of users who joined MyMike’s using that promo code. As a result of these new insights, we’ve increased the number of campaigns targeting loyalty program signups.
Feeding Our Growth Pipeline and Loyal Customers
Next, we want to integrate our POS and website data into Amplitude. Once we do that, we can dig deeper into things like whether users are new to Jersey Mike’s, new to the app, and if they’ve come to a physical location before. We hope to get a better idea of our customer’s lifetime value (LTV), which is a huge step for our future marketing plans.
In examining all of our data, we’ve learned to use precise language with our event taxonomy and naming conventions. We need to be strict about naming events to ensure there’s no duplication. It helps us keep the data clean so everyone knows exactly what we’re seeing and analyzing.
The data and tracking insights we’ve uncovered through Amplitude have helped us improve our customer app experience. Now, we can deliver a digital service we’re proud to promote and that our customers enjoy using. That not only feeds our growth pipeline, but ensures higher customer satisfaction. They say the way to a person’s heart is through their stomach, but in this digital age, it’s also through their phone.
Continue your learning. Get the QSR Leaders’ Guide to Building The Right Technology Stack.

Kelly McGee
Director Digital Marketing, Jersey Mike's Subs
Kelly McGee is the director of digital marketing at Jersey Mike's Subs, where she leads a team that helped revitalize the chain's digital presence. As an early technology adopter, Jersey Mike's emerged from 2020 as one of the digital disruptors of the quick service restaurant industry.
More from Kelly


