Release Notes: June 2017
Here's what's new in Amplitude as of June 2017.
This month we’re very excited to announce “Collaboration” which allows Amplitude users to favorite charts and even leave comments. In this product update, you will find updates on:
- Launching: Collaboration
- Comments
- Mentions
- ️ Charts
- Feature Improvements
- Dashboards: Add Cohorts, Pathfinder, and Compass reports
- Browse Charts: Bookmarks
- Data Table: Sort By Table Summary Column
- All Charts: Custom Legends
- Microscope: for Holding Constant Funnels
- Multiple Metrics in Custom Formula
- Zoom into Charts
Launching: Collaboration
(Enterprise Only)
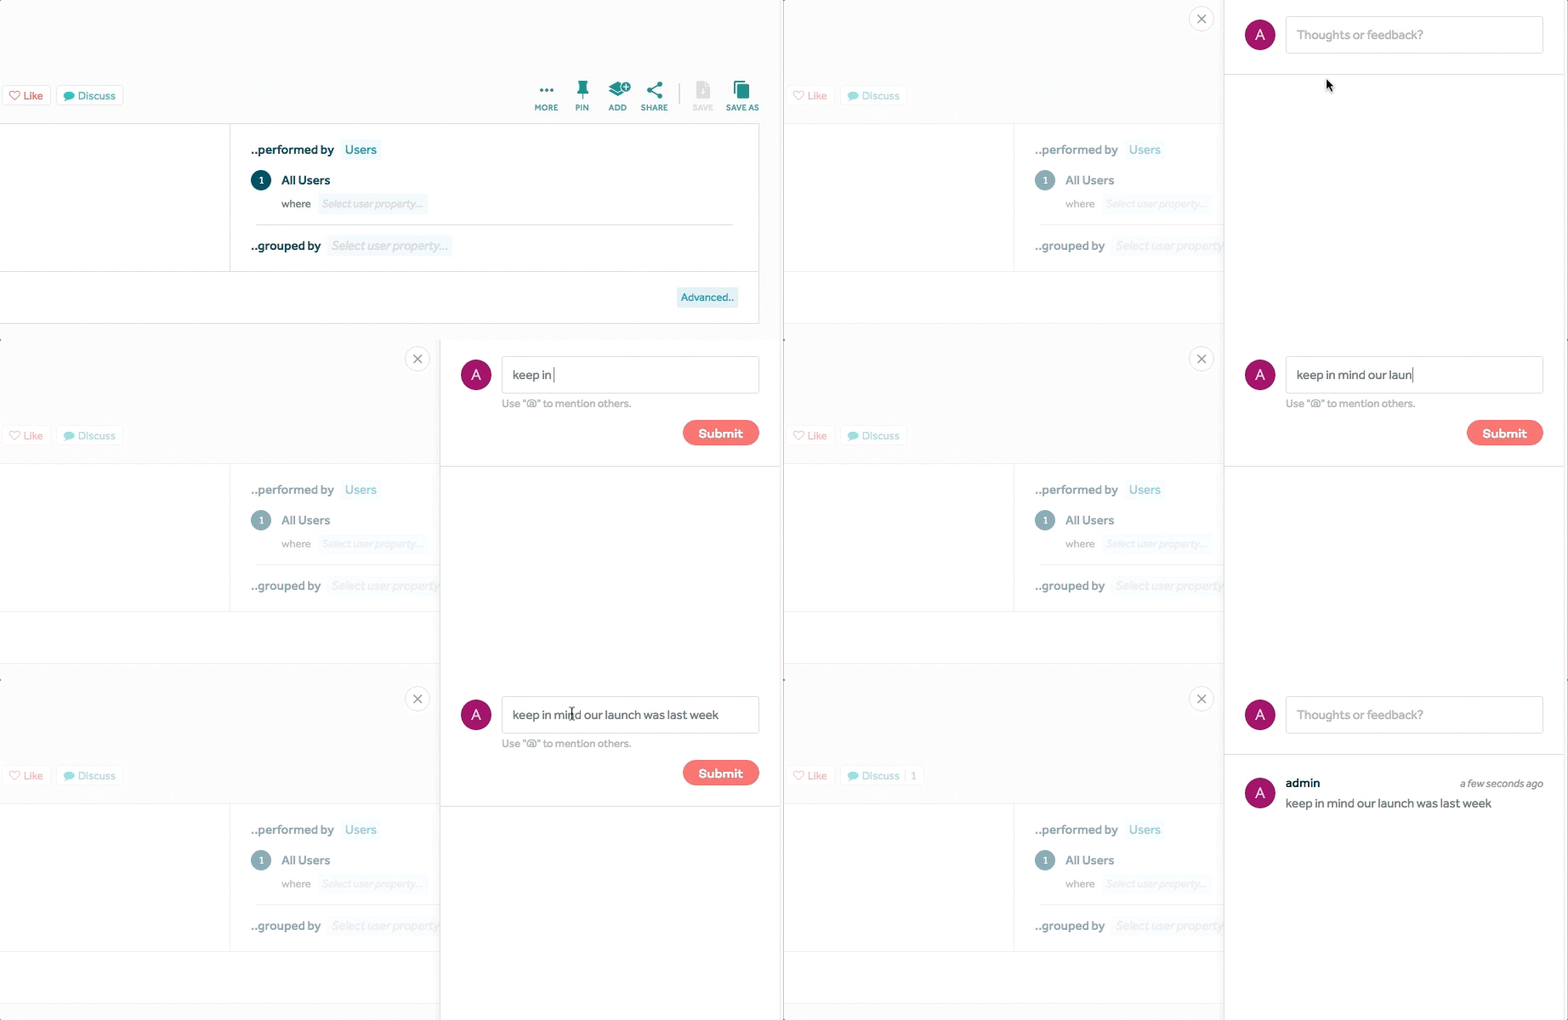
Comments on Charts and Dashboards
We know that many of our customers work in teams and need a place to deliberate on their findings. Your are now able to start a discussion around your metrics right alongside the chart or dashboard.
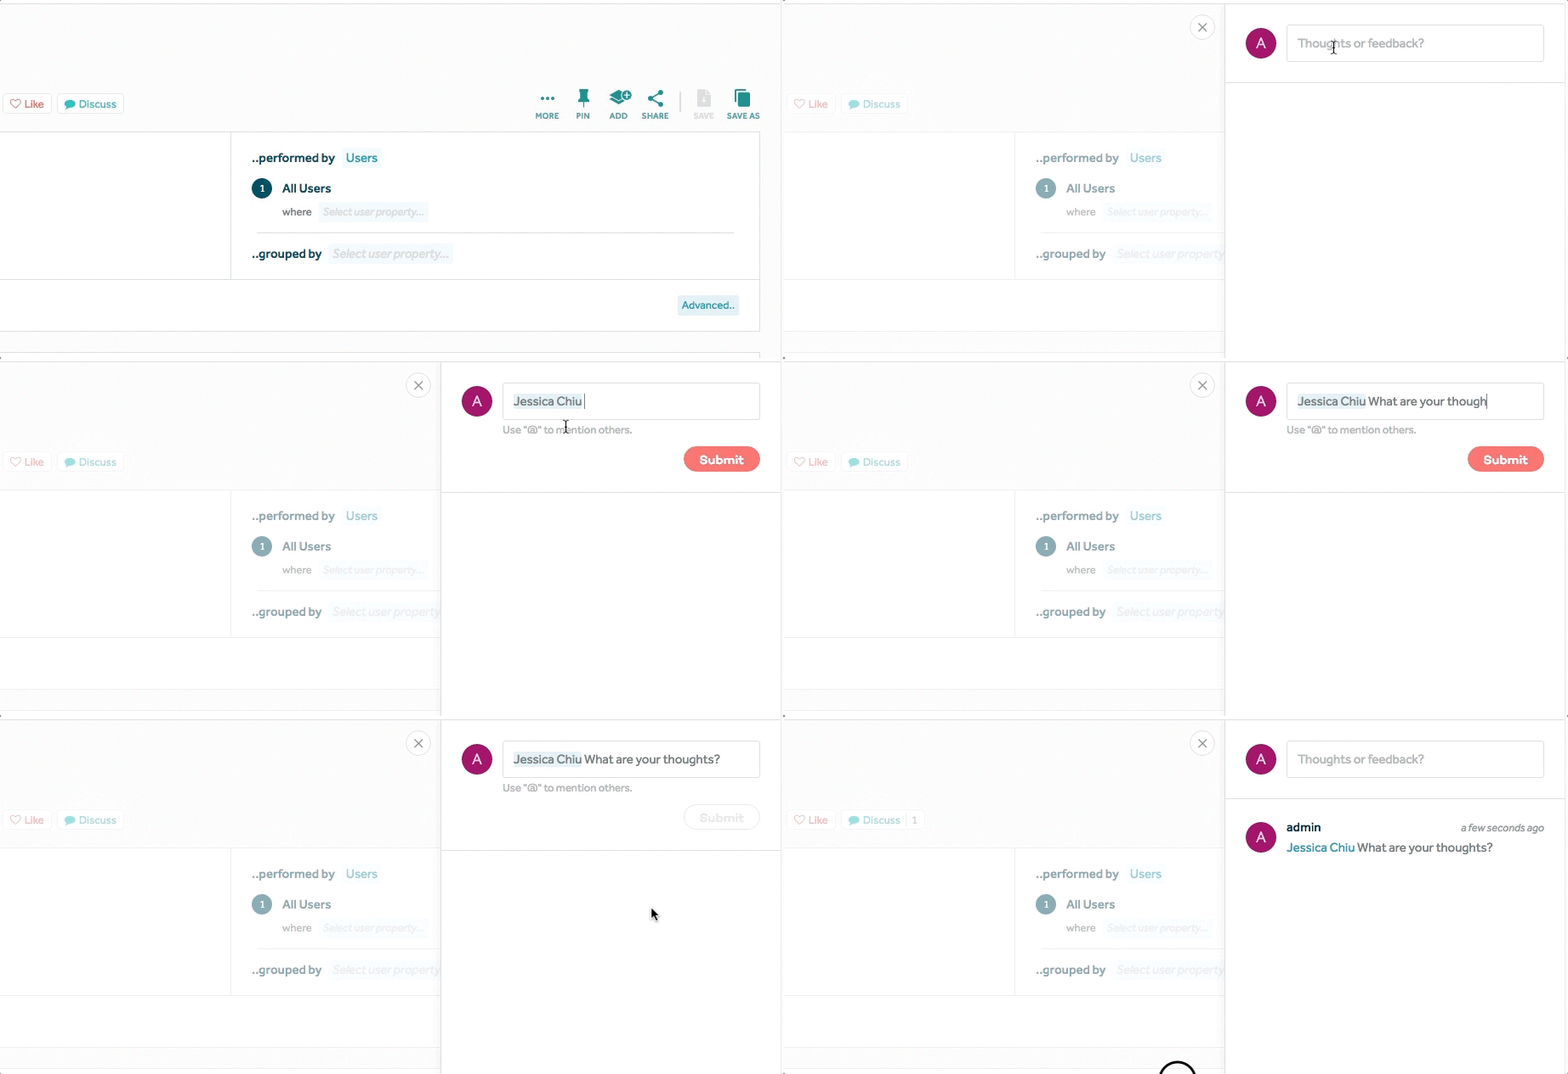
@Mention Colleagues
To notify a colleague in a chart or dashboard, type “@” followed by their name to send them an Amplitude notification. Notifications will appear in the top navigation.
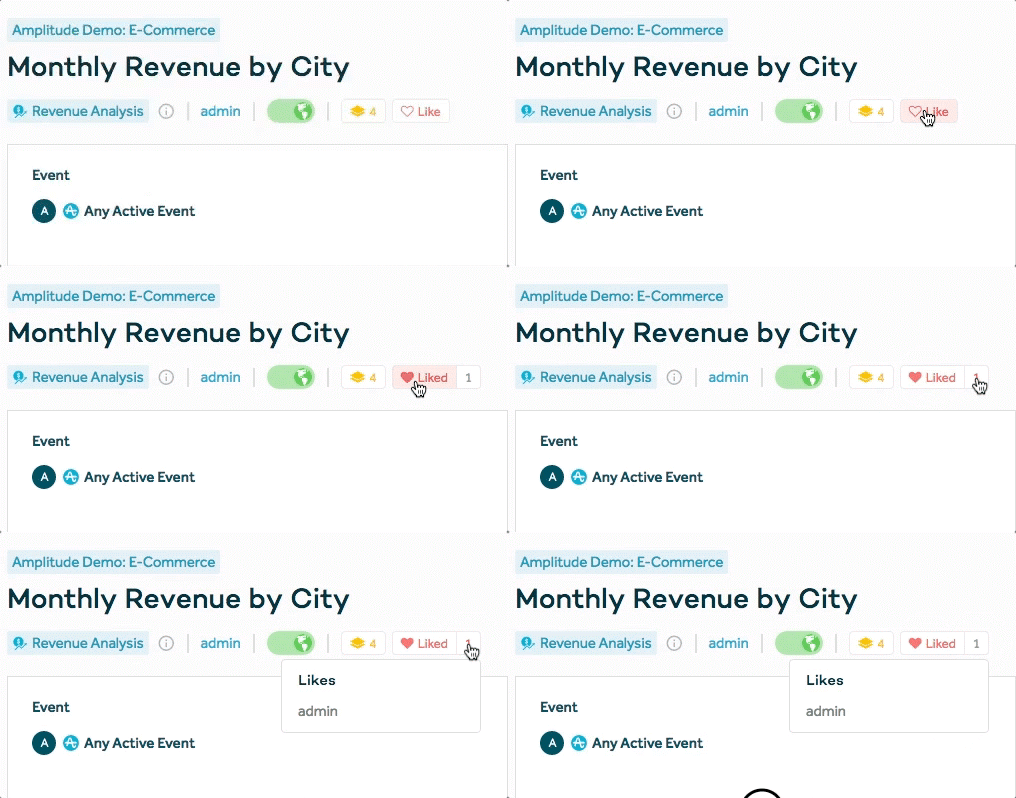
“️” Charts
Favorite (heart) charts that you want to revisit or access often. Click on the number next to the Like button to see which of your teammates have already liked this chart. You can then use the “Browse Charts” tab to search through your favorites.
Feature Improvements
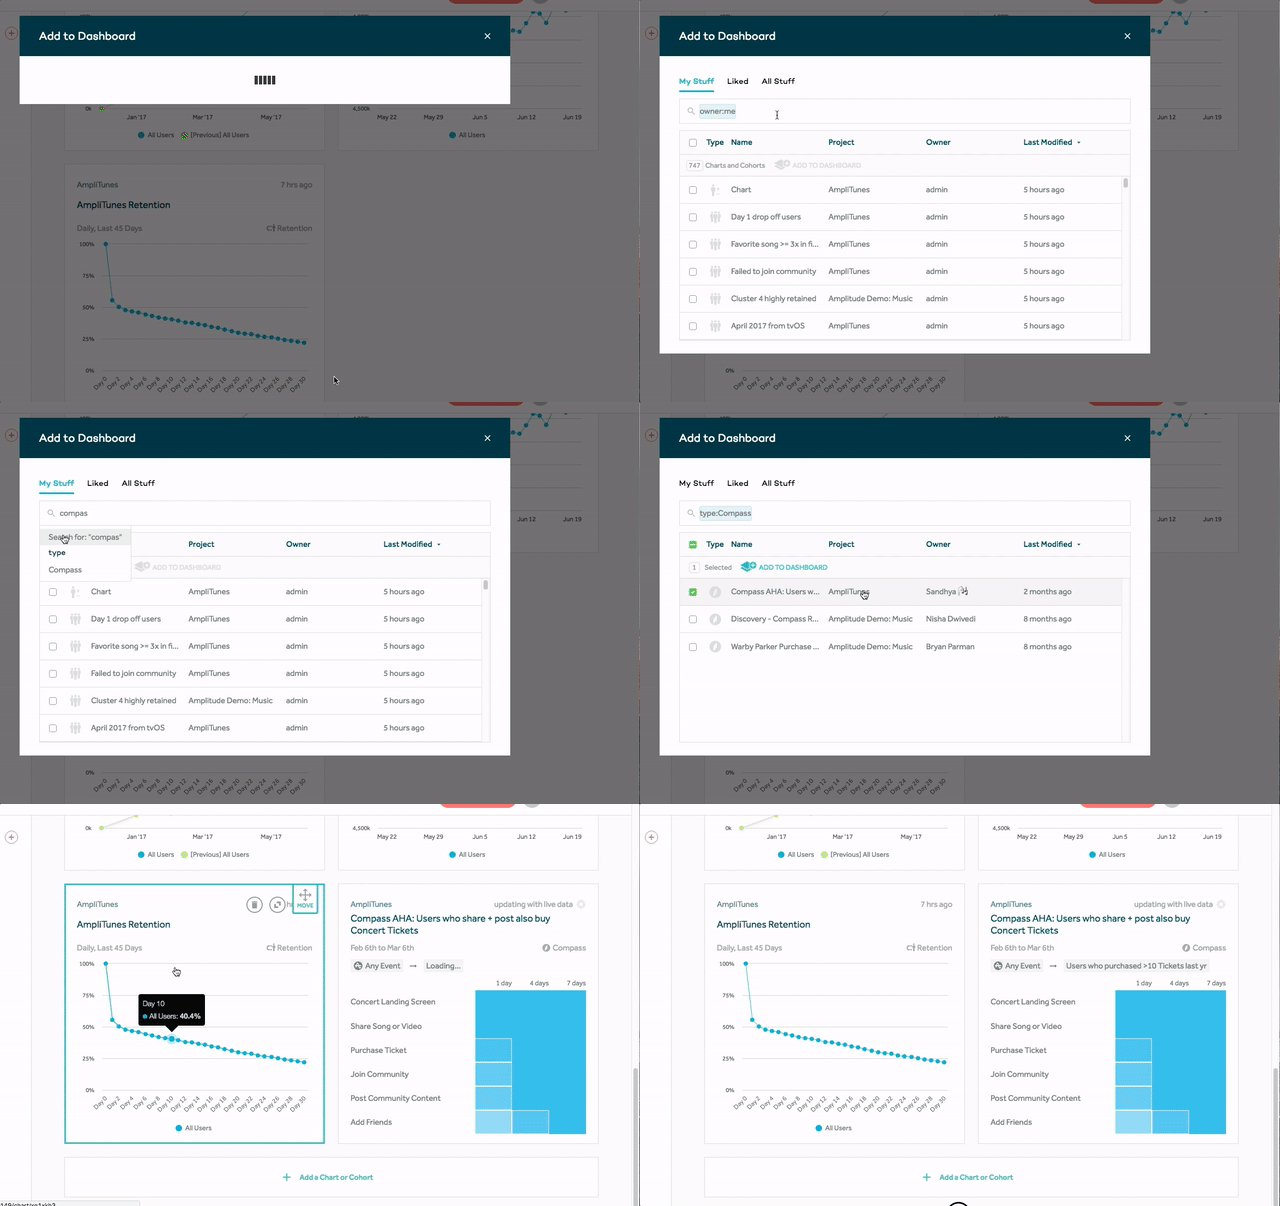
Dashboards: Add Cohorts, Pathfinder, and Compass reports
(Enterprise Only) Behavioral cohorts, Pathfinder reports, and Compass reports can now be added to dashboards!
Browse Charts: Bookmarks
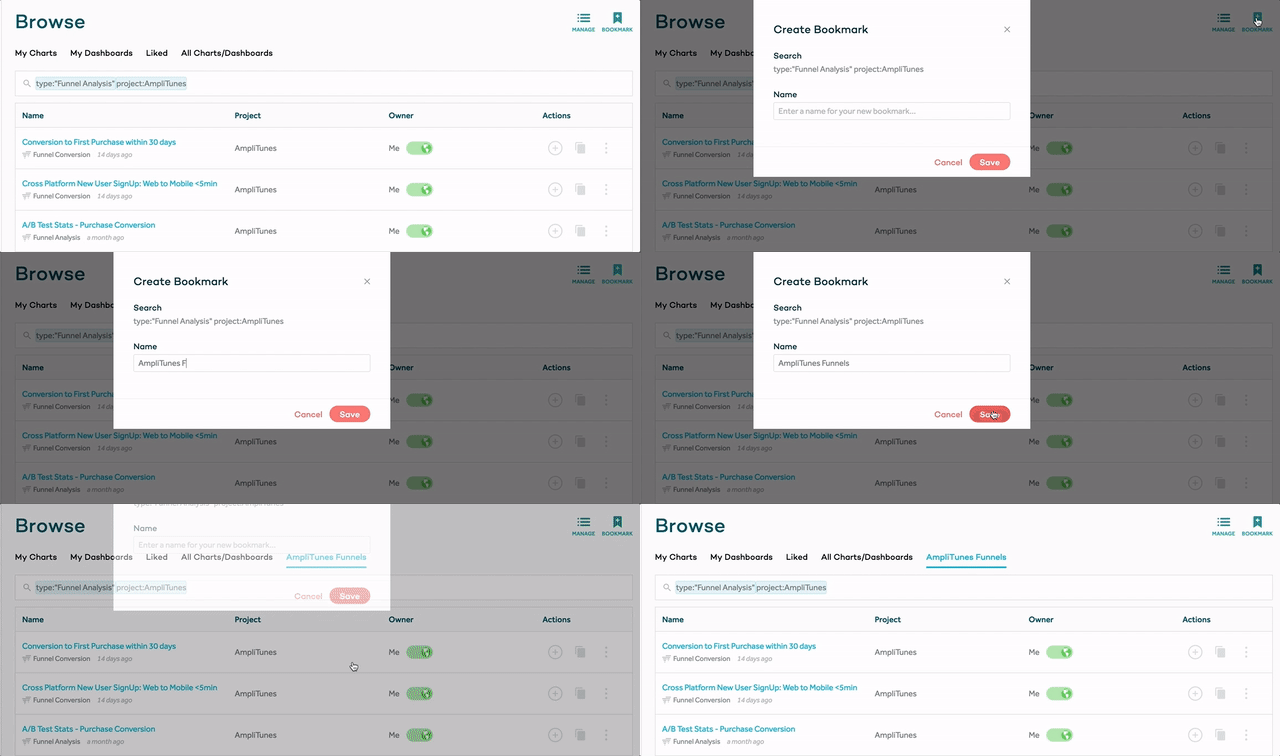
If you have created a search that you would like to be more accessible, save it as a bookmark. This will create a new filter at the top of the Browse Charts page.
Data Table: Sort By Table Summary Column
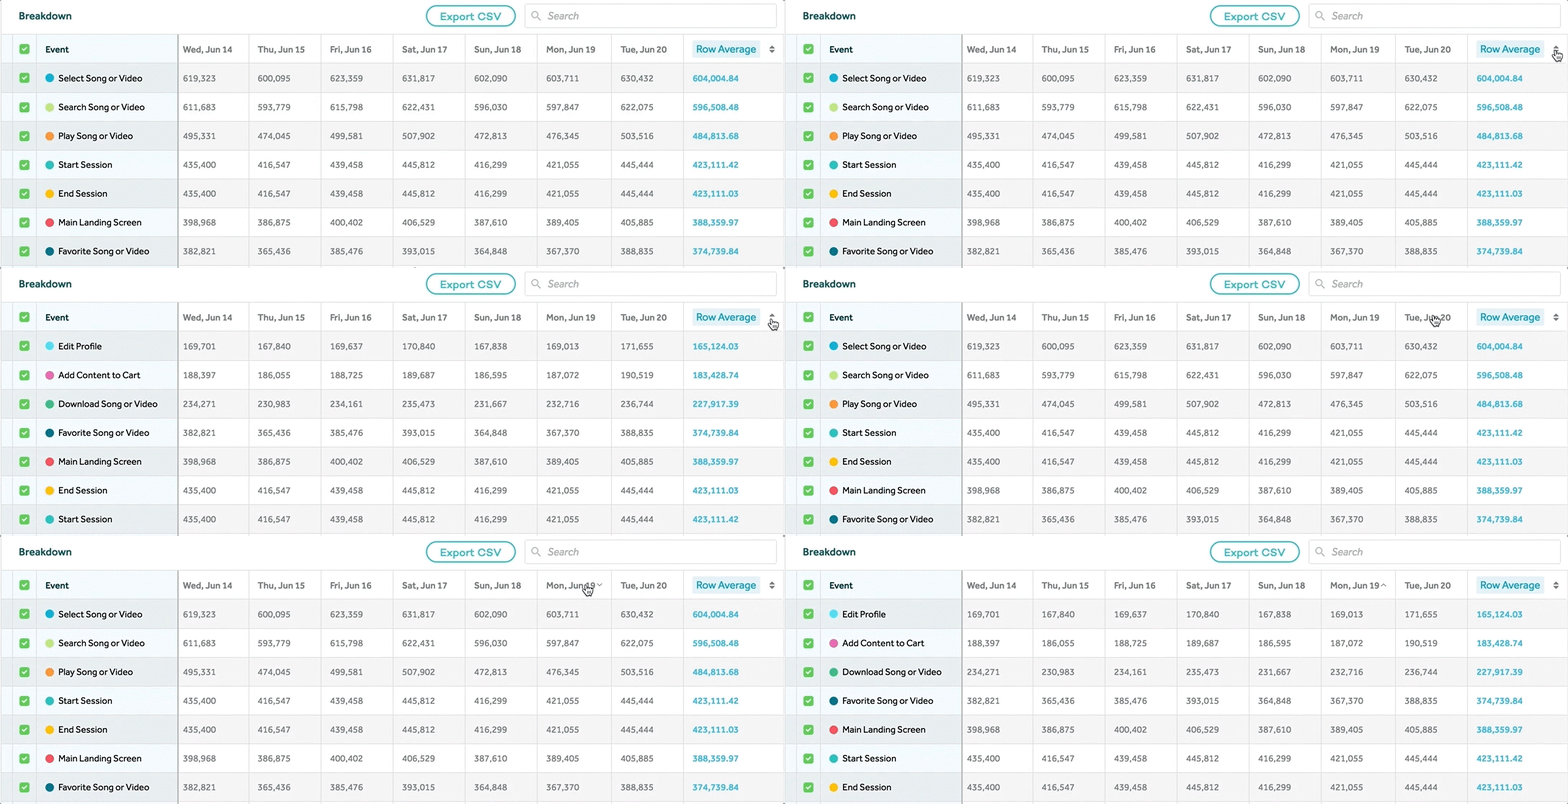
Sort by all columns (including the Summary Column) in the data tables below charts.
Custom Legends in Charts
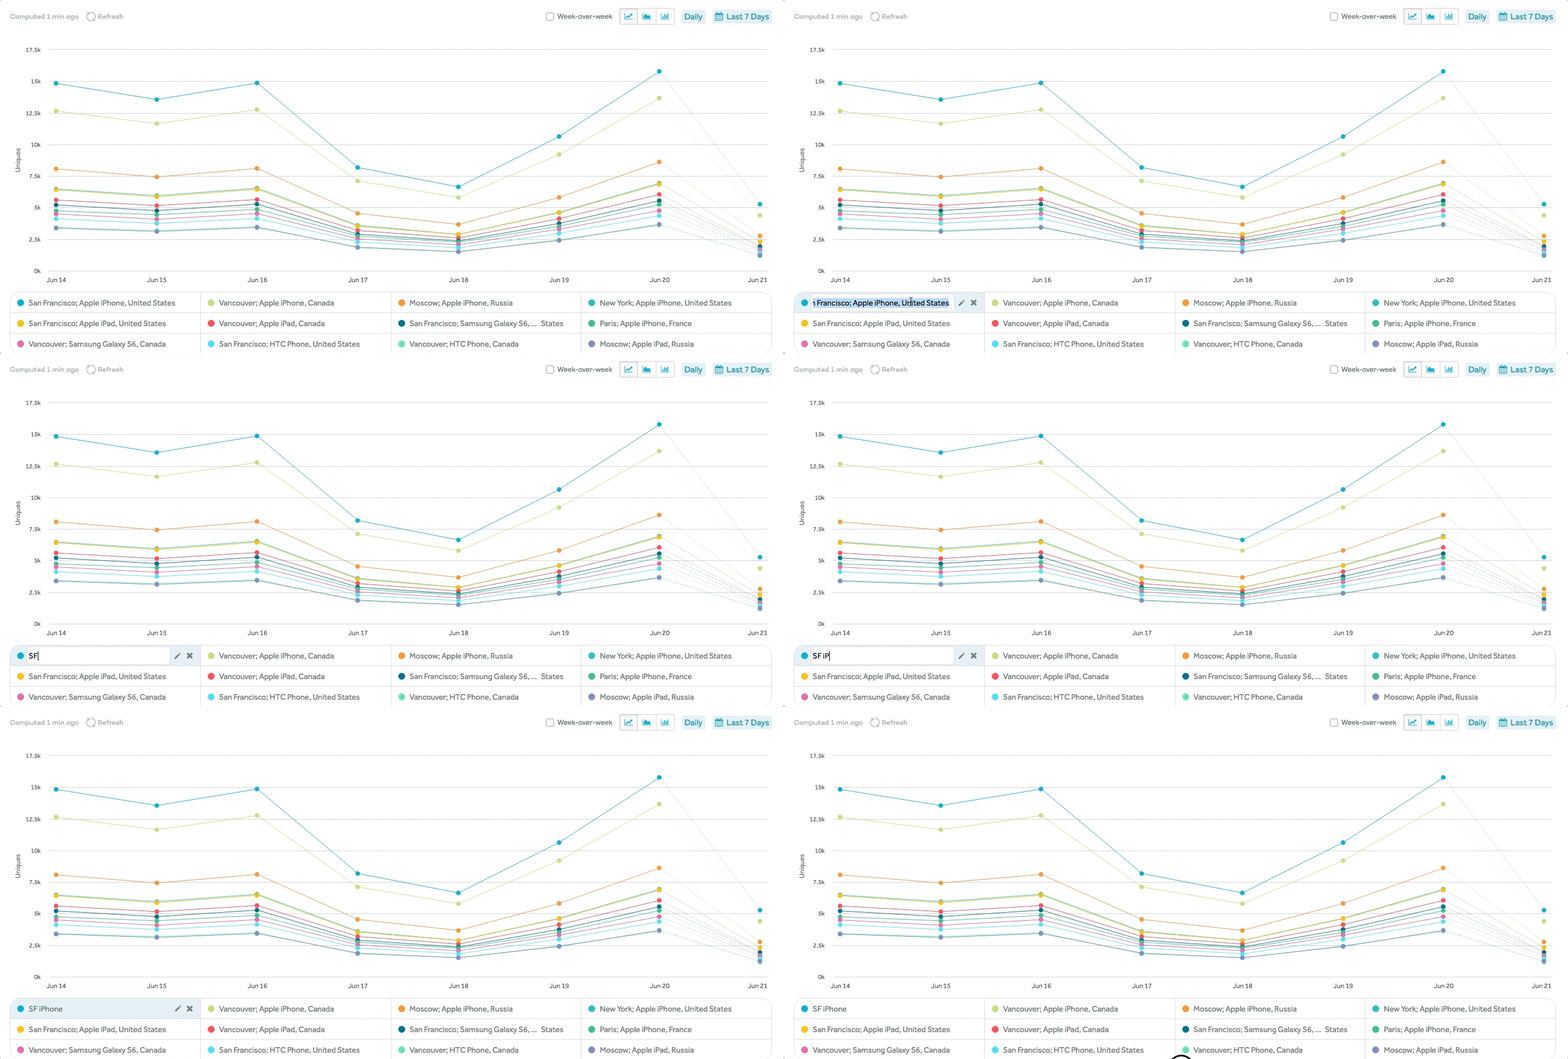
Rename legends to simplify the names of the segments you are analyzing.
Microscope: for Holding Constant Funnels
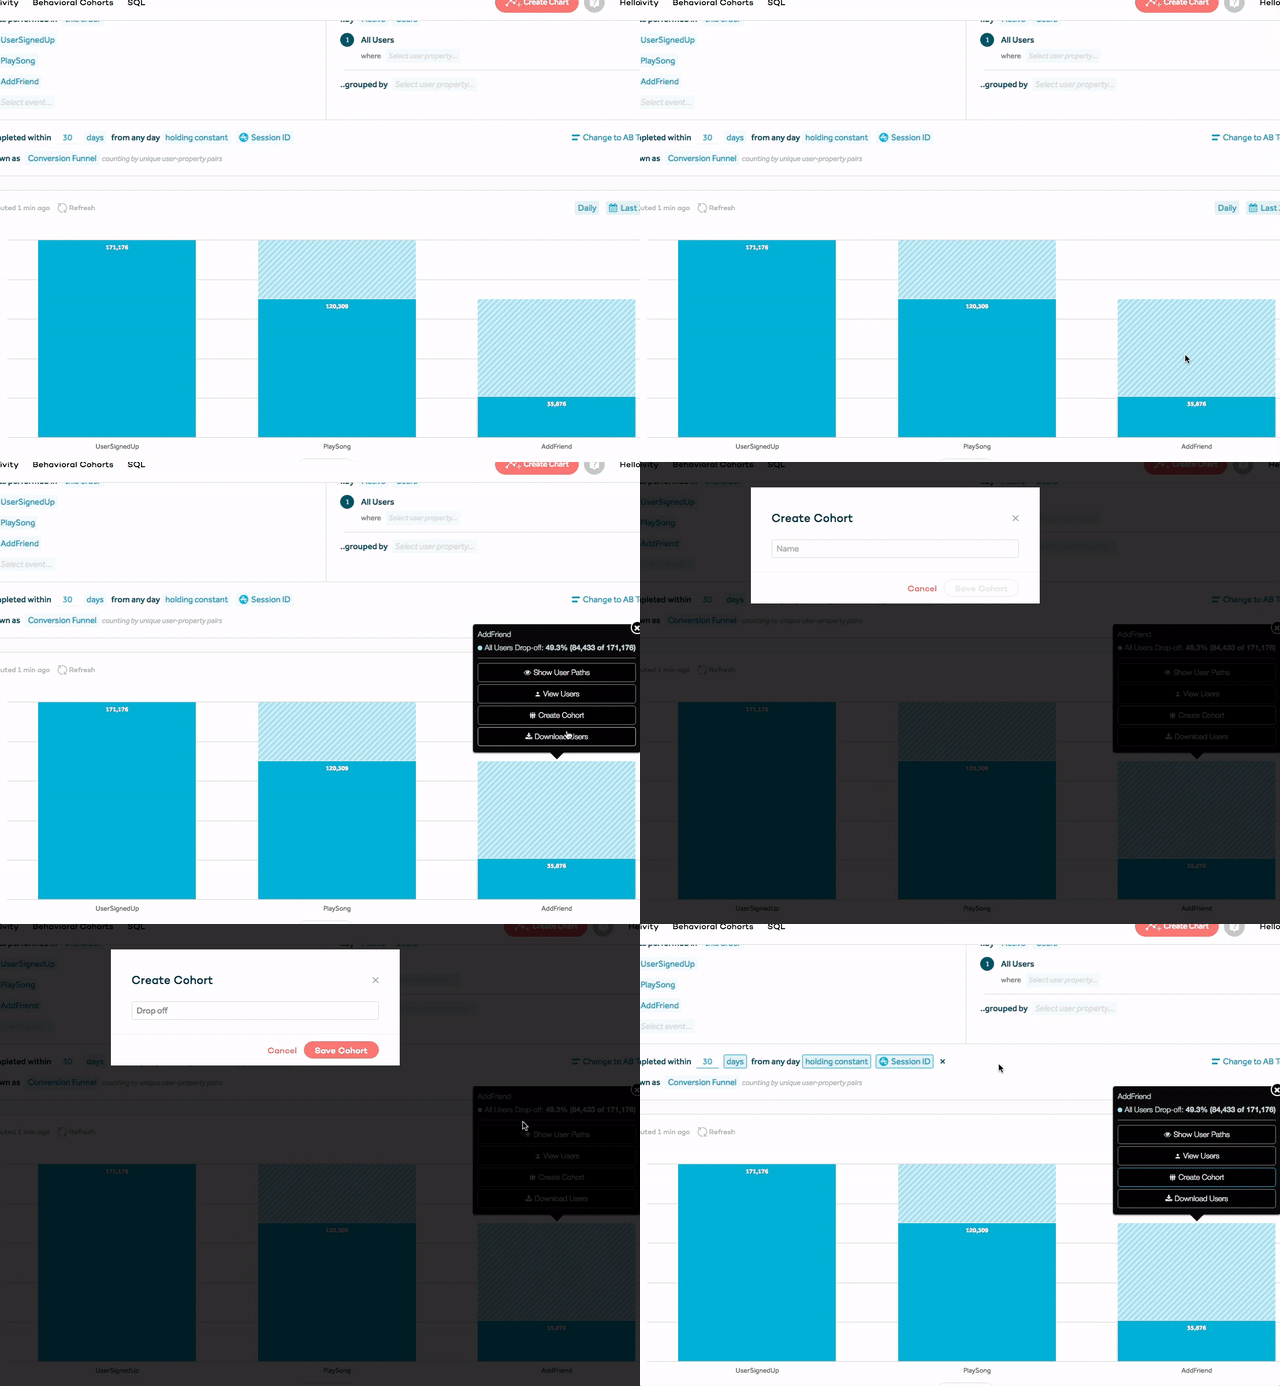
Microscope is now available in Funnels where a property is held constant.
Custom Formula: Multiple Metrics
Reminder: we’ve added the ability to plot multiple custom formulas on the same Event Segmentation chart. With this updated functionality, you can even superimpose your rolling average on top of your DAUs! You can do this with the custom formula UNIQUES(A); ROLLAVG(UNIQUES, A, 7) where the semicolon separates the formulas and event A is set to ‘[Amplitude] Any Active Event’. Read more about custom formulas here.
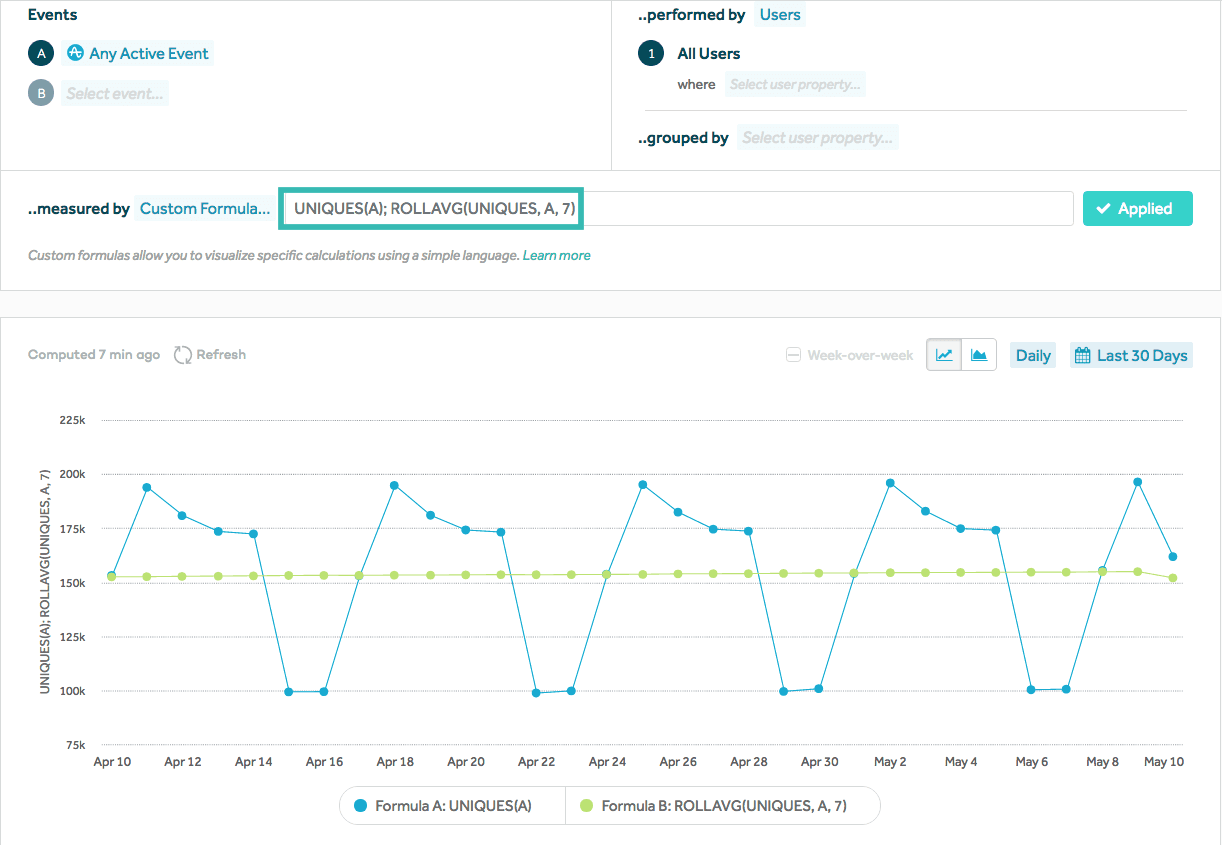
Chart Zoom
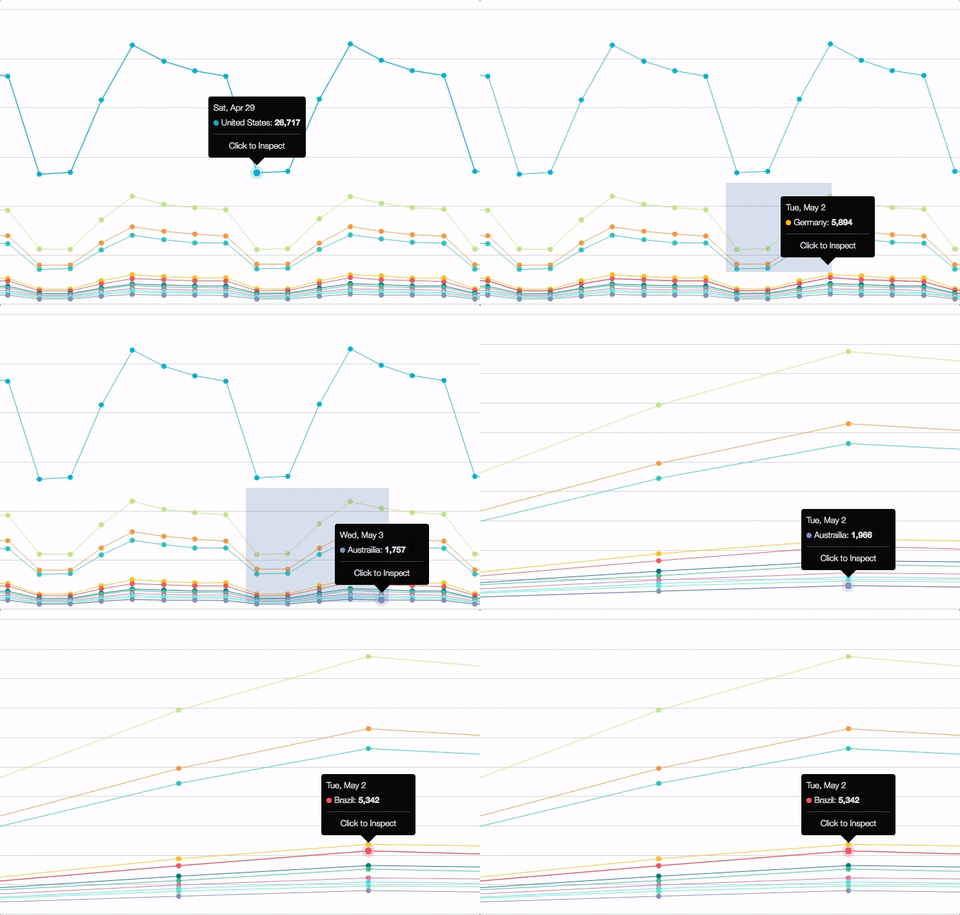
Reminder: You can now zoom in on interesting data points in charts. You can zoom in by dragging diagonally with your mouse across an area of your chart that you want to focus on. See our Help Center article for more information.

Kate Adams
Former Product Manager, Amplitude
Kate is a former product manager at Amplitude focused on improving customer adoption. She's always looking for excuses to visit new places, learn new things, and eat unusual food.
More from Kate


