Engineer for a Summer: 3 Learnings From My Internship with Amplitude
Amplitude interns learn by doing. Engineering intern Anton Cao reflects on his top three learnings after building an end-to-end user feature in three months.
If you’d told me a year ago that product analytics were required for building great products, I probably would have laughed it off. Until I watched a talk given by Spenser Skates, co-founder and CEO of Amplitude, my view on product development was focused solely on the engineering side. But Spenser’s presentation opened my eyes to the fact that great products need more than great engineering — they need product analytics, too.
Curiosity piqued, I met the Amplitude engineering team in-person at the MIT Career Fair last spring and was struck by a demo of the company’s analytics platform and how easily it presented complex data. Eager to learn more about product analytics, I decided to dive headfirst into the subject by working as an engineering intern on Amplitude’s infrastructure team.
This was certainly not your typical internship experience. Amplitude does not adhere to the principle of assigning interns “toy internship projects” or busywork to fix overdue bugs. Instead, I spent countless hours working with the biggest codebase I’d ever experienced to build a new feature from end to end. Building this feature, called Impact Analysis, pushed my limits and led me to develop valuable skills that transformed my perspective on product development. From people to products, here are the top three learnings I gained from my summer at Amplitude.
1. Keep products simple.
At Amplitude, engineering interns are given the freedom to build a feature. My summer project was a feature called the Before/After analysis, which I later rebranded to Impact Analysis. It helps companies understand whether performing an event for the first time impacts how many users perform other events, and how often. For example, does using the Notebook feature in Amplitude for the first time increase how many charts a user makes over the course of the next year?
While this was my first experience working on such a large codebase, I made it my goal to build an analytical tool that would make it possible — and simple — for customers to understand this “before/after” behavior in their product.
Understanding causality in product analytics is often complex but doesn’t need to be
Causal inference can be very complicated, and according to customer feedback, Amplitude’s existing tools didn’t fully address this issue. So I made it my mission to make Impact Analysis simple enough that the results are meaningful yet interpretable. It works like this: You pick two variables to look at — an exposure event (such as computing a pathfinder chart) and a metric event (such as computing a funnel chart). Then, the Impact Analysis chart shows you the stats for your metric event in the time range corresponding to when users first perform the exposure event.
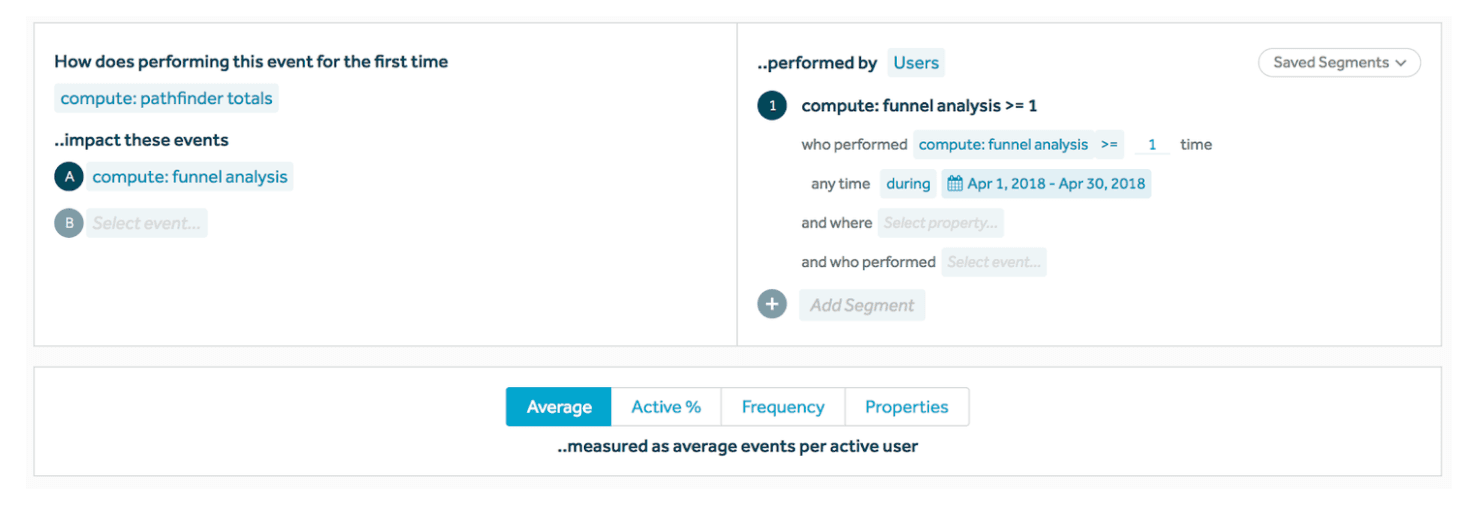
If you are familiar with event segmentation, the controls are very similar: You select the events on the left as well as user segments on the right and the specific metric you want to plot on the bottom. The only caveat is that group bys cannot be performed on all the events from the panel on the right, unlike event segmentation. But you can still group by on individual events in the panel on the left.
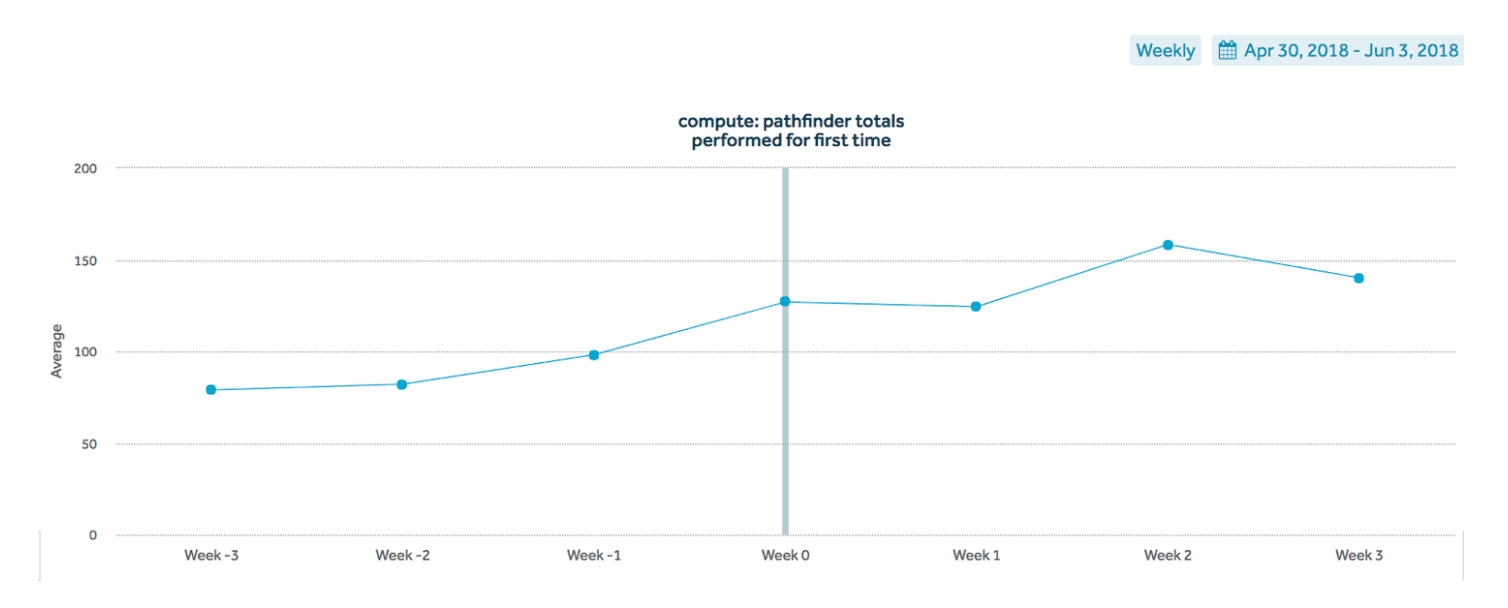
The resulting chart, similar to retention, displays user data aggregated over a relative time range (e.g., Week 1 is the first week after user first computes a pathfinder chart).
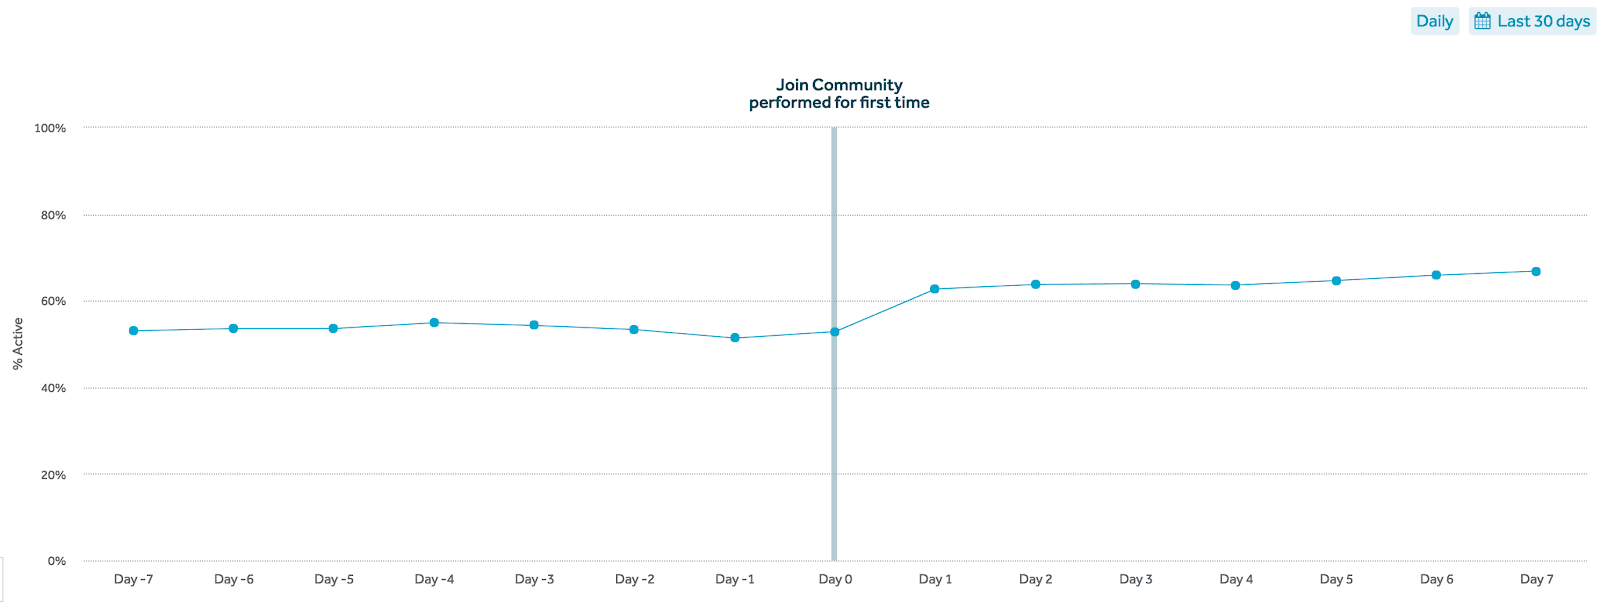
This makes the effect of the exposure event on the metric event much more apparent, and it can also decrease the effect of confounding variables, like seasonality. As a result, we can make a stronger claim that the exposure event causes a change in the metric event, whereas before we could only say the two were correlated. With Impact Analysis, companies can answer questions such as “Does becoming a subscribed member increase in-app purchases?” and more.
The bulk of the implementation work for Impact Analysis was on Nova, Amplitude’s custom database optimized for speed and scalability. Since Nova follows the MapReduce programming paradigm, I needed to implement a mapper and reducer for my new chart type. In the mapper, I was able to reuse the existing mappers for event segmentation because the two chart types require similar data. All of the logic for aligning users’ exposure times lived in the reducer; I had a lot of fun writing the algorithm and circumventing corner cases and bugs that arose.
2. Own your work.
Ownership is one of Amplitude’s core cultural values, the other two being humility and growth. During my time at Amplitude, I embraced the importance of ownership while building Impact Analysis. By the sixth week of my internship, the backend to support Impact Analysis was essentially complete. By the seventh week, I finished the middleware that connected the back end to the customer-facing website.
The next step was to add the UI for Impact Analysis to the front end. But all of the front-end engineers on my team were tied up with other features that needed full attention.
Even though I was not hired as a full-stack engineer, I took on the challenge of building the front end for my feature. With the mentorship of my coworkers, I’m proud to say that I successfully developed the feature from start to finish. Owning the work from end to end gave me a sense of satisfaction and pushed me beyond my comfort zone, which enabled me to learn new skills I would not have otherwise developed.
3. Independent teams are productive teams.
Amplitude is broken up into different “pods,” a term used to describe small yet powerful teams made up of engineers and designers. The cross-functionality of the team means that ideas at the start of a project are way more diverse, simply because people view the same project differently. This experience helped me appreciate what goes into getting a project started in terms of pitching an idea, reaching alignment with everyone on the team, and making compromises.
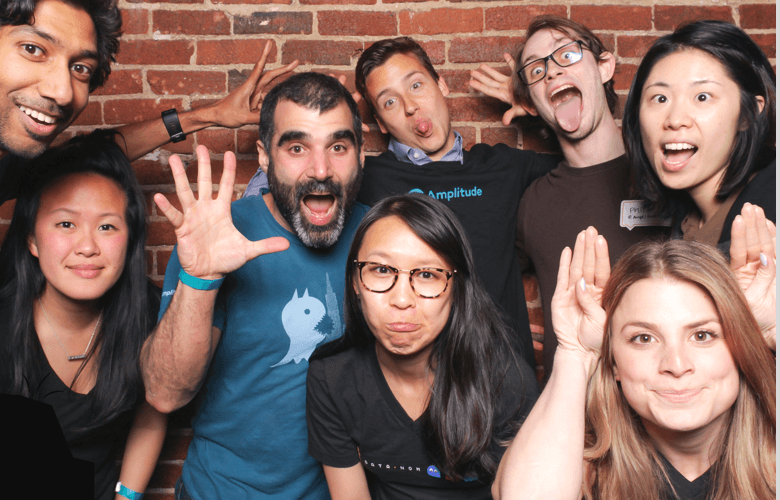
The people are what make Amplitude so special
The last point I want to mention is that Amplitude makes an effort to invest in its culture and community. I saw this throughout my internship, especially in one-on-ones. One-on-ones are a time for employees to meet for a 30-minute coffee break or a walk and talk about work, life, or anything else on their minds.
Through one-on-ones, I learned so much from people who were not only in engineering but also in product development, sales/marketing, and leadership. I got to ask questions such as “What is it like to be thrown into a new leadership position?” “How do you decide to start a startup?” “What exactly is product management?”
I would not have known how to find the answers to those questions if not for the emphasis Amplitude placed on meeting with and learning from fellow coworkers. I feel like this unique part of Amplitude’s culture really speaks to the closeness of the community.
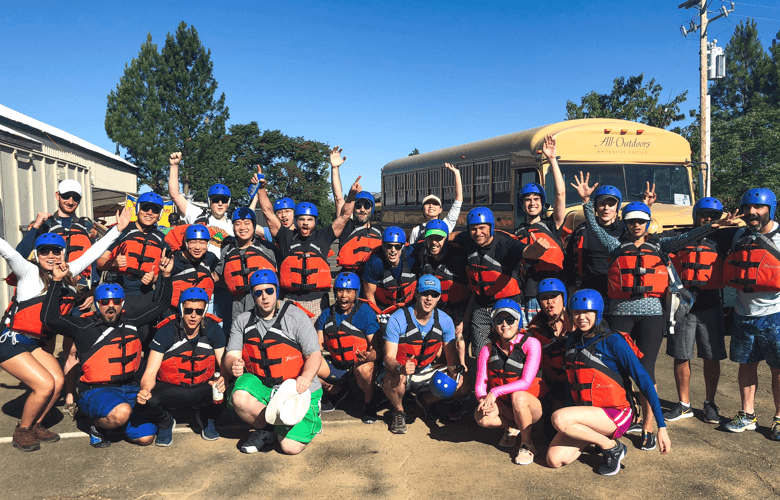
Amplitude was the height of my summer (ha, get it?), and the people were what made the experience so special. My time at Amplitude gave me a better of understanding of the wonderful work that results from a company that cares deeply about its mission and its people.

Anton Cao
Former Engineering Intern, Amplitude
Anton Cao is a former engineering intern at Amplitude. During his three month internship, Anton built Impact Analysis.
More from Anton


