Measure Feature Engagement in 6 Clicks or Less
Figure out which features are most popular with your users and which ones should be prioritized for improvement with Amplitude’s Engagement Matrix.
Have you ever wondered how your features are performing within your product? Have you ever shipped a new product feature and wondered how you’re going to measure that? Well, wonder no longer. Amplitude’s Engagement Matrix is a simple way for you to measure feature perform as well as feature adoption.
Engagement Matrix
To build an engagement matrix, follow these simple steps. In the events module, choose the events you’d like to include in your chart. Events are the actions that happen in the product and are often tied to specific features. You can select up to 20 individual event types. However, many Amplitude users find more exploratory value in using one of the default out-of-the-box options.
- “Top events” shows the top 50 active events by event totals in your project.
- “Bottom events” shows the lowest 50 active by event totals in your project.
- And “top and bottom events” shows the combined top 50 and lowest 50 active events by event totals in your project, giving you a matrix view comparing frequent and infrequent feature usage.
Top and Bottom User Events
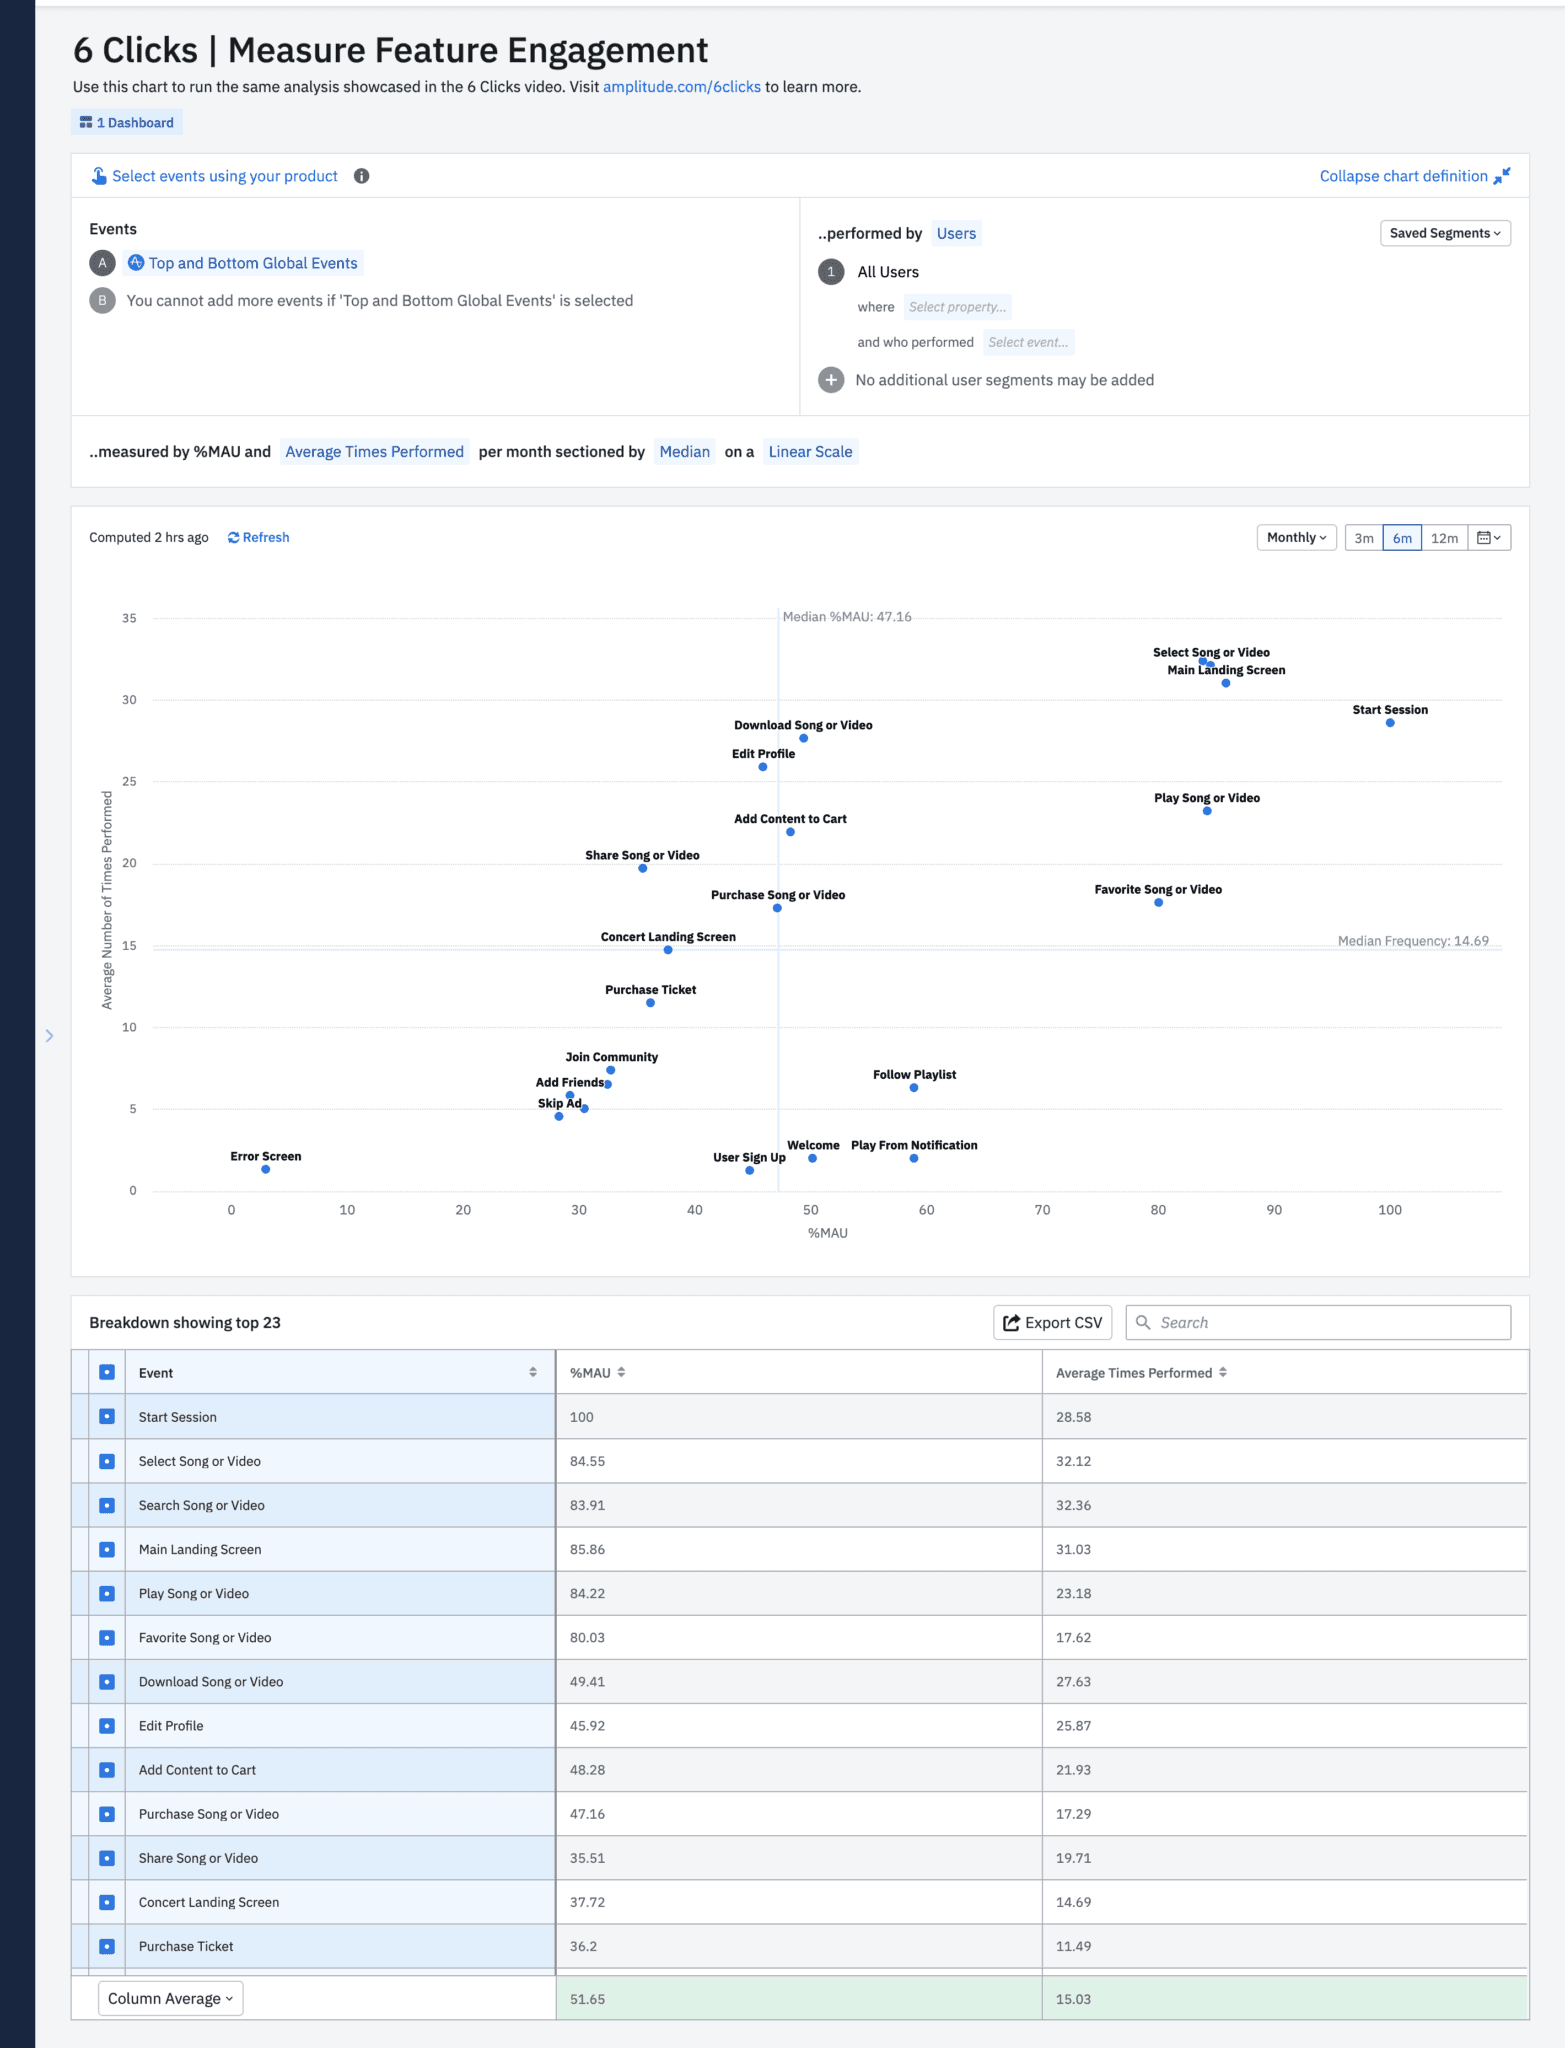
Let’s choose the top and bottom events so we will have a bird’s eye view of what people like and dislike about our product.
Daily vs. Weekly vs. Monthly Active Users
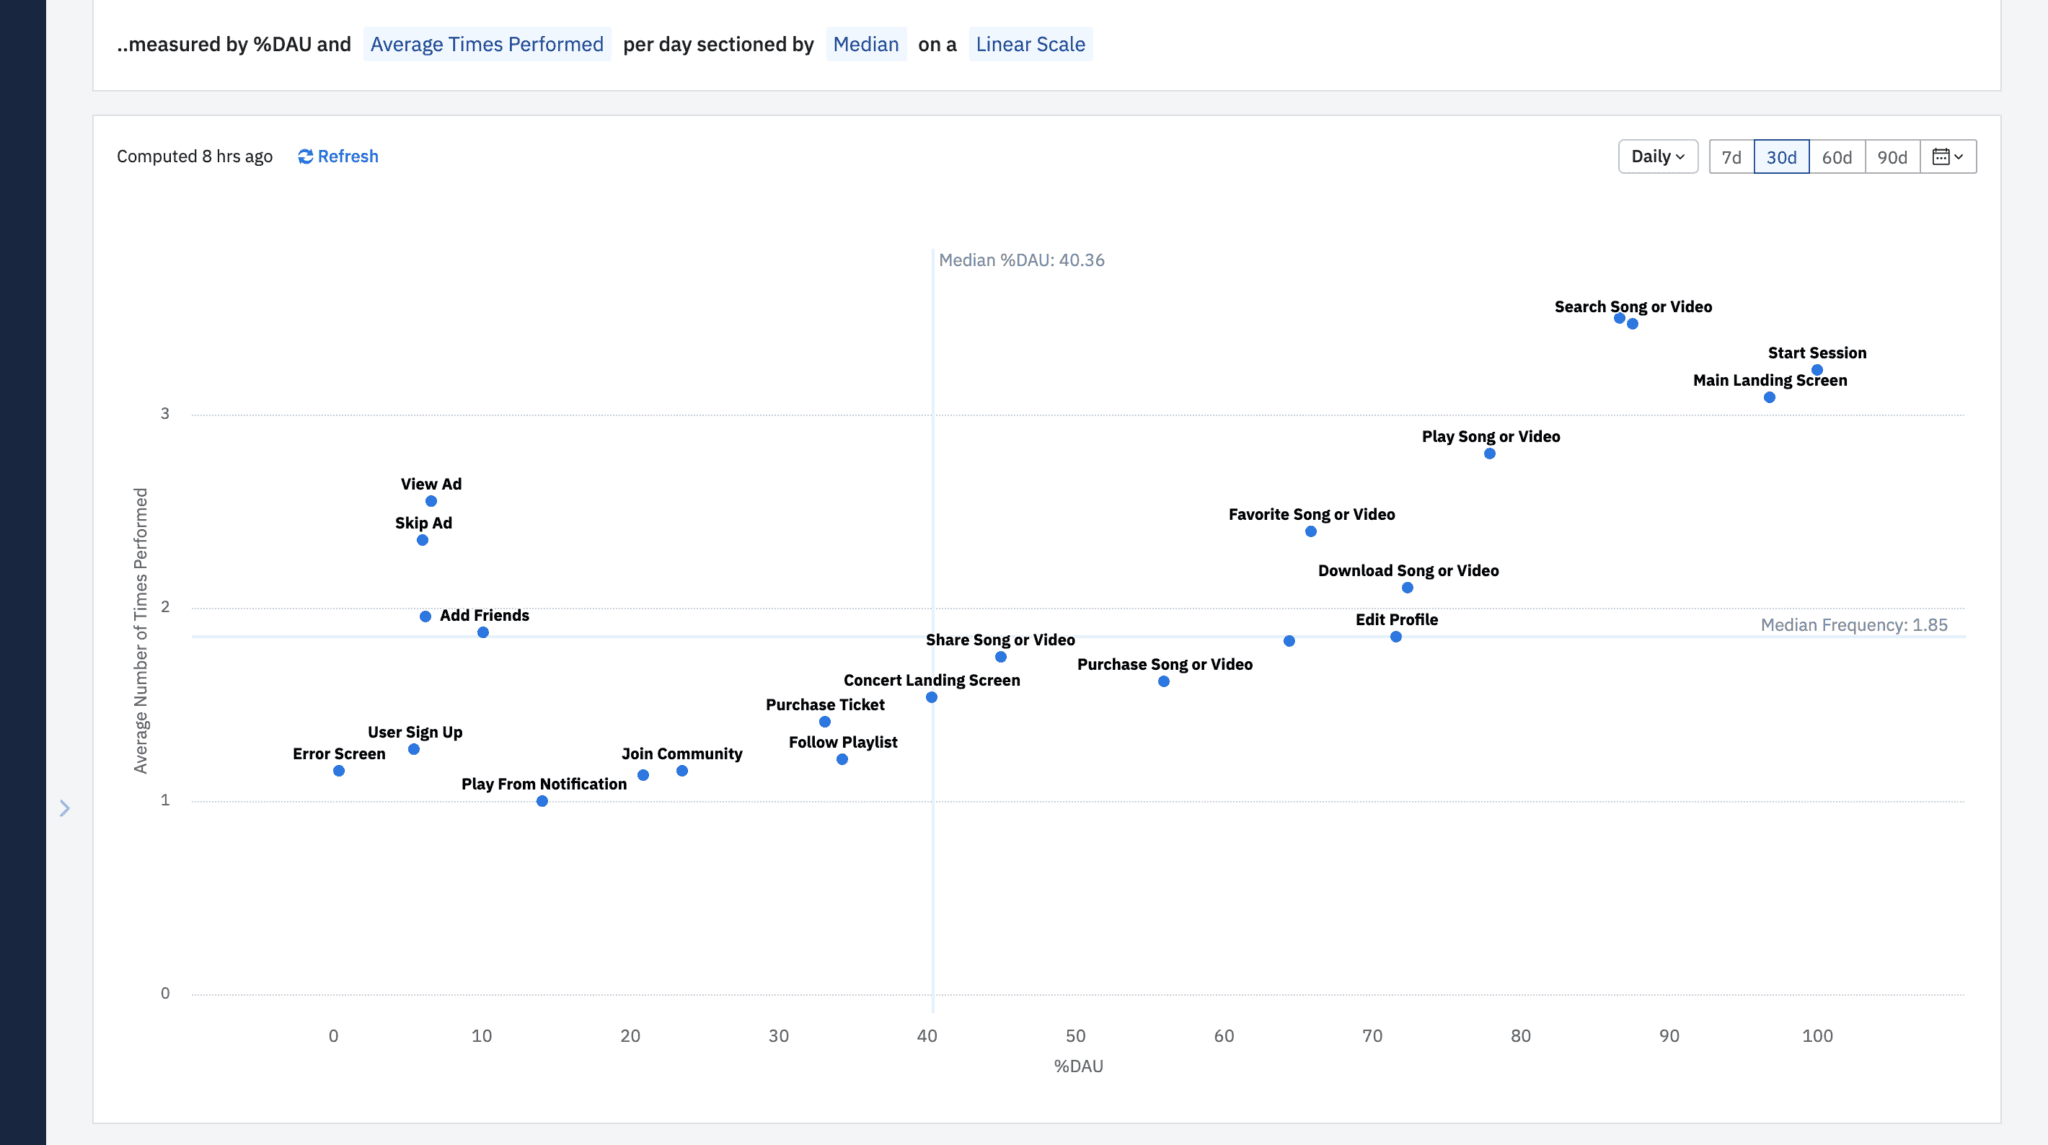
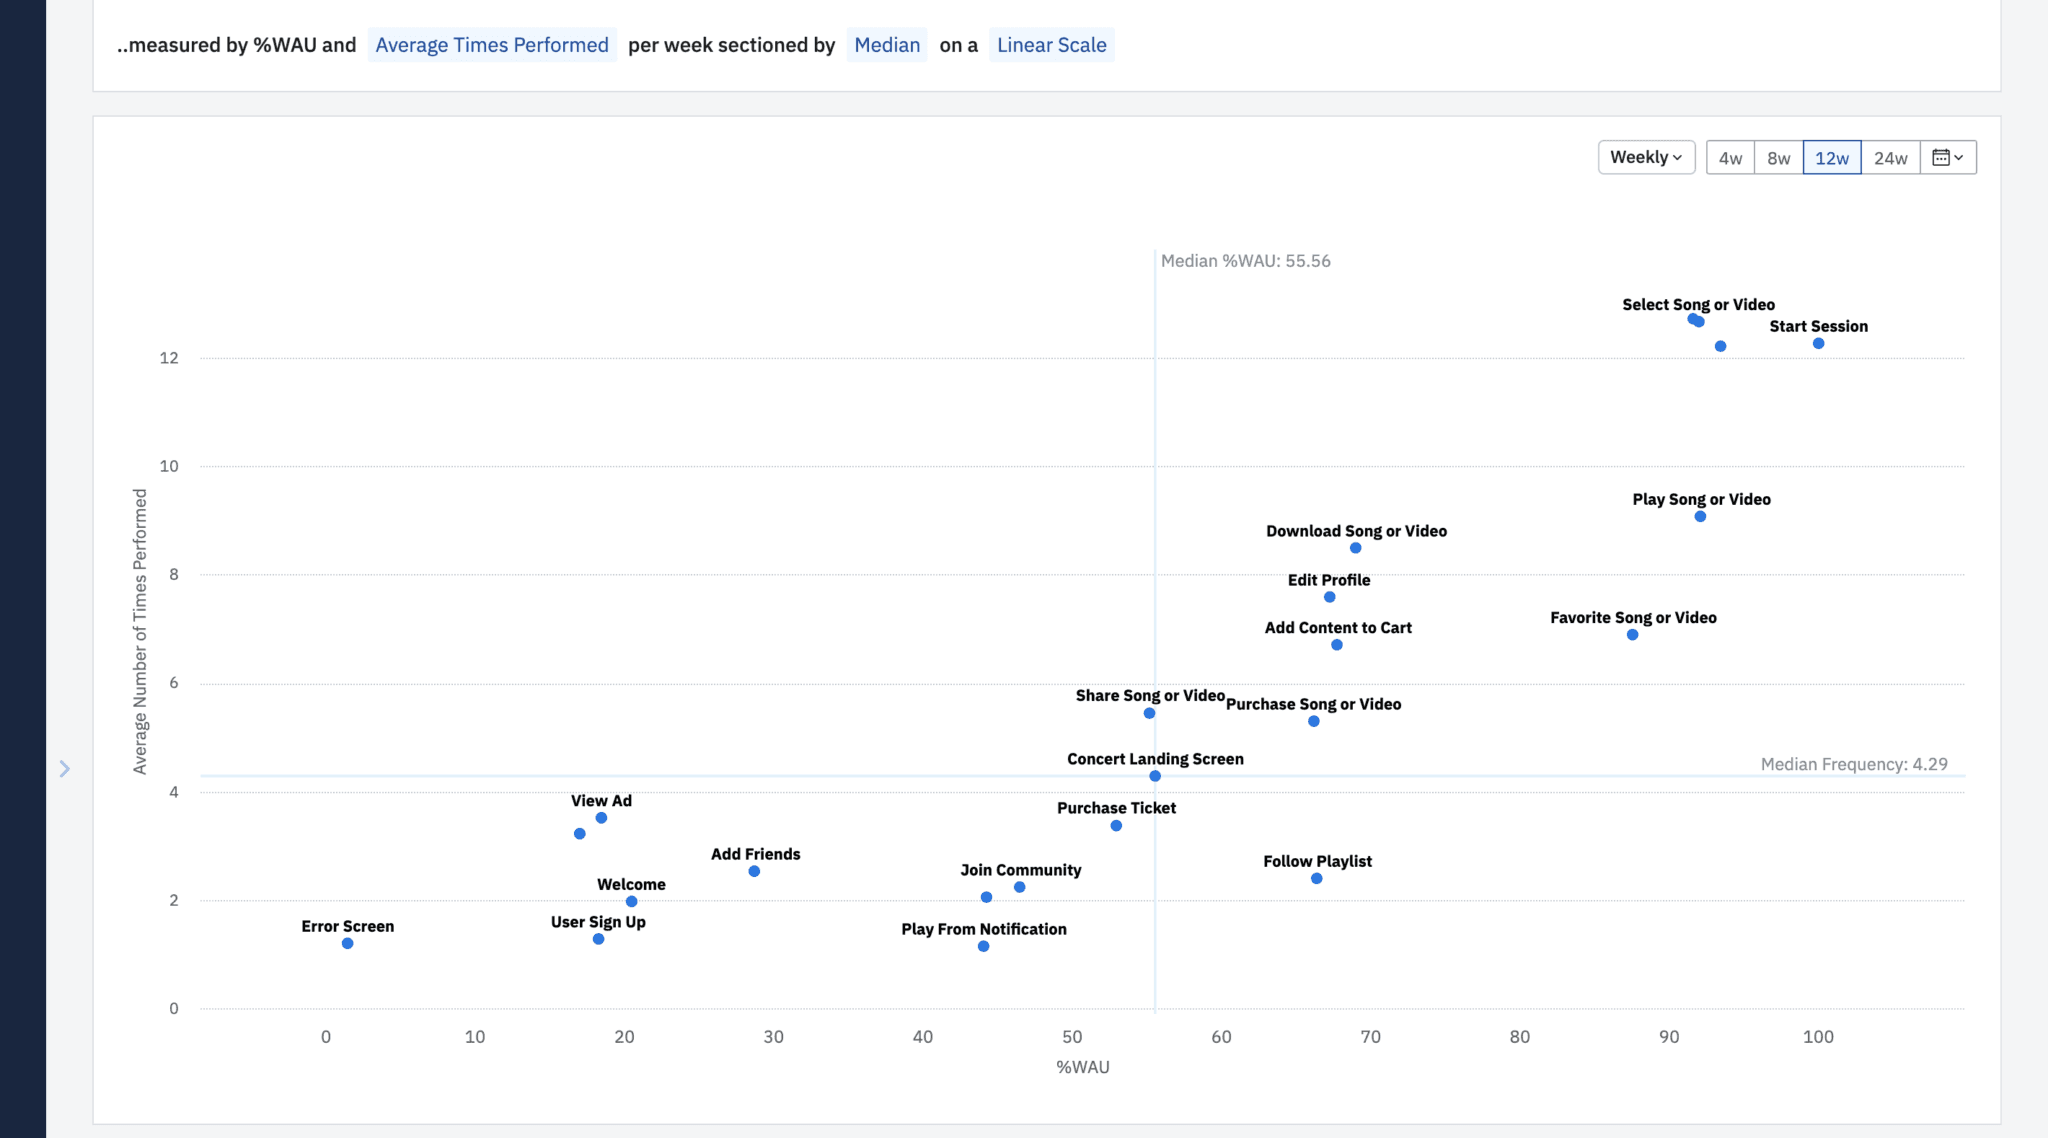
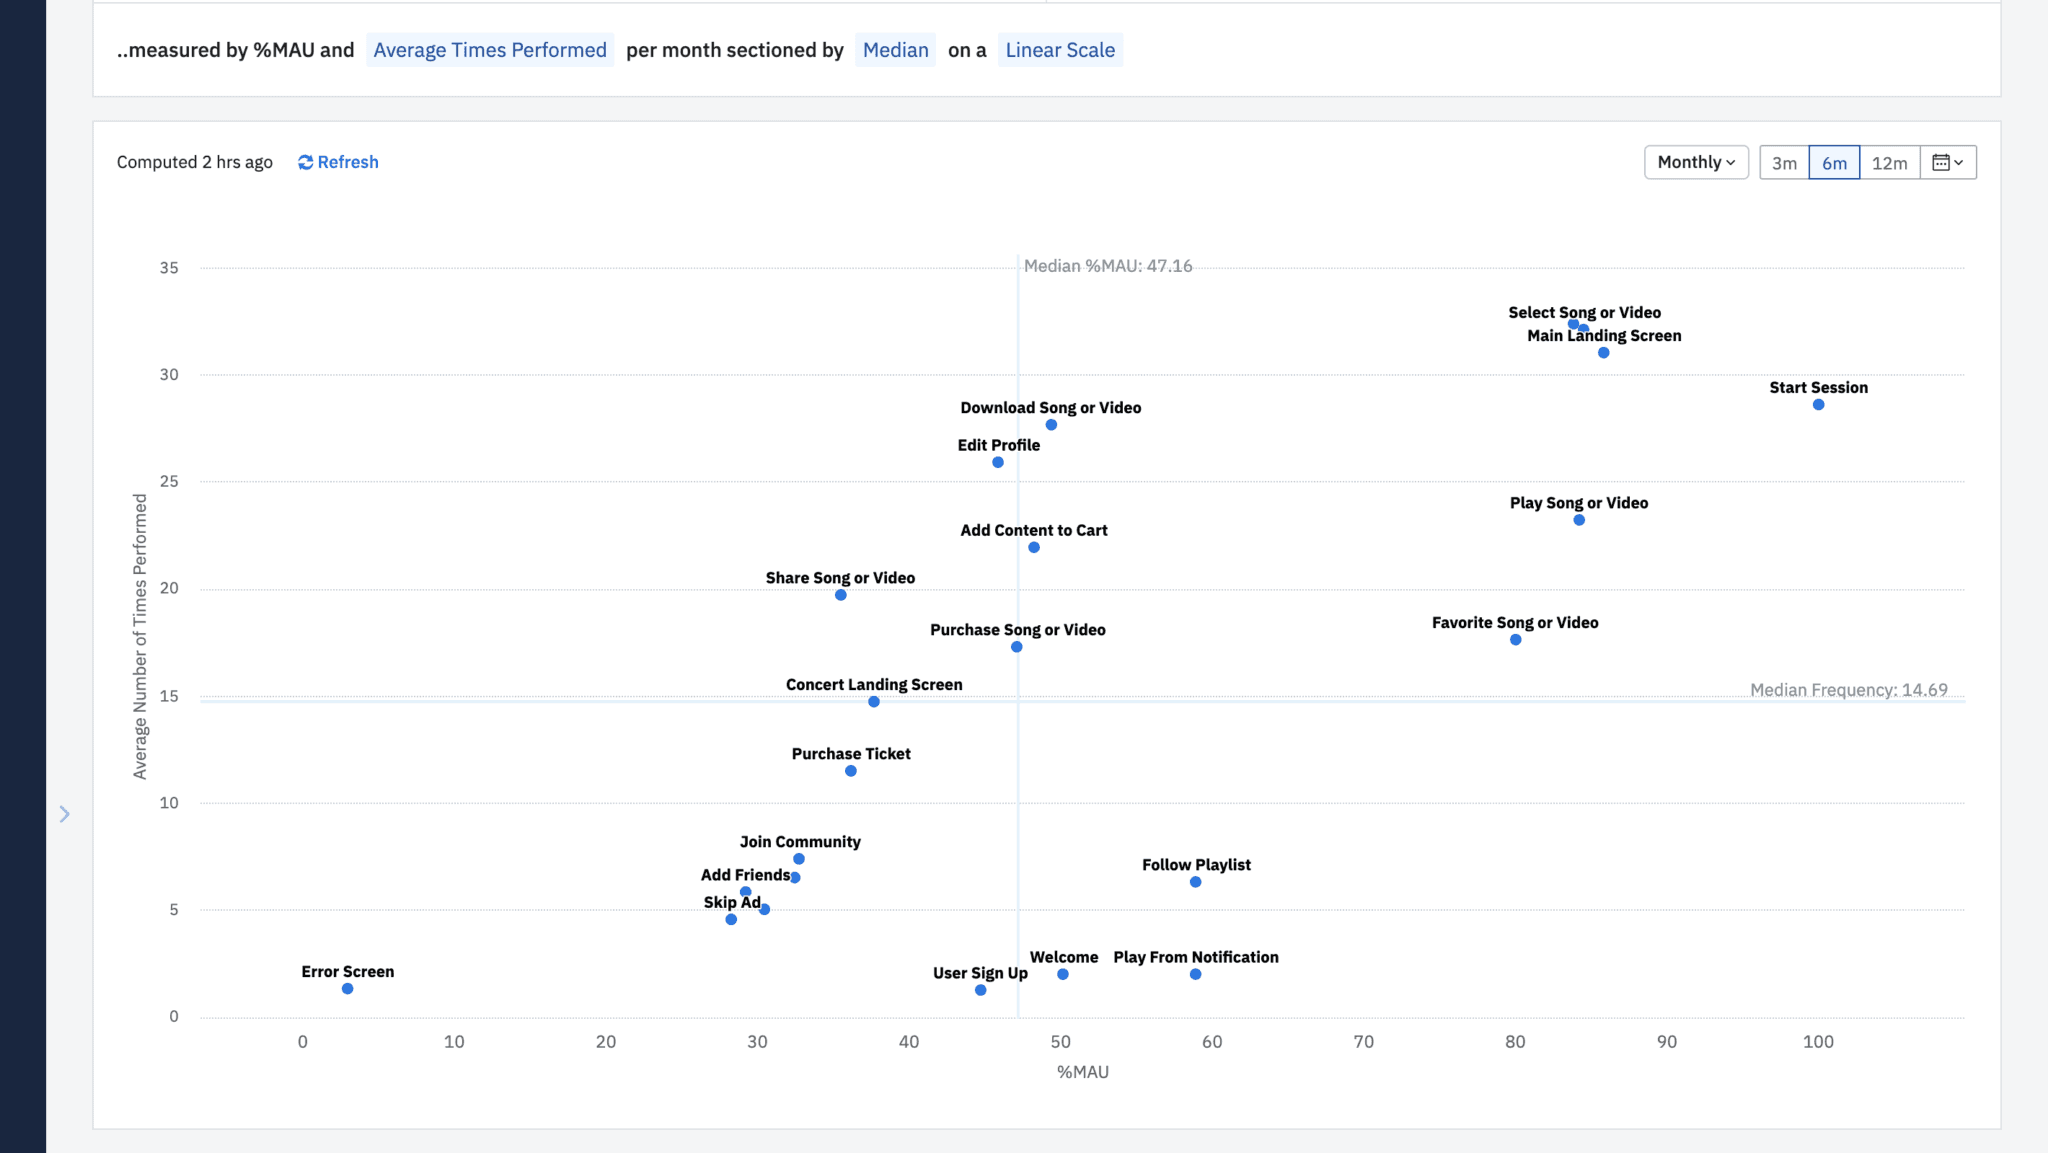
In the Metrics Module, you’ll also find a range of options to customize your Engagement Matrix analysis. First, decide whether you’d like to view your results by percentage of your daily active users, percentage of your weekly active users, or percentage of your monthly active users. To change this option, you’ll have to change your interval to match. For example, if your interval is set to monthly, you’ll only be able to see your monthly active users.
Feature Engagement by Daily Active Users
Feature Engagement by Weekly Active Users
Feature Engagement by Monthly Active Users
In the Metrics Module, you can also use the date picker to set the interval and the timeframe of your analysis.
Average Days vs. Times an Event Was Performed
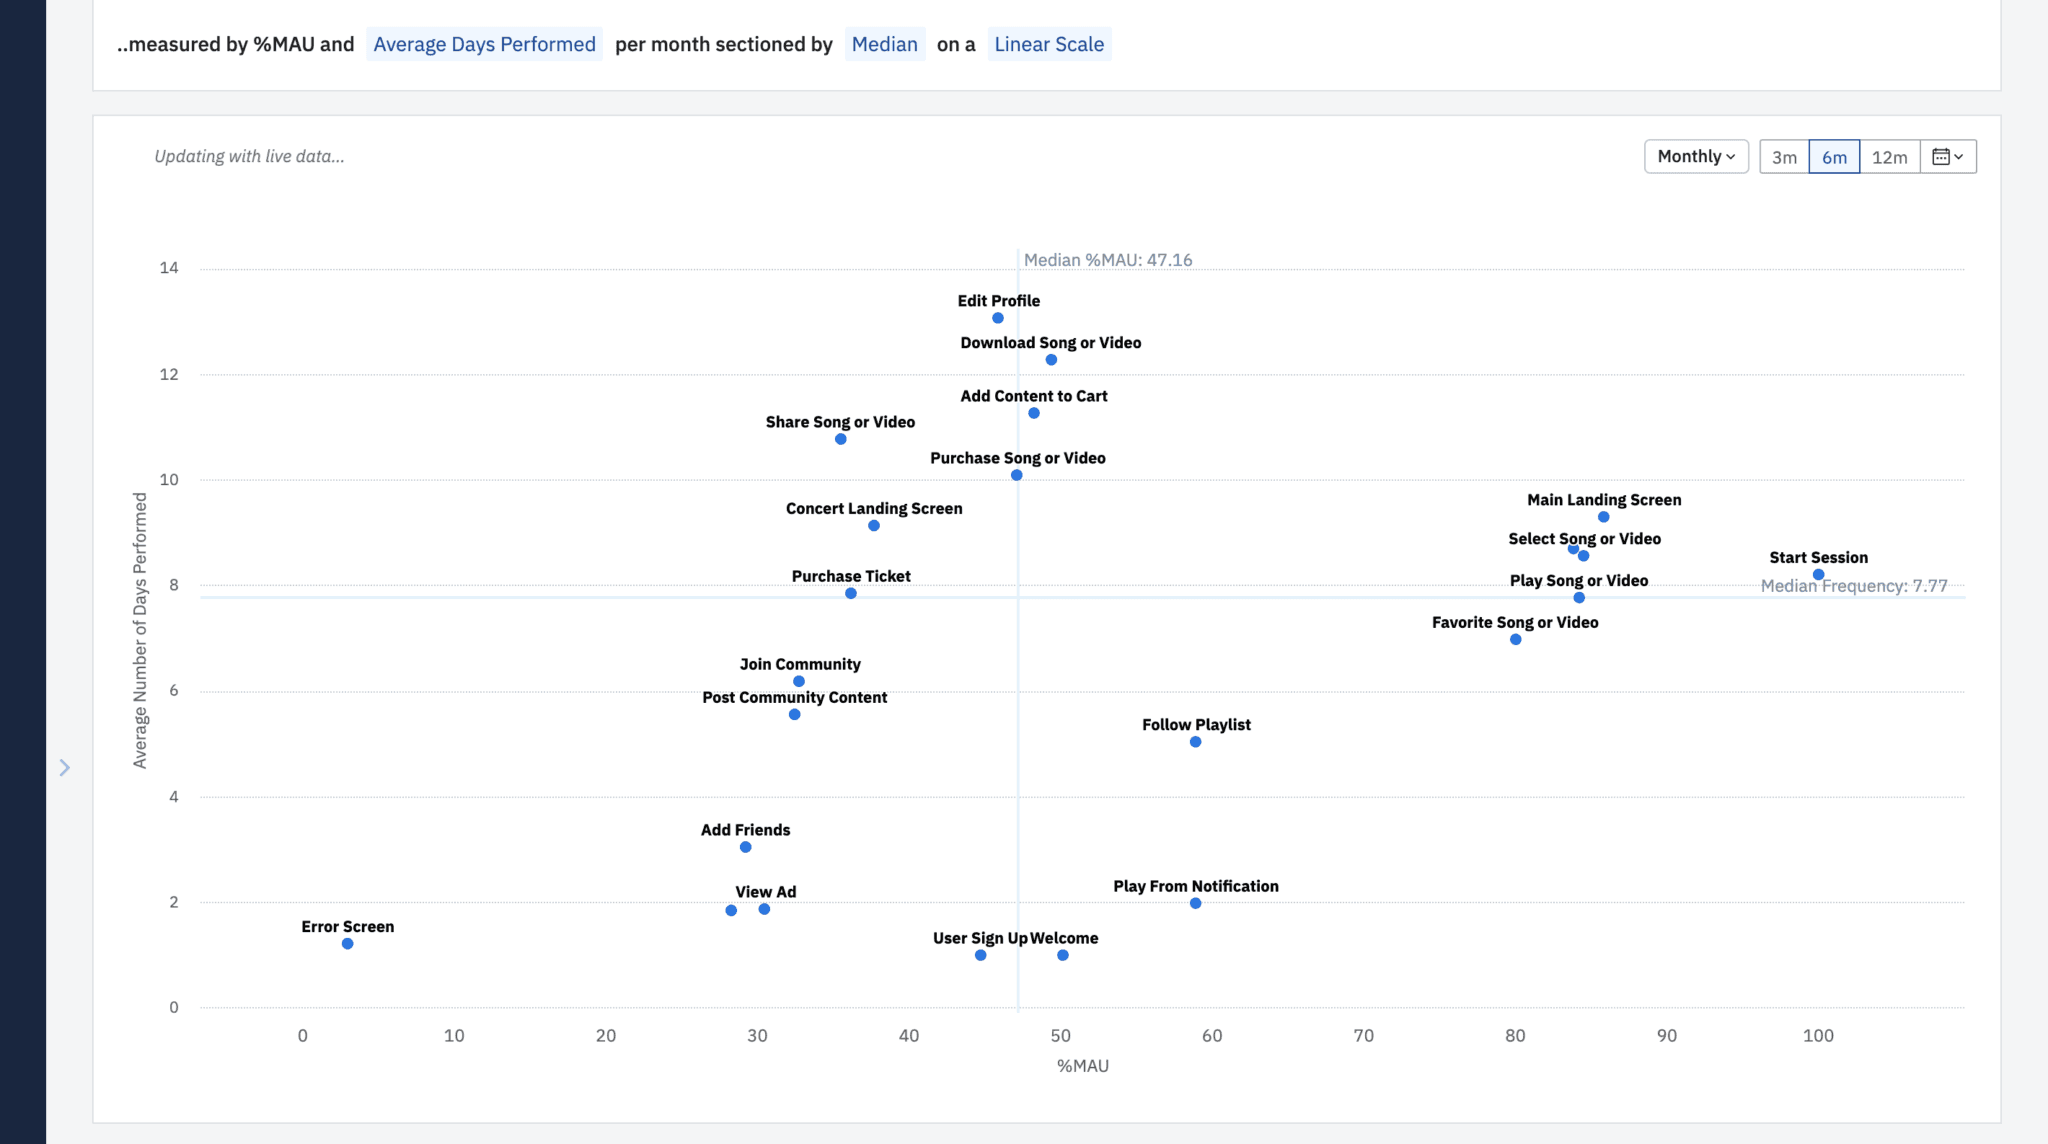
Next, you can choose between “average days performed” or “average times performed.” Average days performed will display on the Y-axis the average number of days an event was fired per unit of your interval. Keep in mind that if your interval is set to daily and you look at “average days performed,” you will likely see events clustered at the very top of the Y-axis.
Average Days Performed by Monthly Active Users
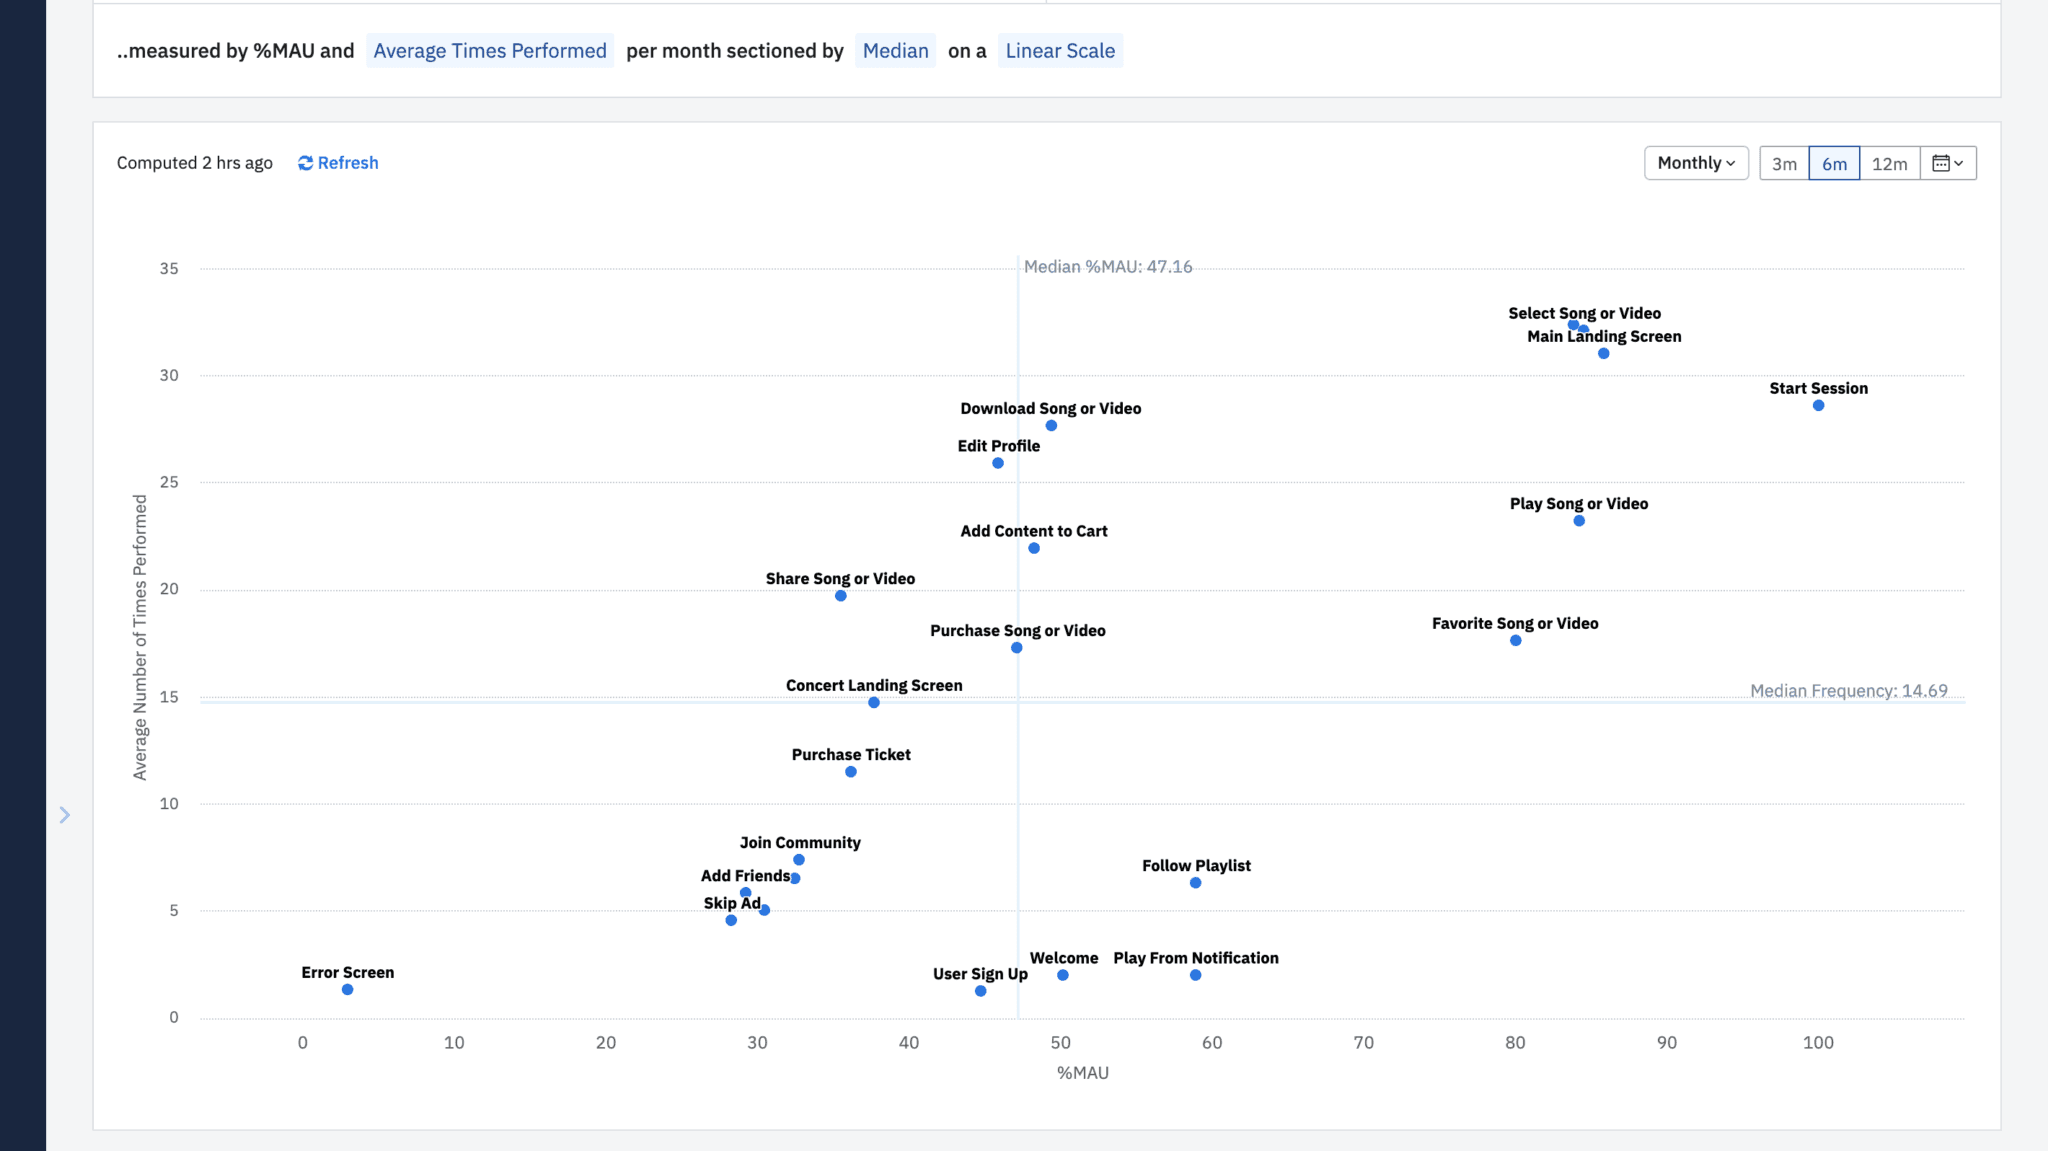
Average Times Performed by Monthly Active Users
Average times performed will display on the Y-axis the average number of times an event was fired per interval unit.
Feature Performance by Number of Users
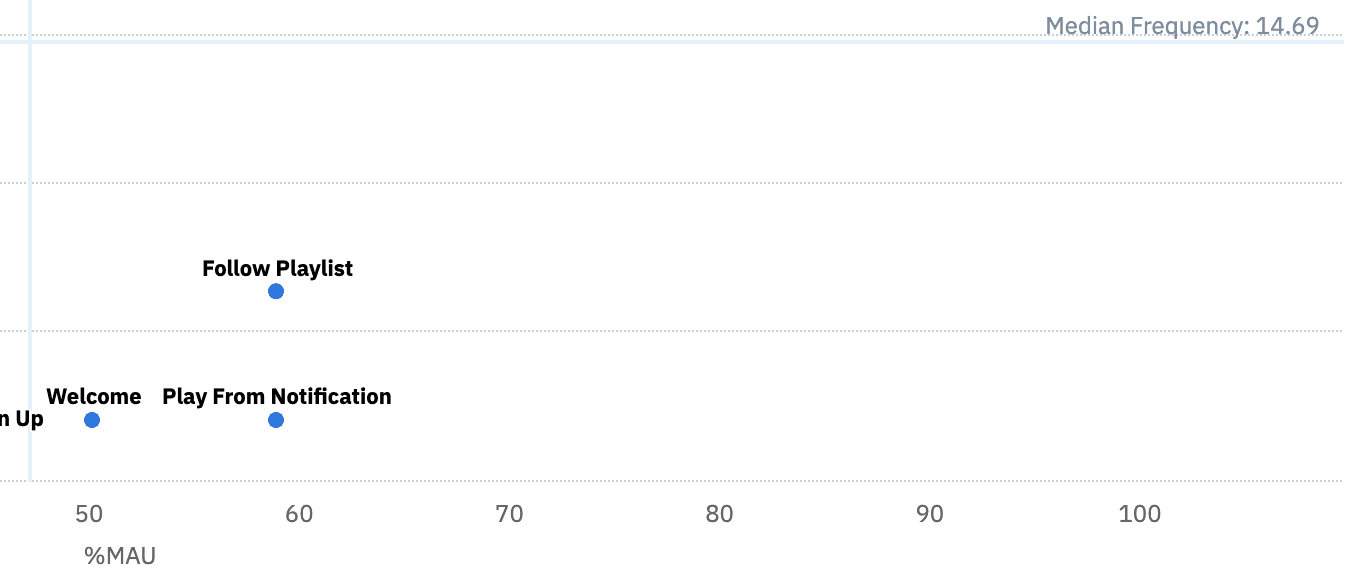
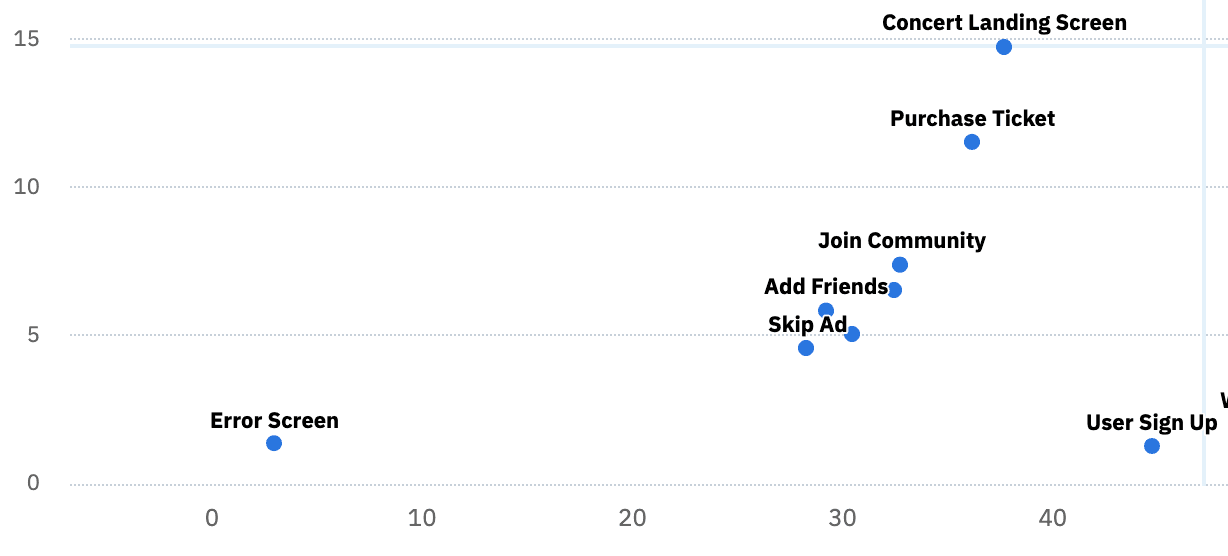
The light blue lines on the Engagement Matrix offer a handy way of categorizing your features and events based on their performance relative to each other. Use this to prioritize which events or features you wish to focus on.
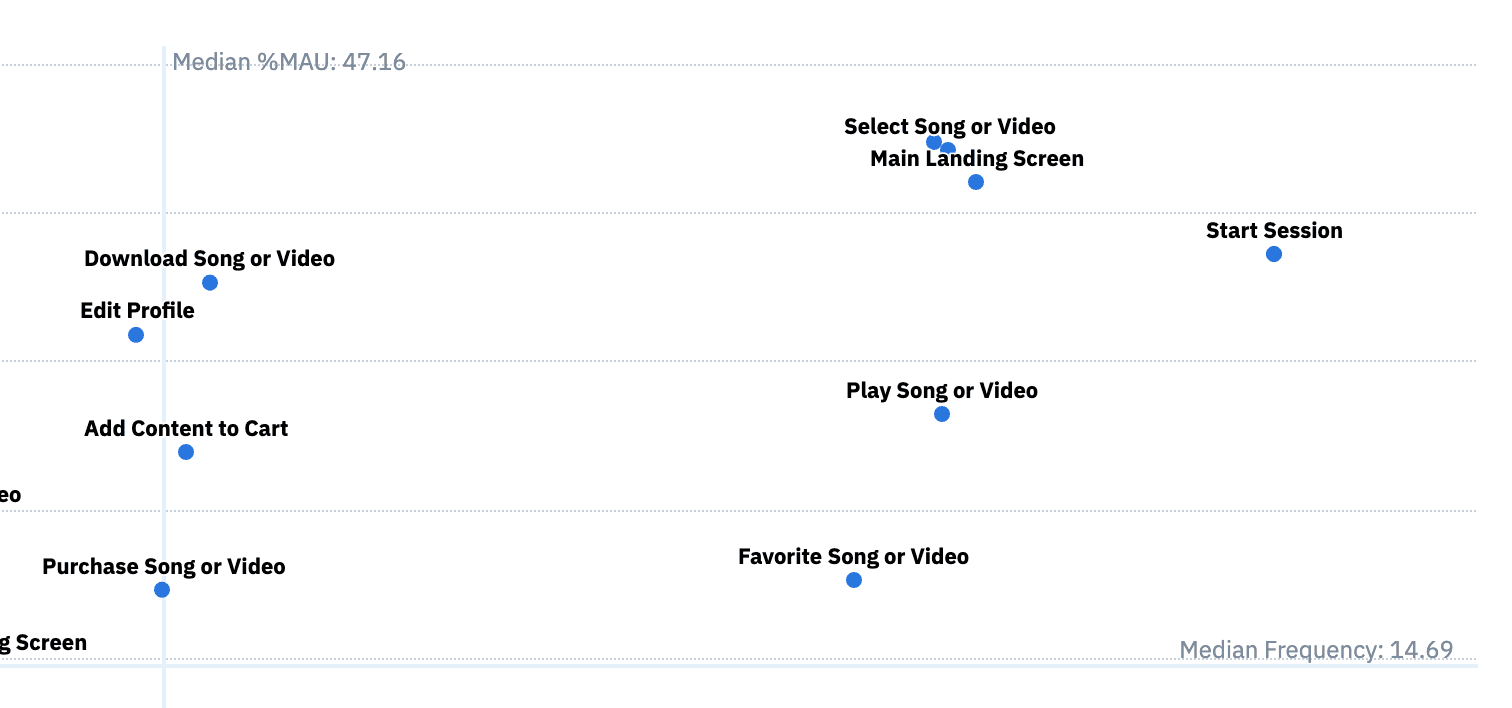
High Frequency Events with High Number of Users
The top right corner displays events performed with high frequency by a high number of users. These are likely core features or events in your product and are representative of what a lot of people are doing in your product most of the time.
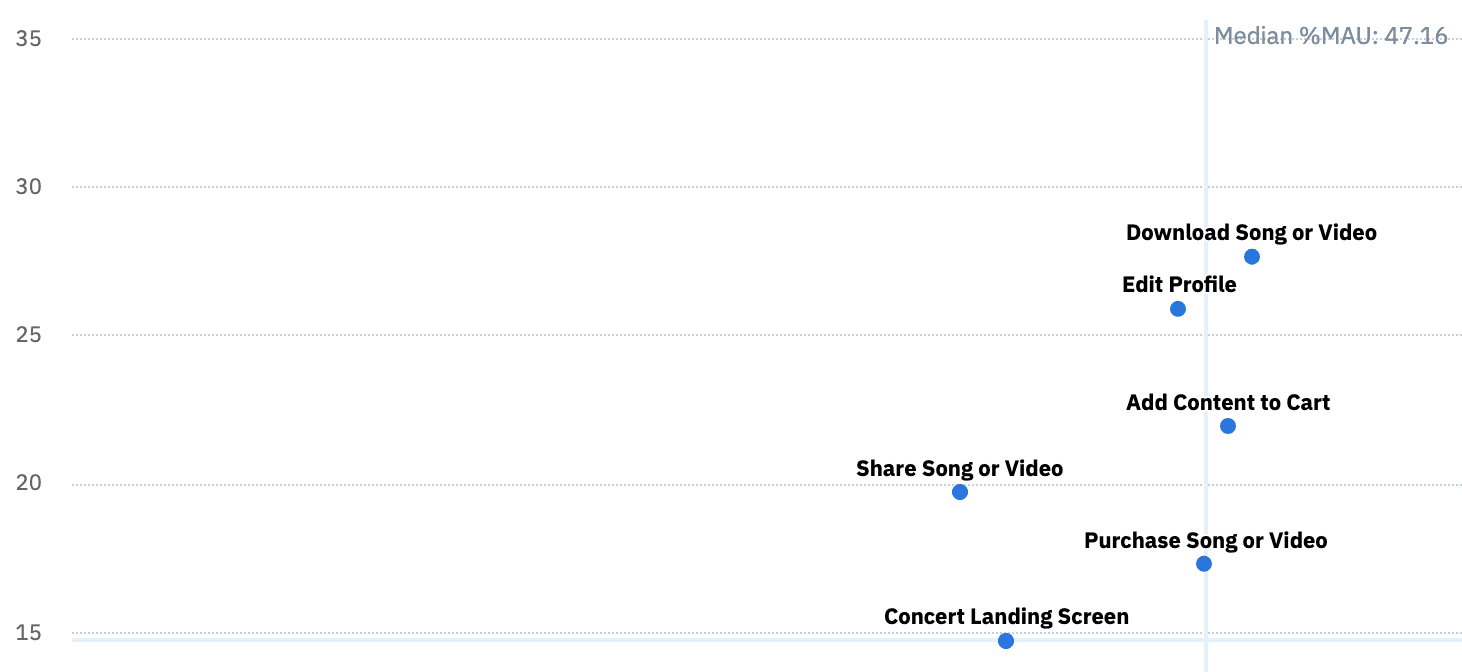
High Frequency Events with Low Number of Users
The top left corner shows events fired with high frequency by a low number of users. These could represent power features that a small subset of your users find a lot of value in. Consider ways to improve this feature and make it more accessible to the rest of your users so you can shift these data points to the more desirable top right corner of the matrix.
Low Frequency Events with High Number of Users
The bottom right corner highlights events performed with low frequency by a high number of users. These could be features many users think are useful, but only use once or twice. They could also be one time events, all of your users fire at least once. For example, creating an account or finishing an onboarding tutorial.
Low Frequency Events with Low Number of Users
And lastly, the bottom left corner demonstrates events performed with low frequency by a low number of users. These are events or features that you may want to either improve or deprecate.
Improving Feature Adoption
Now that we’ve effectively measured feature adoption, what can we do to improve it? Some of those lower performing features, perhaps we can deprecate those. And some of those hovering in the middle, let’s iterate on those so we can move those to the top right quadrant. And then you’ll be more efficient with your time, and user engagement will improve a whole lot faster.
In just one click, we’ve been able to discern what features have been performing the best and what features could use a little bit more improvement. Imagine what you could do with a few more clicks. Try the Engagement Matrix report yourself in the Amplitude demo, and see more 6 Clicks strategies at amplitude.com/6clicks.

Patrick Hammond
Former Senior Solutions Consultant, Amplitude
Patrick Hammond is a solution consultant and product specialist with over 12 years of business intelligence and product analytics experience. His passion is helping customers solve business challenges with data insights. He was formerly senior solutions consultant at Amplitude.
More from Patrick


