How Metaphor Uses Amplitude to Fuel Product Innovation
Explore how startup Metaphor uses Amplitude to scale quantitative insights, drive product innovation, and more.

Even teams with sophisticated data systems often struggle to harness the full potential of their product data. At LinkedIn, Pardhu Gunnam, Mars Lan, and I experienced this firsthand: We faced significant challenges in using data despite an advanced data infrastructure. To solve this, we built DataHub, a tool to help teams discover, monitor, and manage complex data. DataHub quickly became critical to LinkedIn, which eventually open-sourced it.
When we open sourced DataHub, companies like Expedia, Saxo Bank, and Peloton adopted it internally. Seeing the impact DataHub had, we wanted to help more companies unlock the promise of their data. So, in 2020, Pardhu, Mars, and I founded Metaphor. Metaphor is the AI-powered social data catalog platform that meets team members where they are and integrates with Slack, Microsoft Teams, and Chrome. It empowers organizations to manage and use their data intuitively, making it accessible even to non-technical team members.
Over the past few years, Metaphor has raised over $10 million from investors like Andreessen Horowitz, Amplify Partners, and Point72 Ventures. We’ve also grown our team to more than 15 employees, all driven by our mission to democratize data across companies.
Digital analytics are essential to developing an innovative product like Metaphor. We chose Amplitude initially because it was easy to integrate with our stack, and Amplitude’s approach to privacy meant we could stay compliant even with a global customer base. We could also scale and add new customers without changing our codebase.
Beyond that, the Amplitude platform has been a key part of our stack that helps us grow—fellow startups will know there’s not a lot of slack to make poor decisions or waste time, so robust analytics is essential. Here are four ways we use Amplitude to drive innovation and move fast at Metaphor.
1. Improve our AI search engine with custom event tracking
Amplitude’s ability to build custom events from combinations of other events helps us understand how users interact with Metaphor.
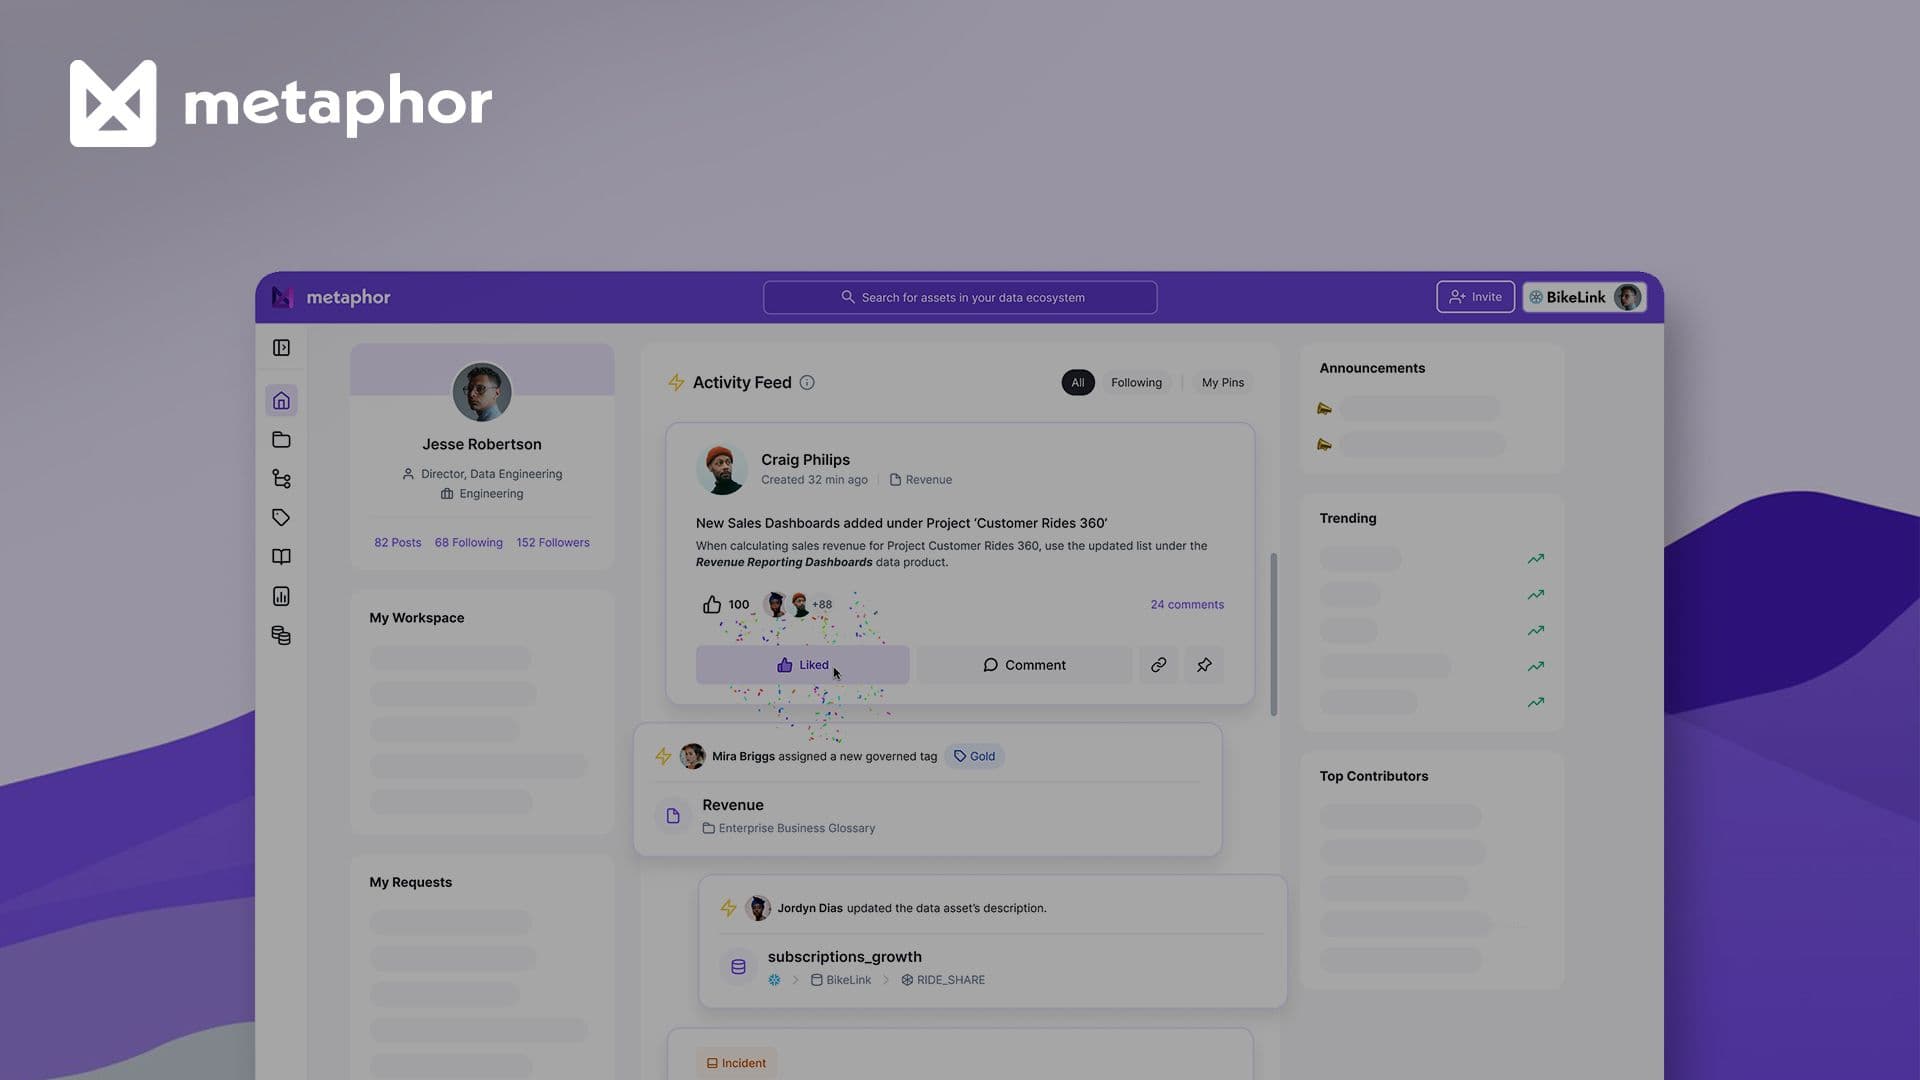
A key part of the Metaphor product is our AI-powered search engine. Users can ask for information in natural language to find out about data in their organization.
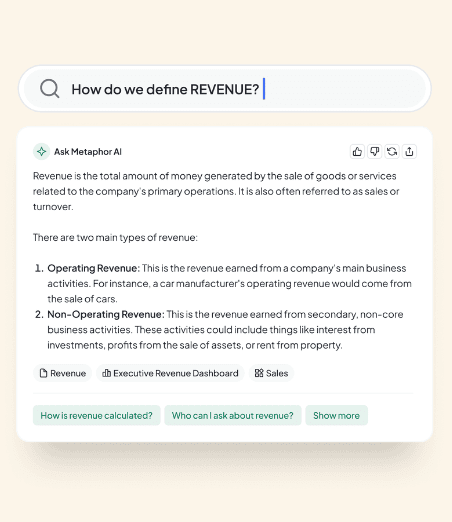
A search result in Metaphor with links to relevant dashboards.
While many organizations are fine with tracking standard metrics like click-through rates, that doesn’t work for Metaphor. Users can interact with our search results in multiple ways, such as expanding descriptions or viewing metadata like ownership information without needing to click through to another page.
With Amplitude, we could create custom events based on composite metrics that capture various interactions in the search results. This custom tracking gives us the information we need to improve the engine.
For example, knowing the position of interactions within search results is highly informative. If users frequently find relevant information beyond the first few results, it signals the need to tweak our search algorithms. We collect metrics on natural language search responses, analyzing their accuracy and relevance to continually improve the search experience. Tracking metrics in Amplitude also means we have a historical baseline against which to compare any product changes.
2. Scale qualitative feedback with Session Replay
Understanding how users interact with a product usually requires time-consuming individual interviews. With Session Replay, we can observe user behavior, helping us understand how they use our product from within Amplitude. We can still follow up and chat with customers 1:1, but Session Replay means we focus on a smaller, more manageable set of users and have more context going into those conversations. As a result, our feedback cycle is more efficient, which enables us to speed up the product development process.
While quantitative data from event tracking does help us understand how people interact with the results, combining that data with replays gives us a more complete picture of how the results serve users. This feedback enables us to refine our search algorithms further and address the common issues associated with search engines, such as irrelevant results and lack of context.
Session Replay also helps us with a more standard use case—fixing bugs in our product. When an alert indicates an issue or error, we can review the exact user actions that triggered it, which is especially useful for hard-to-reproduce problems. As a result, we can quickly understand and solve product issues.
3. Supercharge product development with the engagement matrix chart
Developing new, successful features in a short time frame is crucial for a startup. We use Amplitude’s engagement matrix chart to enable quick decisions about new features.
We aim to release minimum viable products for new features as soon as possible and then track their usage in the chart. This data gives us insight into the best way to develop the full version of the feature. If a feature isn’t meeting usage thresholds, we know we need to go back to the drawing board.
An example event flow view for a music platform
For example, we created a feature enabling users to create data attributes. We discovered high usage among a small set of power users, but the majority of the user base didn’t engage with it. So we focused on building the feature for Metaphor admins, expanding it to enable them to make changes to the entire data catalog at once (like tagging several columns or contacts).
We also tried out another feature: pinning documents within the catalog. We hypothesized that users would have a set of documents they’d want to keep coming back to, and it would be useful to keep them at the top of the documents center.
We found that uptake in this feature across our user base was very low. And, unlike the create attributes feature, those who did use it only engaged with it a handful of times. Analyzing feature usage in the engagement chart enabled us to devote our resources to features with more usage.
4. Serve different product personas with cohort segmentation
Our mission to democratize data means we want technical and non-technical users to fully engage with Metaphor. To achieve this, we track metrics and sort them into cohorts, helping us understand and cater to the different needs of two main product personas.
Where we find that technical users are more engaged than business users, we develop strategies to even out the engagement. For instance, we support our business users with product guidance or adjust the product to make it easier to understand.
We also monitor engagement by analyzing the ratio of weekly active users (WAUs) to monthly active users (MAUs). The ratio helps us see how many monthly users are returning every week. By observing this trend over time, we can determine if we’re improving user engagement or if there’s a drop-off, especially as we onboard new users.
Fuel your startup with data-driven insights
Ready to make your data actionable? Explore Metaphor: The Social Platform for Data, powered by AI.
And if your startup is interested in innovating fast, making smarter decisions, and staying ahead of the competition, the Amplitude for Startups scholarship gives you free access to the Amplitude Growth plan for one year. Find out more and apply for the startup scholarship.

Seyi Adebajo
Co-Founder & Founding Engineer, Metaphor Data
Seyi is the Co-founder and Founding Engineer of Metaphor Data. Having worked in the startup space for over a decade, Seyi worked at Meta and Linkedin, prior to co-founding Metaphor.
More from Seyi


