Release Notes: October 2017
What's new in Amplitude as of October 2017.
Happy October! In this product update, you will find information on:
- New Features
- 45-Day Free Trial of Amplitude SQL
- Dashboards: Public Links
- Paste CSVs in Dropdowns and Select All
- Event Volume Quota Metrics
- Behavioral Cohorts: Property Sum
- Event Segmentation: Outlier Detection
- Feature Improvements
- Event Segmentation: Configurable Period-over-Period
- Engagement Matrix: Where and Group By Filters
- Improved Save Chart UX
- SDK Updates
- Resources
- Product Analytics Playbook: Mastering Retention
- Amplitude Online Seminar Series
New Features
45-Day Free Trial of Amplitude SQL
(Enterprise Only) All Enterprise customers now have access to a 45-day free trial of our new product add-on, Amplitude SQL. Amplitude SQL allows you to write custom SQL queries against Amplitude data without the need for a managed Redshift cluster. Analyses can be saved, shared, and dashboarded just like all other chart content within Amplitude! Free Trial Details:
- The free trial will be available to all Enterprise customers from October 9th, 2017 to November 22nd, 2017.
- Customers will be able to query data that has been collected as of September 25, 2017. No data has been backfilled for this free trial.
- The feature can be accessed through a new chart type called “Amplitude SQL” that is available in the Create Chart dropdown.
- For further information on how this feature works, see our Learning Center article here.
Dashboards: Public Links
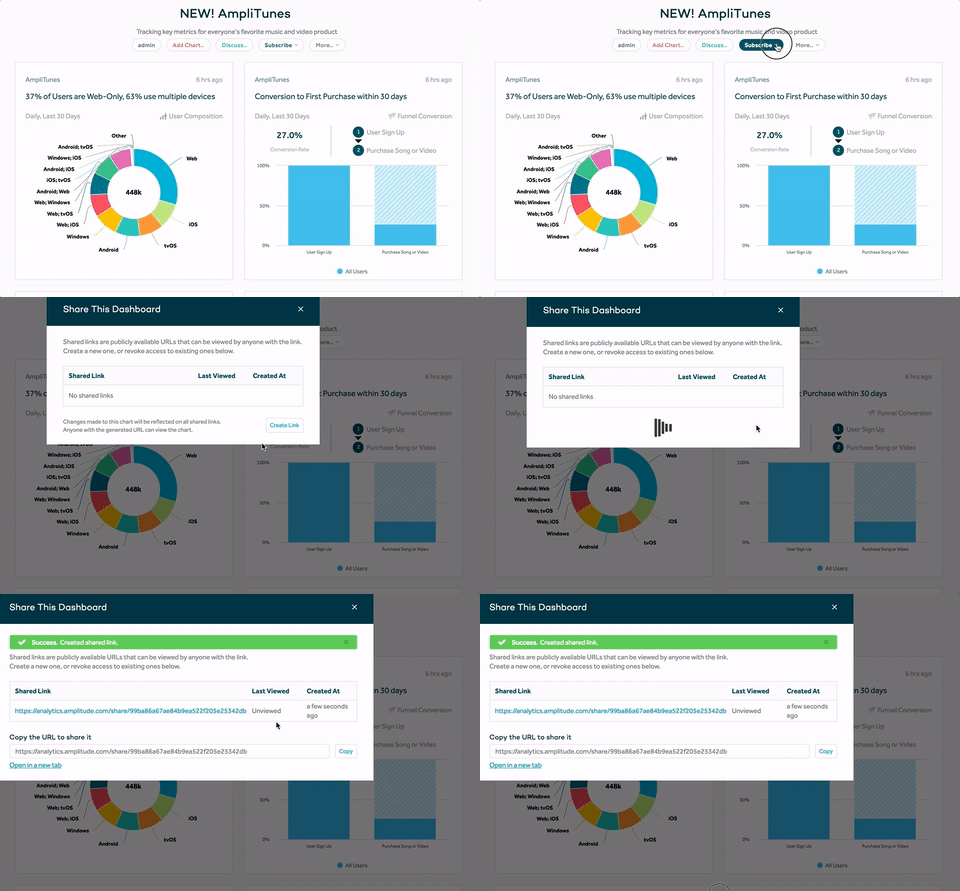
(Enterprise Only) Previously, you were only able to create shareable links to charts in Amplitude. We have added the ability to create public links to dashboards you own now as well. You can then send this public link to anyone and they are able to view just the data on the dashboard without needing an Amplitude account. The dashboard is dynamic and will automatically update to the most recent information. To create a public link for your dashboard, click the “Subscribe” button at the top of your dashboard.
Event Volume Quota Metrics
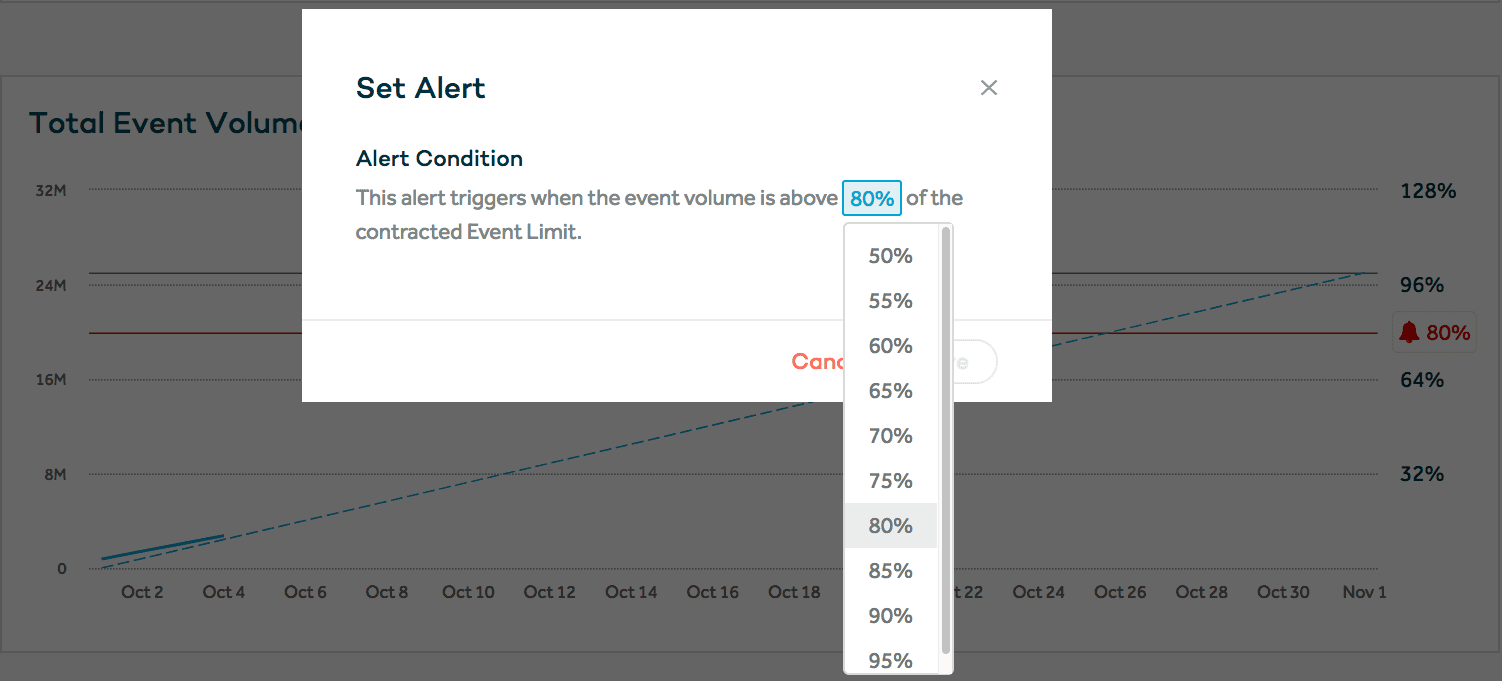
(Enterprise Only) Another common pain point for our customers was that there was no way to easily be alerted if they were about to exceed their event volume quota. Now, Plan Admins can set alerts that will trigger email notifications to all admins in an organization if the current event volume has reached a certain percentage of the overall event volume limit. To read more about this feature and how to set up event volume alerts, see here.

Behavioral Cohorts: Property Sum
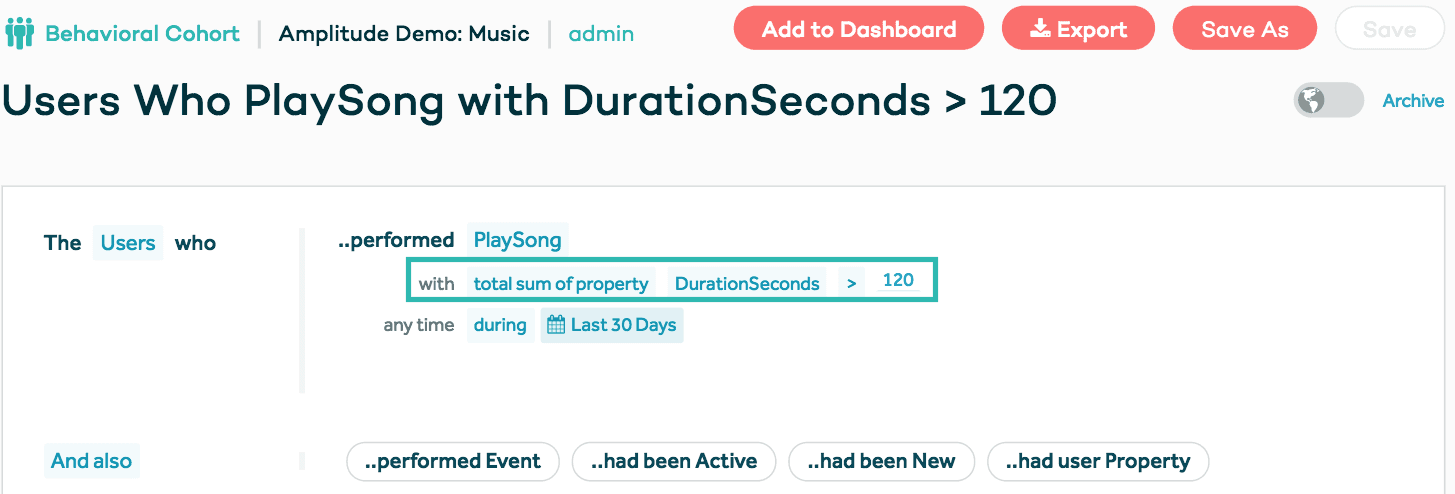
(Enterprise Only) You can now create Behavioral Cohorts based off of the total sum of a certain property on an event. This provides you with even more flexibility in creating cohorts of users to analyze further. For example, here we are creating a cohort of users who played a song that was longer than 2 minutes in the last 30 days. To learn more about Amplitude’s powerful Behavioral Cohorts feature, see our documentation here.
Event Segmentation: Outlier Detection
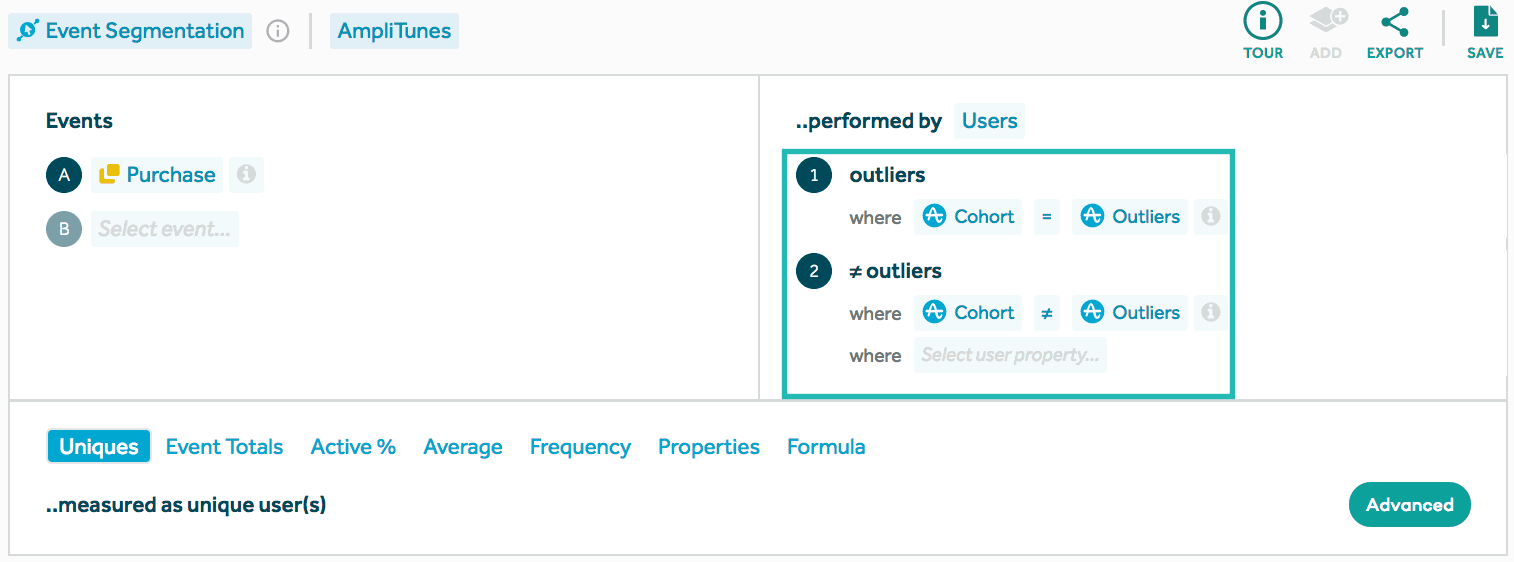
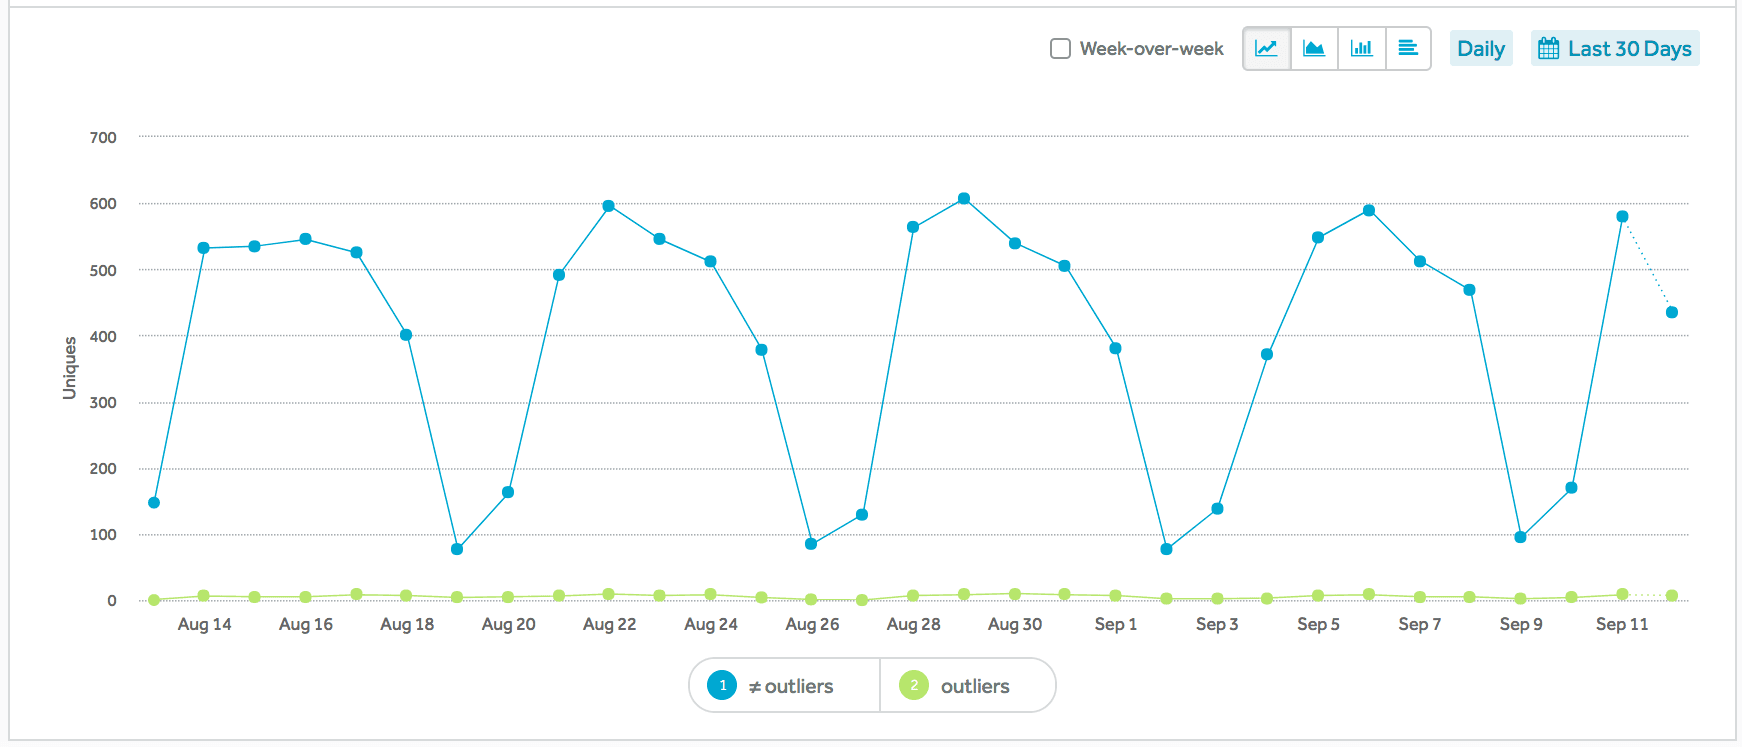
(Enterprise Only) In Event Segmentation charts, you can now use Amplitude’s outlier detection feature to identify users who are outliers in your data sets. To calculate outliers in your chart, first set up your chart by picking the events and the metric you wish to calculate outliers for. After you have set up your chart, select ‘[Amplitude] Cohort’ = ‘[Amplitude] Outliers’ in the right segmentation module of the chart control panel. This will give you a segment that contains all users who are outliers. The resulting chart will show you a segment created from your outlier users, which you can then use Microscope to create a cohort out of those users and analyze them further! To read more about how this feature works and is calculated, check out our Learning Center article here.
Paste CSVs in Dropdowns and Select All
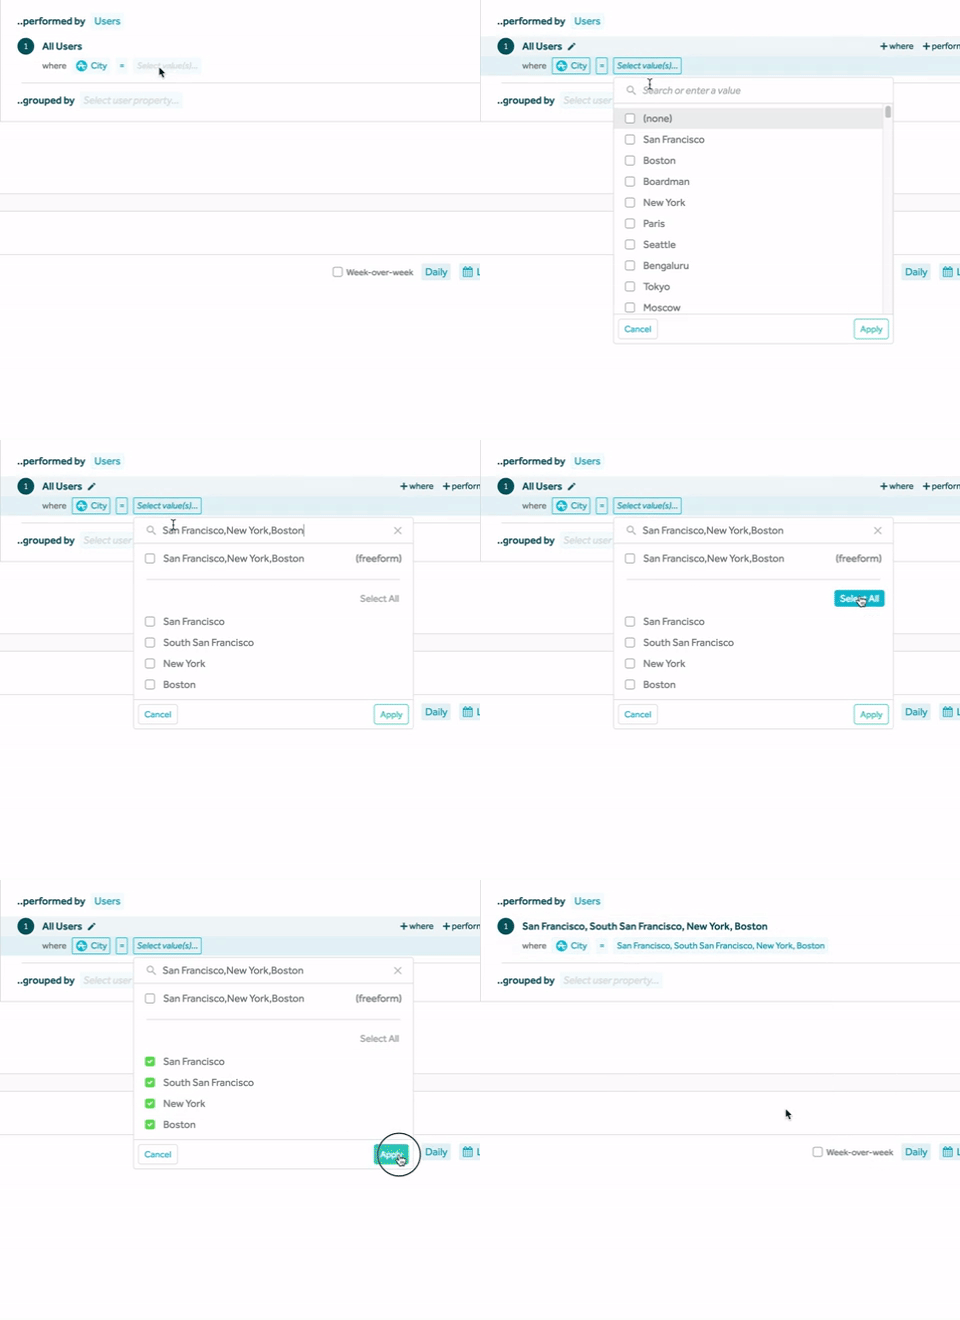
Many of our customers requested the ability to paste CSVs into dropdowns and have each individual value selected. In the spirit of solving customer pain, our Product Development team has implemented this feature! You can now paste CSVs into dropdowns and choose to either treat the entire string as one value or have the chart select each individual value. You can also choose to select only some of the values or select all.
Feature Improvements
Event Segmentation: Configurable Period-Over-Period
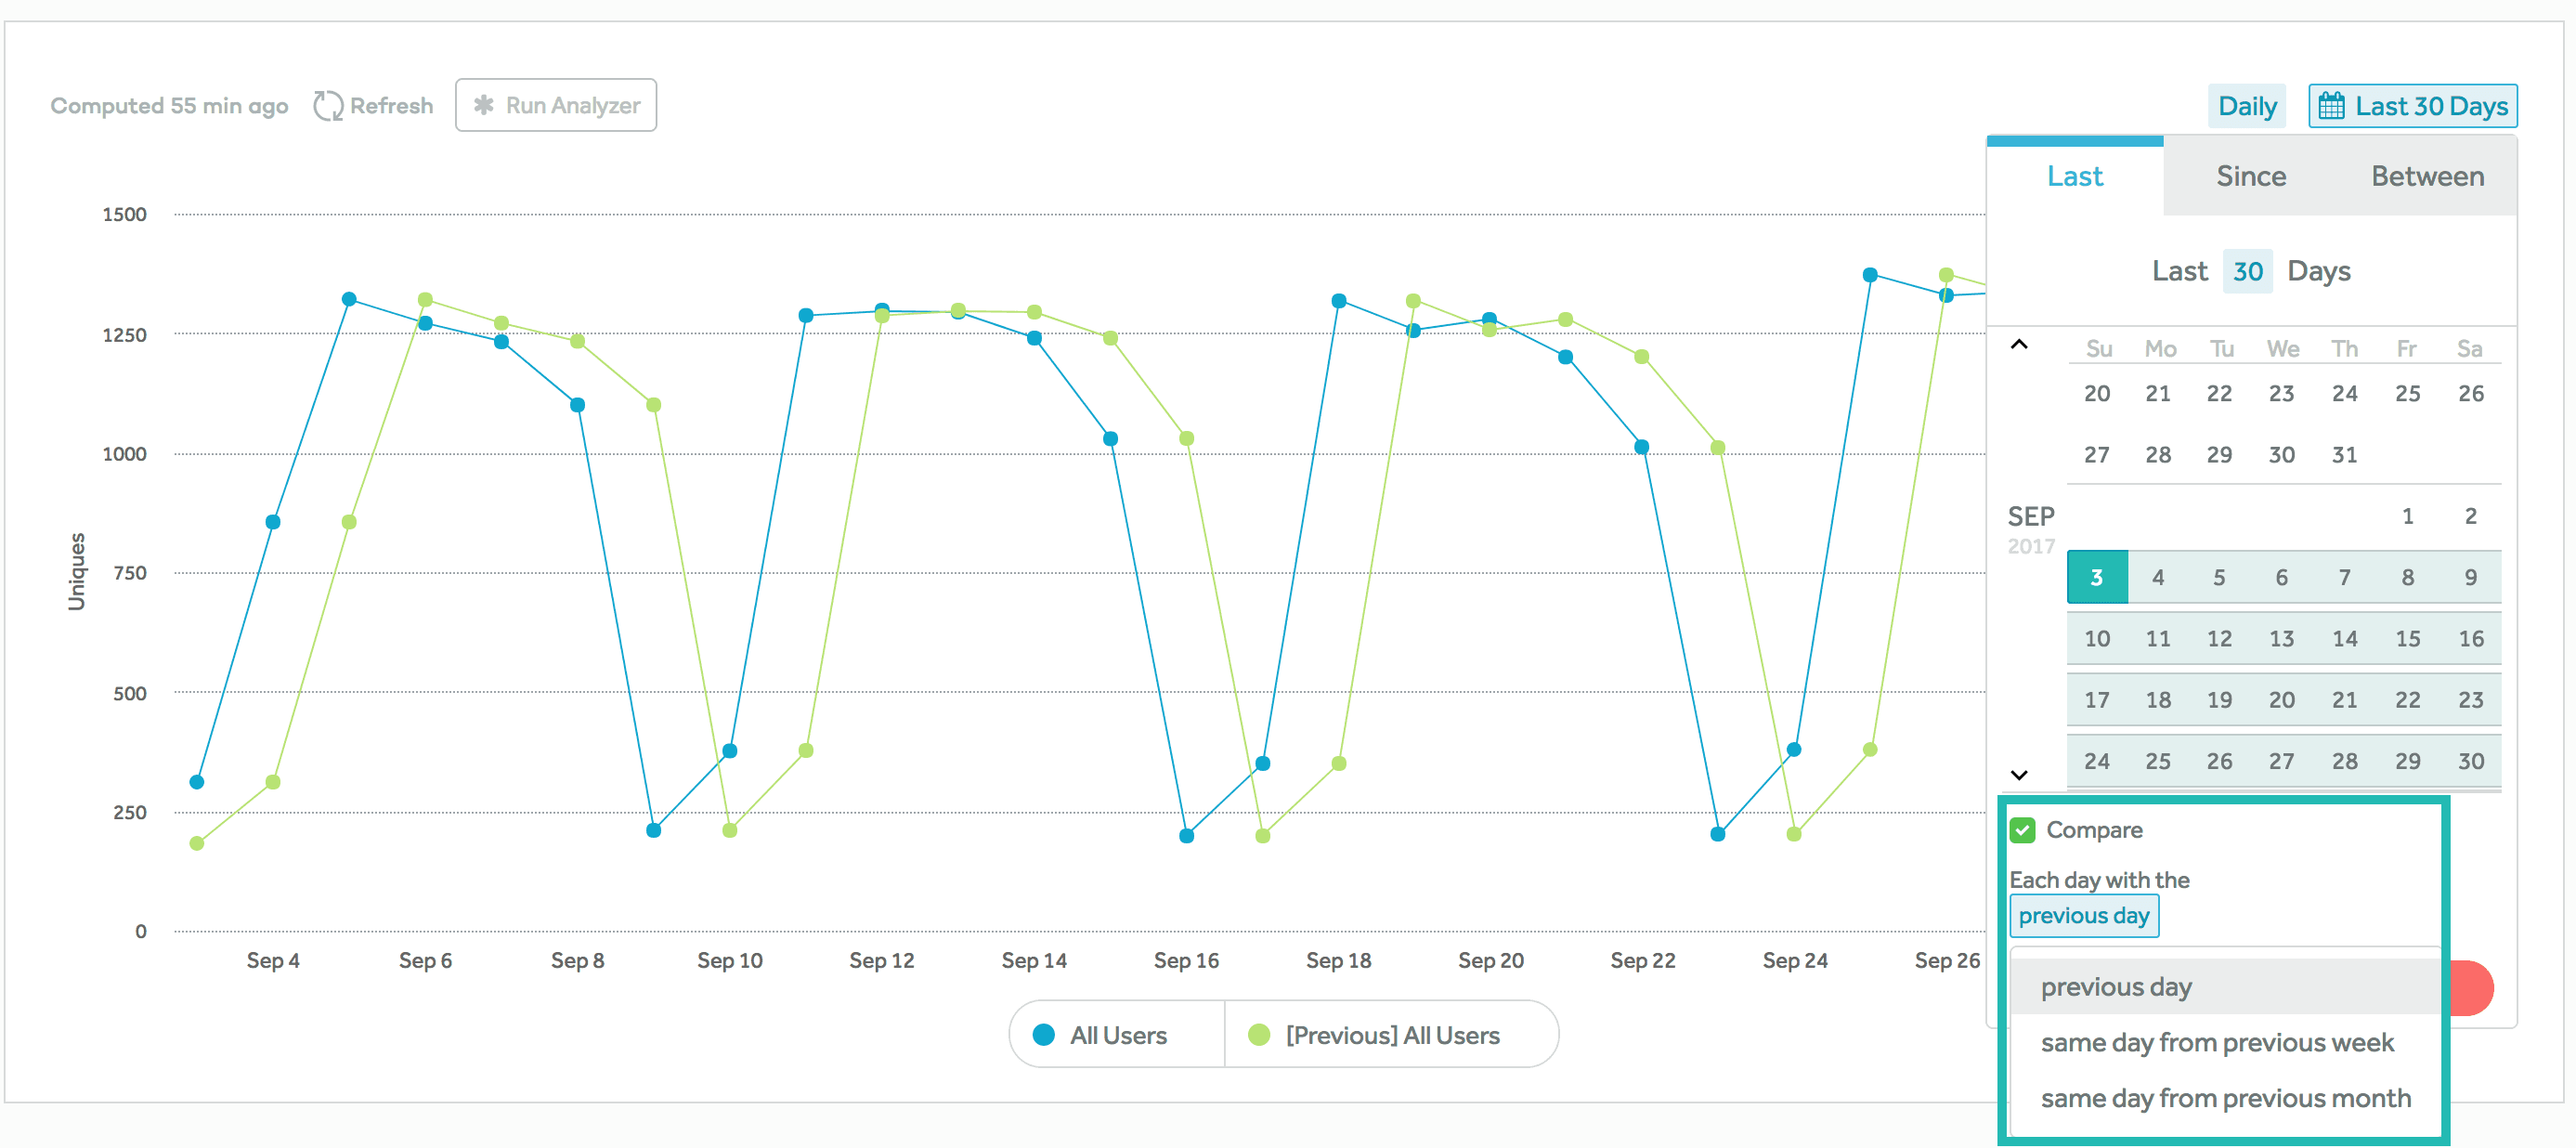
(Enterprise Only) We’ve made our period-over-period comparison feature more flexible now by allowing users to configure the interval you are comparing the current data point with. You can now select if you want to compare each data point to the previous interval selected or the same interval from the previous day, week, month, or year. For example, the following chart compares active users on Tuesday, September 19 (blue segment) to the previous day, active users on Monday, September 18 (green segment):
Engagement Matrix: Where and Group By Filters
(Enterprise Only) Previously, you were not able to segment events shown in the Engagement Matrix with where and group by clauses. We’ve since added this functionality so that you can drill down into events you are interested in with more granularity! To read more about this feature, read our Learning Center article here.

Improved Save Chart UX
We have improved the save chart UX so that it is now much clearer that your chart is currently in an unsaved state. When you make edits to your saved chart, a butter bar warning will appear informing you that you must save your edits in order for those changes to persist.

SDK Updates
We’ve made quite a few improvements to our SDKs recently! As a best practice, we highly recommend that you always update to the latest version of our SDKs.
Amplitude-JavaScript v3.7.0
- Since v3.4.1
- Supports clean NPM module loading e.g. const amplitude = require(‘amplitude’); or import ‘amplitude’ from ‘amplitude-js’;.
- SDK is now a proper UMD module. Supports RequireJS with r.js builds now.
- Added setSessionId(sessionId) method. Note that this is not recommended unless you really need to do so. Please update the load snippets on your website to the latest version.
- Added support for Bower. Install using bower install amplitude-js.
- Switched from webpack to Rollup for building the SDK.
Amplitude-Android v2.15.0
- Since v2.14.1
- Updated to latest version of OkHttp3 (3.9.0).
- Amplitude-iOS v4.0.1
- Since v3.14.1
- Minimum required iOS version is now 7.0.
- Removed deprecated methods, fixed warnings in Xcode 9, adding support for iOS 11.
- Migrated setup instructions and SDK documentation in the README file to Zendesk articles.
- Since v3.14.1
Resources
Product Analytics Playbook: Mastering Retention
In February, we released the Product Analytics Playbook, Volume 1: Mastering Retention. This first volume provides a thorough 155-page guide on how to use data to make better product decisions and improve user retention. You can download the full volume online.
Amplitude Online Seminar Series
Join one of our interactive online seminars! Register here for New User Trainings, chart-specific Deep Dives, and Instrumentation Trainings. _Questions or comments? We’d love to hear what you think if these features. Leave a comment below or get in touch at contact @ amplitude.com _

Jessica Chiu
Director, Global Technical Support, Amplitude
Jessica Chiu leads the corporate Solutions Architect team at Amplitude. Her team helps lead customers through Amplitude implementations to get up and running quickly and successfully.
More from Jessica


