Opportunity Solution Tree: A Visual Tool for Product Discovery
Learn how to use the Opportunity Solution Tree framework to create products customers crave and generate more revenue.

Originally published on May 31, 2023
- What is product discovery?
- Why might product discovery run into adoption challenges?
- What is an opportunity solution tree (OST)?
- How does an opportunity solution tree improve discovery adoption?
- How do opportunity solution trees work?
- When to use an opportunity solution tree
- A real-world example of an opportunity solution tree
- The interaction between OSTs and product strategy
- Aligning and collaborating with stakeholders through OST
- Connecting OSTs to analytics
For product teams to capture value for their businesses, they must discover, understand, and prioritize the needs of their customers; only then can they craft effective solutions that solve pain and unlock customer willingness-to-pay.
One way to drive this product discovery work is to use a mental model called an Opportunity Solution Tree (OST). To help product teams effectively discover and capture value, we’ll walk through what an opportunity solution tree is, how to use one, an example of an OST, and how to connect your OST to analytics and experiments.
- Product discovery combines qualitative insight and quantitative analytics to determine high-value customer needs to be solved.
- Opportunity solution trees help product teams focus on key areas of customer need:
- Metrics constrain discovery to business-relevant areas
- Opportunities identify customer pains to solve
- Solution ideas provide hypotheses for creating customer value, and
- Tests and experiments validate or disprove solution ideas.
- By connecting the visual framework of opportunity solution trees to an analytics and experimentation stack, product teams can ship value more quickly.
What is product discovery?
Product discovery is the set of processes that teams use to unveil and clarify the needs of their customers. By understanding the kinds of pain points that customers experience, we can prioritize the kinds of solutions that will create value. Product discovery is a crucial subset of the overall product development process, as it helps product teams make informed decisions about which product ideas to pursue and which to set aside.
Product discovery includes customer interviews, customer shadowing, surveys, customer feedback, and prototype testing. Product discovery should happen regularly and frequently. In other words, discovery shouldn’t just happen on a quarterly basis; rather, it should take place every day, within every product pod, in small ongoing increments.
Customer-focused product discovery enables us to maximize our understanding of what creates value for customers, and to update our approach in real time as we continuously learn.
But, while product discovery is key to converting customer needs into business value, this crucial work is sometimes criticized or deprioritized by executives and cross-functional stakeholders. Let’s dive into why this might happen.
Why might product discovery run into adoption challenges?
While most leaders and stakeholders won’t object in principle to product discovery, many product teams still regularly run into adoption challenges with their product discovery practices.
This is because many leaders are uncomfortable with undirected discovery; that is, too frequently, product teams will embark on a “discovery safari” to “take in the sights,” which causes leaders to question whether this research is sufficiently targeted to drive business value.
Specifically, leaders want to have answers to the following kinds of questions:
- How do we know that discovery will move a business metric that matters?
- How long is this discovery work going to take, and how much does it cost?
- How do we know that this investment will pay off?
In our coaching practice at Product Teacher, we find that many product managers initially fail to address these questions upfront, causing unnecessary friction and tension. We’ve found that by introducing the opportunity solution tree to our clients’ working processes within their organizations, product teams are significantly more likely to succeed in advocating for customer-driven discovery.
So, let’s dig into what opportunity solution trees are, and how they deliver value across all parts of the organization.
What is an opportunity solution tree (OST)?
The opportunity solution tree framework was initially designed by a Stanford University design professor. In 2016, Teresa Torres, founder of Product Talk, applied this framework to product discovery processes.
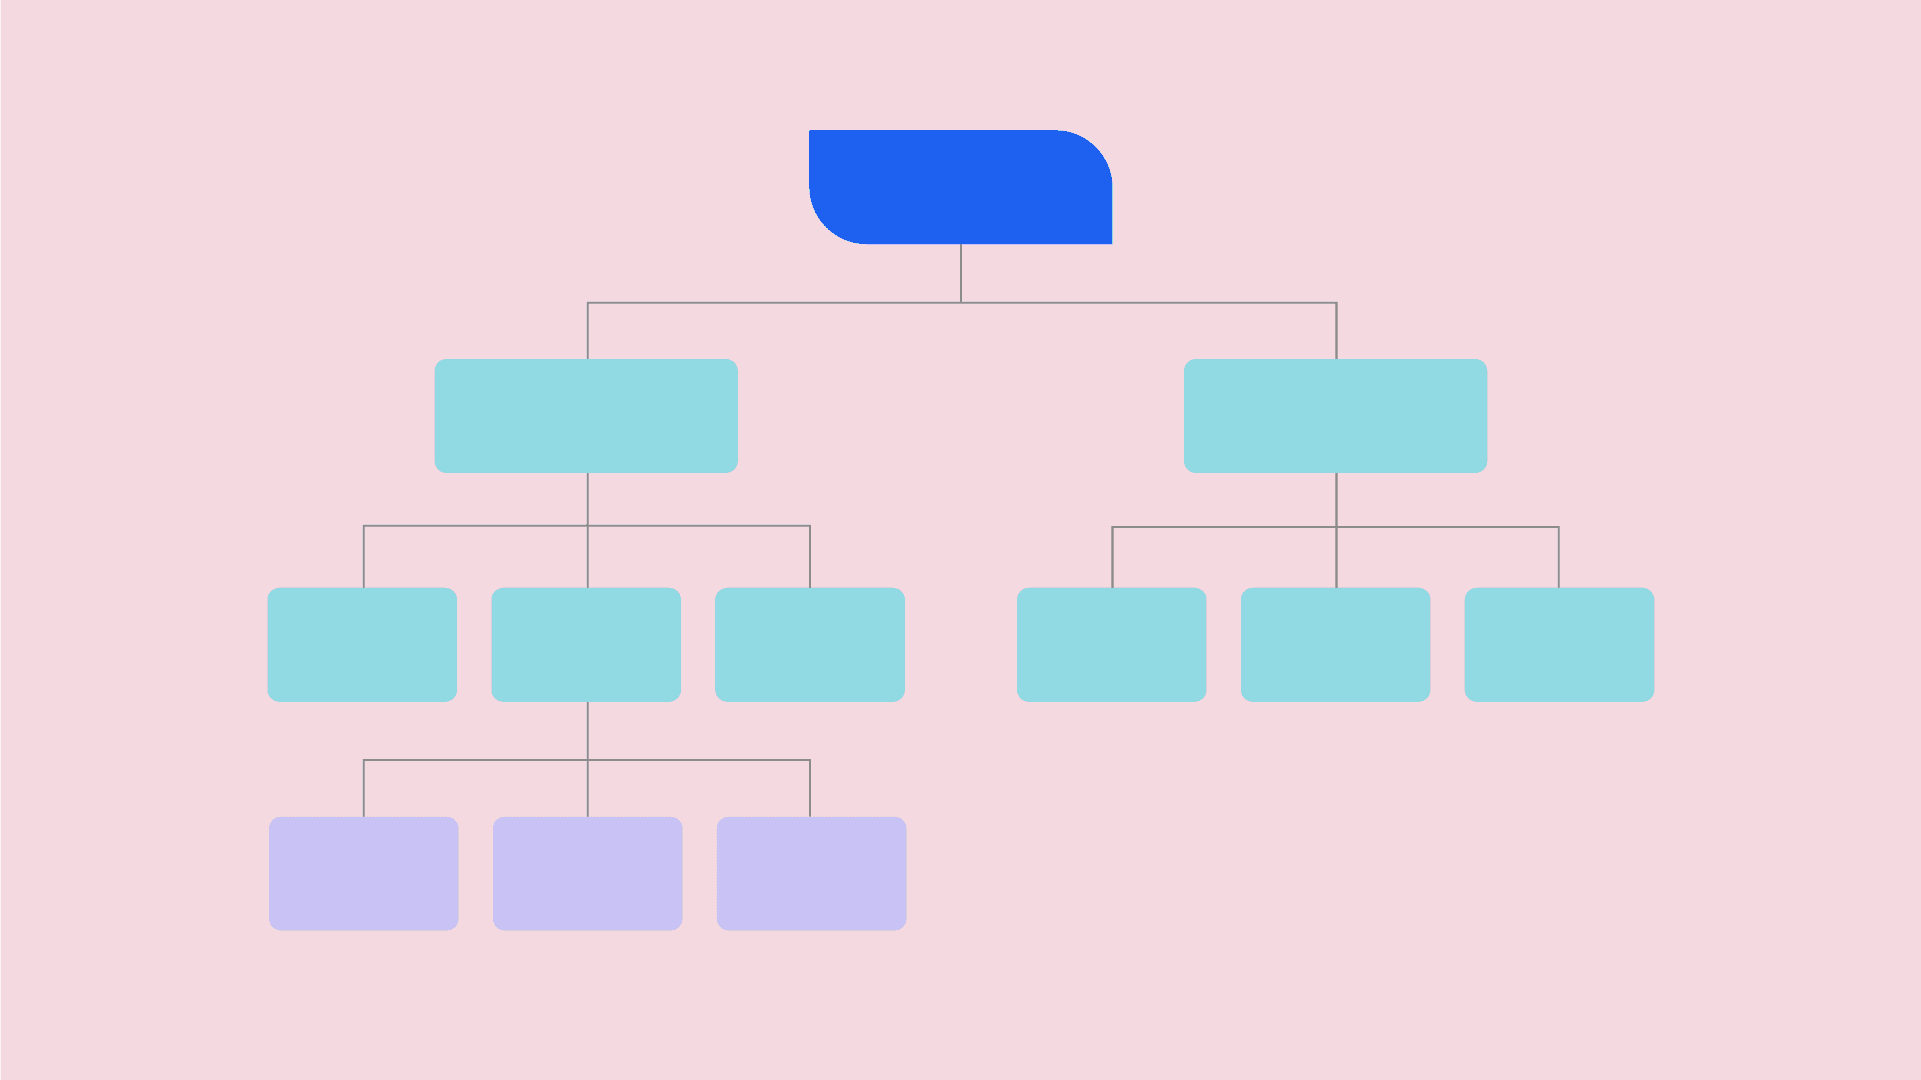
Every opportunity solution tree contains four key components:
- Metric: the business-relevant metric that guides discovery
- Opportunity: the pain points that customers have
- Solution ideas: the possible ways that we as a product team can address customer pain
- Tests: the experiments we can run to validate or invalidate our solutions, enabling us to de-risk our features and swiftly ship iterative value
Below is an example of what an opportunity solution tree might look like. We’ve color coded metrics blue, opportunities green, solution ideas yellow, and experiments orange. Don’t worry about reading the text for each. We’ll dive deeper into this example in a later section.
Why did Torres create the opportunity solution tree model? She did so based on her observations in training product teams through product discovery. She noticed that teams needed a visual structure for guiding their discovery efforts, aligning proposed solutions vs. discovered customer pains, and securing buy-in across departments.
Torres drew on a technique taught by Stanford professor Bernie Roth. Professor Roth asked how people’s desired solutions connected to their underlying needs and pain points, and then asked participants to conduct “divergent solutioning” to come up with different potential solutions for solving the same pain points.
By framing this tree-like set of questions as a visual graph of an opportunity solution tree, Torres found that product teams were much more likely to advocate for solutions that truly addressed the pain of their customers.
How does an opportunity solution tree improve discovery adoption?
Crucially, the opportunity solution tree visualization does the following for product managers, executive leaders, and cross-functional stakeholders:
- Establishes a business-critical metric as a focusing lens for product discovery
- Focuses efforts on solving customer pain rather than building a checklist of features
- Converts discovery insights into “opportunity areas” to invest in
- Shifts the dialogue away from “feature delivery” towards “rapid experimentation”
- Ties experiments back to customer pain and iteration alongside customers, rather than non-interactive internal brainstorming
Earlier, we mentioned that leaders are keen on understanding the business value that product discovery might bring, and the potential costs or risks associated with product discovery. By framing discovery into business-relevant outcomes, product teams can ease fears around whether product discovery insights will be actionable or not.
And, with an opportunity solution tree in place, teams are much less likely to over index on a given solution. Instead, they’ll take the time to ask what opportunity or customer pain they’re solving, and use this broader view to innovate and come up with higher-impact, lower-cost solutions that ultimately create more ROI.
The visual structure of the opportunity solution tree clearly reduces the priority of any given feature as the “end result,” and instead strengthens the message that moving the business-relevant metric is what truly matters.
Therefore, product teams that successfully introduce opportunity solution trees to their orgs tend to find that stakeholders are much more willing to run with experimentation, rather than focusing on a laundry list of features with deadlines.
How do opportunity solution trees work?
Let’s break down each of the four key components of opportunity solution trees, and discuss best practices for each.
Metrics
The metric for your opportunity solution tree should be aligned with a KPI (key performance indicator) from your OKRs (objectives and key results) so that your work is directly tied to business success. This metric is the lens through which you’ll conduct your product discovery.
In other words, any customer conversations or product discovery efforts that would not move the metric should not be considered. Only the initiatives and efforts that have a real possibility of changing the metric should be actively investigated.
But how do we select a good metric? Good metrics should balance the tension between “business success” and “proximity to product.”
If the metric is too distant from the product (e.g., companywide revenue or companywide profits), then the product team will struggle to drive any sort of real focus in their discovery efforts. Theoretically, any initiative could be justified as a way to increase revenue or cut costs.
And, if the metric is too close to the product (e.g., feature click rates), then the team is over indexed on a specific solution, and not focused enough on customer pain or investment opportunities that will move the needle for the business.
A good metric should track that value has been created for customers, and that value has been captured for the business. Examples might include time on platform, or monthly active users.
Opportunities
Just because we know what metric we’re going after, doesn’t mean that we know what pains our customers are experiencing. Many times, waterfall-oriented teams come up with ideas “inside the four walls of the company” without learning from customers about what their pains are.
Opportunities need to create new value for customers, while also enabling the company to capture that value in the form of usage, revenue, referrals, and other relevant business drivers.
Product teams can leverage any of the below to identify opportunities:
- Inbound customer feedback
- Outbound 1:1 interviews
- Outbound surveys
- Product data analytics
- Discussions with internal stakeholders (e.g., support, marketing, sales)
To make this concept more concrete, let’s consider Gmail, which is an email inbox provided by Google.
An opportunity is not “I want a better spam filter.” This is a solution idea, and we’ve fallen for the trap of listening for what to build rather than which pains to solve.
When we consider the feature idea “I want a better spam filter,” this might actually point to a variety of different underlying user pains, such as:
- It takes me too long to find a specific email
- I don’t like receiving emails from people I don’t know
- I’m frustrated that email notifications keep interrupting me during presentations
As you might imagine, the set of possible solutions to tackle the opportunity of “finding an email faster” vs. the set of possible solutions for the opportunity of “prevent emails from interrupting me” are wildly different from one another. While it’s true that they share the same feature idea of “I want a better spam filter,” that doesn’t mean that a spam filter is the best way to achieve either objective.
That’s why it’s crucial for us to conduct qualitative customer interviews and quantitative analytics to understand the true pain that’s being expressed behind any given feature request.
Furthermore, any time our colleagues propose features, we should not take the feature at face value. Instead, we should ask “what underlying pain does this feature request solve for a customer?” From there, we can then consider the full set of solution ideas, many of which might be more satisfying, easier to build, and easier to maintain than the initial proposed idea.
Solution ideas
Once you’ve selected an opportunity, partner with design and engineering to identify a variety of possible ways to attack the customer problem:
- Be divergent and generate as many ideas as you can
- Don’t be afraid of “bad” ideas because they can spark good ideas
- You’ll converge on “what to ship” later during experimentation
Design can help you consider how people currently address this problem in the real world. They can assess how competitors solve this problem through their products, and they can also identify how customers use substitutes, alternatives, or manual processes to alleviate their pain. This 360-degree view enables us to come up with much better ideas for solutions.
Engineering can help you determine whether this customer pain can be abstracted into a broader pain that encompasses multiple related use cases. In some instances, many pains might seem completely unrelated at a user level, but might be easily solved in one fell swoop at a system level.
For example, say that you’re in charge of a project management platform like Asana or Trello. Some users want to know which tasks are at risk of missing their deadlines. Some users want to know whether some assignees are overburdened with work. Some users want to understand which departments made the most task requests. And some users want to know which groups have finished the most tasks.
These all seem wildly separate from a user pain perspective, but engineering can identify that the underlying user pain is “we can’t easily group or filter things together based on attributes that we already have about each task.” And, from that lens, engineering can propose a highly flexible sort-and-filter system that would not have been suggested by any single user.
Finally, don’t be afraid to solicit feedback from cross-functional partners! After all, they may have feature requests readily available for you to consider.
But, as we mentioned before: when engaging with cross-functional feedback on solution ideas, you’ll need to ensure that these actually fit the chosen opportunity area that you’ve prioritized. You don’t want to simply tackle the solution ideas that will help close a deal or satisfy a particularly vocal customer. You want to deliver the most possible value, using the fewest resources necessary, in the fastest possible time.
Tests & experiments
To achieve outstanding ROI, solution ideas should not be fully shipped as-is, because that’s expensive and high-risk. Within each solution, we have multiple underlying assumptions–and, we should test each of these assumptions through well-designed low-effort experiments. This approach reduces risk, drives learning, and ultimately increases ROI.
For example, say that you’re in charge of a contract software platform like Ironclad, and you’d like to ship functionality that automatically plugs in relevant contract terms based on AI/ML. Rather than building the entire recommendation system in one swing, you’ll want to de-risk this initiative by breaking it down into smaller pieces.
One assumption might be “we believe that lawyers want to review the suggestion before inserting it into the contract.” If so, then the UI that we deliver should let lawyers see the contract clause that’s being suggested, and give them the ability to accept or reject.
But if our assumption is “lawyers are comfortable with software filling this in for them, and having to look at dozens of obvious suggestions is a waste of their limited time”, then we shouldn’t build this UI.
How would we test this? We could run a “person in the machine” test with a lawyer to see whether they’re comfortable with contract clauses being inserted without them looking at it.
Another assumption we might need to test is “contract clauses are consistent across different kinds of contracts.” This might not be true. Different contracts may require clauses to be edited before inserting. In that case, we’d also want to run an experiment here.
For each experiment, we need to make sure that we’ve done the following:
- Identify all of our implicit and explicit assumptions about our customers, our competitors, and the technology that we’re using
- Create upfront thresholds for “how much the metric should move” for us to say that it was successful
- Draft predetermined next steps based on experiment performance, covering what you’ll do if your assumptions are validated, as well as what you’ll do if your assumptions are disproved
How do we prioritize the different experiments that we want to run against our solution ideas? Generally, we want to prioritize with these three factors in mind:
- Which experiments will move the overarching OST metric the most?
- Which experiments will de-risk the biggest assumptions?
- Which experiments will cost us the least time and effort?
When to use an opportunity solution tree
The point of an opportunity solution tree is to organize the potential areas of opportunity where the company can invest; in other words, it categorizes viable pain points that we can solve for our customers.
Therefore, opportunity solution trees should be used as an input into any sort of roadmapping exercise, whether we’re building roadmaps at a quarterly level or an annual level. After all, we can’t build effective roadmaps if we don’t know which pain points our customers have.
Opportunity solution trees are also quite valuable for framing product proposals, especially when we plan on presenting these proposals to executive teams. By ensuring that we’re aligned with our executives on the key metrics that matter, and by providing a space to collaboratively discover the different opportunities available to us, we can more effectively iterate through possible solutions and ship more value with less effort and less time.
Many product teams run regular product strategy offsites. The next time you attend a strategy offsite, consider pitching “opportunity solution trees” as an actionable next step for all attendees after the offsite has concluded.
And, for future strategy offsites, consider asking organizers to begin with a review of any current OSTs that teams have been actively working on. By doing so, all attendees will have a shared view of the opportunity space ahead, as well as the progress that’s been made on tackling those opportunities.
A real-world example of an opportunity solution tree
To bring the concept to life, let’s consider a real-world example of opportunity solution trees in practice. Let’s say that you’re responsible for enhancing the search capability within your B2B product, which is a website builder (e.g., Squarespace, WordPress, Wix, etc.).
You might have defined your metric of success to be “the average number of searches completed, per week, per customer.” That is, if your search capability is providing value to your customers, then you would expect that your customers’ end users would increasingly use your search functionality, rather than the functionality of some other competitor solution (e.g., Google Custom Search).
Through user research and inbound customer feedback, we might have discovered that there are three core opportunities for improvement:
- Search results within your feature are currently quite difficult to sift through
- Users have to wait a long time for search results to come back, which is frustrating
- Many users are adding “local” location-based keywords (e.g. “New York” or “San Diego”) to their queries, which is repetitive and tedious yet necessary for accurate results
We might come up with an opportunity solution tree like the below:
You’ll have worked through discussions with sales, marketing, customer success, customer support, design, and engineering to identify possible solution ideas for each of the three opportunities.
And, for any given idea, you don’t simply ship that idea from start to finish – you create testable hypotheses and experiments to identify which aspects of the idea are most valuable.
For example, perhaps you want to make it easier for users to sift through search results, and one idea that seems compelling is to show result previews to users.
“Result previews” is quite broad, however; what exactly makes a preview compelling?
Say that we want to test the assumption that “every result should be reviewed by users.” In that case, we would spin up an experiment where every returned result has its own text-based preview associated with it.
But, we could also test the flip side of this assumption, where “a user really only just wants a single best result ASAP.” We’d also want to run an experiment with a single highlighted “most relevant” text snippet at the top of the page.
And, how do we know that text is really the best way forward? What if our users are particularly interested in images, similar to Pinterest or Instagram? In that case, instead of surfacing text-based links, we should run an experiment where we surface image-based snapshots for our search results instead.
The interaction between OSTs and product strategy
Opportunity solution trees interact with product strategy in two key ways.
First, the OST method complements and enhances product strategy. After all, every OST starts from the product strategy, as the selected metric for any OST must align with the identified product strategy.
Second, opportunity solution trees also inform and influence product strategy, based on assumptions that we’ve validated or disproven, and based on the newly-discovered insights that we’ve uncovered from our experiments.
As a rule of thumb, refine your product strategy after every three experiments. Ask these questions on a regular basis as you complete each experiment:
- Is the identified customer segment still the right one to pursue?
- Is the opportunity larger or smaller than we initially believed?
- Has the market become easier or harder to approach?
Aligning and collaborating with stakeholders through OST
People make decisions based on the context that they have, and reasonable people make the same decisions, if they have the same context.
If you’re faced with disagreement, one (or both) of these is happening:
- The disagreeing person doesn’t have your context
- You don’t have the context that the disagreeing person does
We can use opportunity solution trees to bring stakeholders and executives with us on the discovery journey, starting from customer learnings and ending with our conclusion on what to ship next.
Let’s break down how to set up opportunity solution trees within your organization. This playbook is based on the team workshops that we’ve run with Fortune 500 companies, as well as the 1:1 executive coaching that we provide to high-potential product leaders.
Below, we’ll cover:
- How to establish your first OST
- How to mature an existing OST
- How to pivot towards a new OST
Establishing your first OST
Any time we introduce new working processes or frameworks for thinking within our organizations, we need to secure the buy-in of leaders and cross-functional counterparts.
To break down this support-building step, we’ve found that the most successful product managers tend to use at least four meetings to align stakeholders towards product discovery practices. Here are the four meetings, and the topics to cover within each:
- Metric alignment: Align on the key business metric and discuss how discovery will lead to better results than waterfall over the long run.
- Opportunity exploration: Walk through an initial set of opportunity areas based on customer feedback, and invite stakeholders to share their opportunities as well.
- Opportunity selection: Jointly select an opportunity to start with (not which one is “right” or “wrong”), and document your decision-making process together.
- Solution ideation: Jointly ideate a variety of solutions and agree which initial solution to explore through experiments.
You don’t want to rush through these meetings, because the journey is more important than the outcome. If you find that a particular stakeholder is silent, adversarial, or simply confused, take some time to engage with them one-on-one outside of these meetings. Learn what their concerns are, and work in partnership with them to address those concerns.
And, you may need more than four meetings to bring stakeholders with you on the journey. That said, we don’t recommend cramming multiple topics into the same meeting, as that tends to cause fatigue, loss-of-focus, and frustration from stakeholders.
As an aside, If you’d like to learn more about how to navigate stakeholder preferences more broadly, we’ve recorded a one-hour lecture as part of our monthly recorded PM classes.
Back to the topic at hand: we now have our initial opportunity solution tree in place. But, we’re not done yet. We still need to come up with experiment ideas, and we need to share experiment progress and overall metric movements with our stakeholders.
Maturing an existing OST
As you create each experiment idea, update your OST to identify which solution idea you’re addressing with each experiment. Where you can, annotate your experiment with a one-sentence explanation about the hypothesis you seek to test.
Then, as your experiments conclude, surface the results of each experiment on your OST as well. You can use a checkmark for validated hypotheses and an X for invalidated hypotheses, so that stakeholders can quickly see your progress without getting into the details of specific metric results.
Be sure to broadcast updates to your stakeholders and managers every one to two weeks, depending on how quickly your experiments resolve. By doing so, you prove that your discovery efforts are bearing fruit, and that you’re not simply talking to customers for the sake of talking to customers. Instead, your discovery work is actively moving business metrics forward.
For your first two or three broadcasts, you’ll want to pair those with live meetings as well. In those live meetings, you’ll want to recap that the goal of the opportunity solution tree is to ensure that your product discovery efforts are moving business metrics, and that you’re shipping experiments rather than features.
In each meeting, give stakeholders the space to ask questions about the opportunities that you’ve prioritized and the solution ideas that are on the table. That way, they become an active participant in the product decision making process, where they can contribute their ideas for possible customer pains to tackle or possible solution ideas.
And, any time a stakeholder pushes for a specific feature that does not align with the metric or with a previously-identified opportunity area, you can gently but firmly explain that their feature is unlikely to move prioritized business outcomes.
Once you’ve gained the trust of your stakeholders through these meetings, you can send updates asynchronously, to help save on time and effort. That said, be sure to set clear expectations that stakeholders can and should reach out to you if they have questions, concerns, suggestions, or new ideas to add to the OST.
Moving to a new OST
After each quarter, you’ll need to decide whether to continue to stay on the same OST or pivot to a new one. At the end of the day, every OST will wind up with diminishing marginal returns.As an example, conversion rates can never exceed 100%.
Whenever we decide that we will no longer get the highest ROI by targeting the initial metric, we need to identify a new metric to kick off a new OST. At that point, we need to restart the entire OST workflow that we discussed in “establishing your first OST.”
However, we can accelerate the process a bit, since stakeholders should now be familiar with the foundational concepts behind OSTs. You should only need one to two meetings to align on the business metric, on the opportunity space, and on the one opportunity to focus on.
Once you have the opportunity area to focus on, you should be able to run with solutions and experiments without additional input (provided that you’ve built up enough trust over time with stakeholders, and that you’ve been addressing their questions as they come up).
We now know how to share OSTs with stakeholders. But how exactly do we visually track our progress as we run experiments? Below, we provide a template for how to spin up a visual dashboard that provides relevant context and keeps product discovery front-and-center.
Connecting OSTs to analytics
Opportunity solution trees pair naturally well with analytics capabilities. After all, we don’t know whether a given solution has made meaningful progress for the business unless we analyze its performance, and we won’t know whether we should ship a solution or not unless we can accurately craft an unbiased experiment.
As an example of how you bring your opportunity solution tree to life through analytics, we’ll discuss how to do so using Amplitude Notebooks.
Create an Amplitude Notebook for your given opportunity solution tree. This notebook will serve as a centralized hub for information.
The very first thing at the top of your notebook should be the Key Result that you’re trying to move through your product discovery efforts. That way, we can see whether the key result has actually been improving over time based on our experimentation efforts.
Right after that, we then add our opportunity solution tree diagram as an image underneath the key result dashboard. We can create this diagram in any sort of diagramming tool, e.g., Miro.
Afterwards, we should then list out each experiment that we’ve conducted so far. These experiments should be labeled with the given opportunity that they’re targeting in the opportunity solution tree.
At the very end of your notebook, you should include an appendix that links out to all of the customer interviews and customer research you conducted to flesh out the opportunity solution tree. That way, you have proof and evidence of the opportunities that you decided to tackle.
Closing thoughts
By using opportunity solution trees, we weave in continuous product discovery throughout all points of the product planning process. And, to help stakeholders embrace product discovery, we should use the opportunity solution tree framework.
We should feel empowered to tweak the process and the terminology to fit our specific contexts and needs, as long as we keep these three principles in mind:
- Product discovery must serve business objectives.
- The point of a product team is to iterate on solutions that will address customer pain, rather than shipping features by some arbitrary deadline.
- We as a team must be able to react to customer learnings and feedback in real time, rather than waiting until a quarterly or annual cadence.
When we expose stakeholders and executives to opportunity solution trees it will take some time for them to get used to it. But, once we bring them along on the journey, we’ll find that they’ll be more aligned with our product decisions. Even better, they become active collaborators and contributors, and they’ll share more ideas and customer context than you might imagine.
If you enjoyed this post, check out my others or visit Product Teacher for more on product management.


Clement Kao
Founder, Product Teacher
Clement Kao is Founder of Product Teacher, a product management education company with the mission of creating accessible and effective resources for a global community of product managers, founders, innovators, and entrepreneurs. Product Teacher offers on-demand video courses, career coaching, and corporate training workshops.
More from Clement


