Release Notes: February 2018
Here's what's new in Amplitude as of February 2018.
This product update includes new features to:
- Make it easier to look up existing charts, and to know if they’re credible.
- Enhance productivity, so you can do more in fewer clicks.
- Improve the Taxonomy add-on.
**1. **Making it easier to look up existing charts, and to know if they’re credible.
We don’t want everyone in your organization to have to be an product analytics expert to get value from Amplitude. Over the past two months, we’ve made a few changes to help less analytics-savvy users find the data they need.
Chart and Dashboard Popularity Scores
How many times have you found yourself re-creating a chart that already exists, simply because it’s hard to find the charts other people created, and, once you’ve found it, to really know if they’re credible? To help you filter through the clutter, and find the most credible relevant chart, we’ve introduced popularity scores into our search rankings. Every chart and dashboard in Amplitude now gets scored according to how many other people in the organization view it, and how recently those views happened. Note: viewing your own chart will not make it more popular 🙂
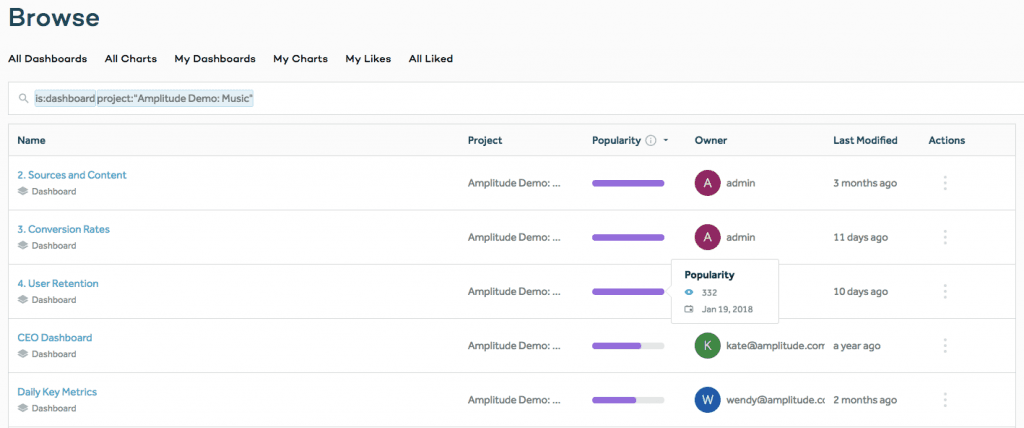
You can now see a chart’s popularity score to find the most credible charts.
People avatars and profiles
Say you’ve found an existing chart or dashboard in Amplitude – how do you know if it’s data you can trust? One of the simplest ways is knowing if it was created by someone on the Analytics team. I.e. If Anne from the Product Analytics team publishes a chart, then you can be pretty sure it’s a number you can quote at your next product review meeting. Next time you’re looking at an** existing chart in Amplitude, try hovering over their avatar to discover what team their on**, and click to see other analyses that user has created.
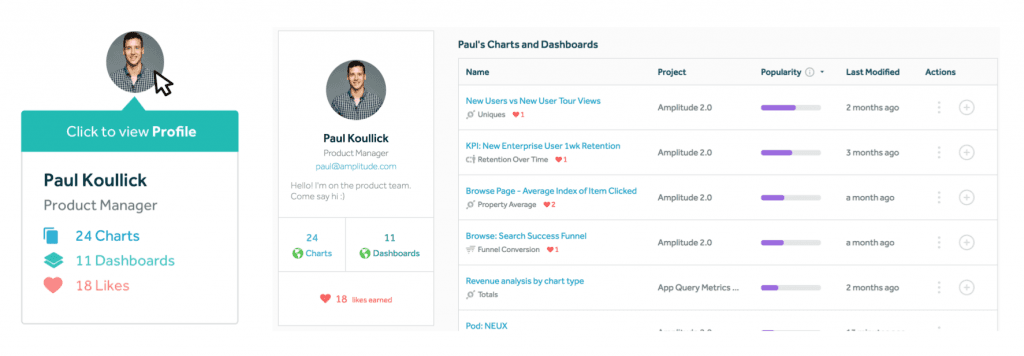
Hover over an avatar icon to launch the user profile.
We’ve also added a quick way to see the top analysis creators in your organization from the Browse tab. We hope that this will help novice users build on top of more experienced people’s analyses more easily.
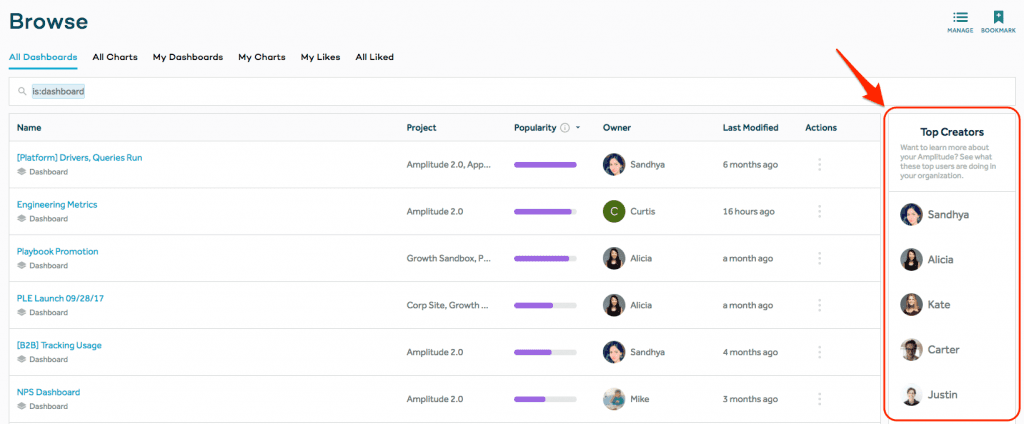
View top chart creators in the browse tab.
2. Productivity enhancements, so you can do more in fewer clicks.
“At the heart of quantitative_ reasoning is a single question: Compared to what?” – Edward Tufte_
Behavioral Cohorting and Segmentation in charts helps you discover what drives retention, engagement, conversion, and revenue by enabling you to understand the differences between groups of users or accounts. Through their lens, you can easily compare behaviors, characteristics, and experiences. We made the following improvements, so you can measure the impact of product changes and uncover actionable insights faster:
Saved Segments in Charts
When creating or editing a chart, one of the most frequent operations is to apply a saved Segment (set of saved filters for users or accounts). We switched to a quick dropdown so that now, selecting a Segment saved by you or one of your colleagues is fast and easy.
Amplitude Saved Segments Demo
User Type Filter
Frequently, you just want to filter events to see what new or active users or accounts did. Funnel Analysis used to be the only chart that supported a quick filter, but now we’ve added it to Event Segmentation too.
Amplitude User Type Filter Demo
Performed Filters
In every chart type in Amplitude, you can quickly apply “performed” filters to segment between users’ or accounts’ behaviors. Some users weren’t realizing this capability existed, so Segments in charts now show the filter by default.
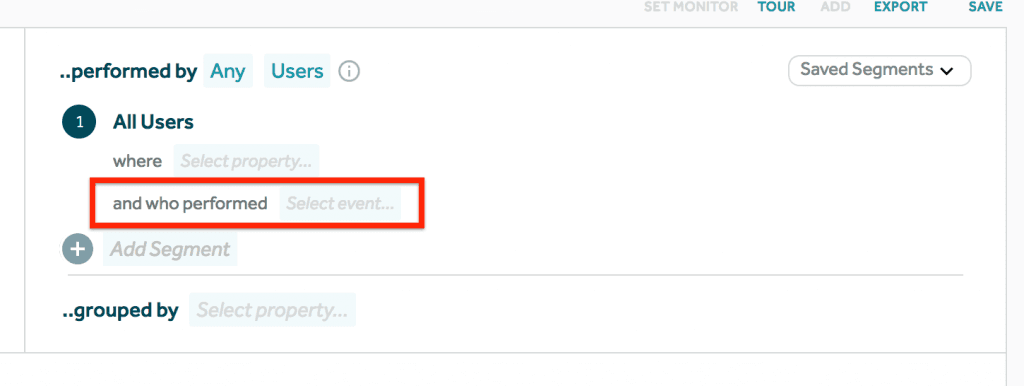
Segments in charts now shows the “performed by” filter by default.
You can now do revenue data analysis in the Event Segmentation chart
Previously, you could only look at revenue data in the Revenue Analysis chart type. This is confusing because the most convenient place to look at time series is the Event Segmentation chart. We’ve now made it easy to perform revenue analysis from Event Segmentation using Custom Formulas. You can learn more about the new functionality here.
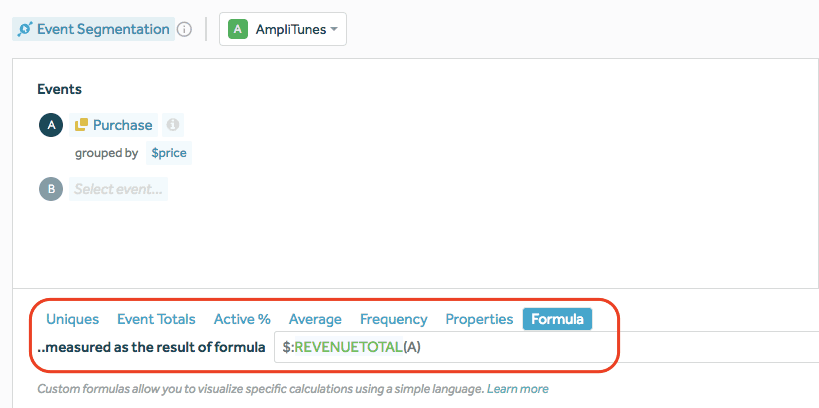
revenue-analysis-event-segmentation
3. Improvements in Taxonomy
One of the biggest challenges with any analytics product is helping team members actually understand what the data means. Blueprint is a central source of truth for teams to maintain documentation about their instrumentation. Built directly into Amplitude, anyone can view these details so no one is blocked on answering any question. Read more about Taxonomy and Blueprint here.
Export Blueprint Metadata
A few months ago we released Blueprint, which is a great way to ensure that all members of your team know exactly what events and properties mean. Half of our Customer base already begun to take advantage of categorizing and describing their event data to ensure everyone is making the right decisions. Descriptions and categories can be added from Blueprint under the Taxonomy tab, or directly from a chart when selecting an event or property.
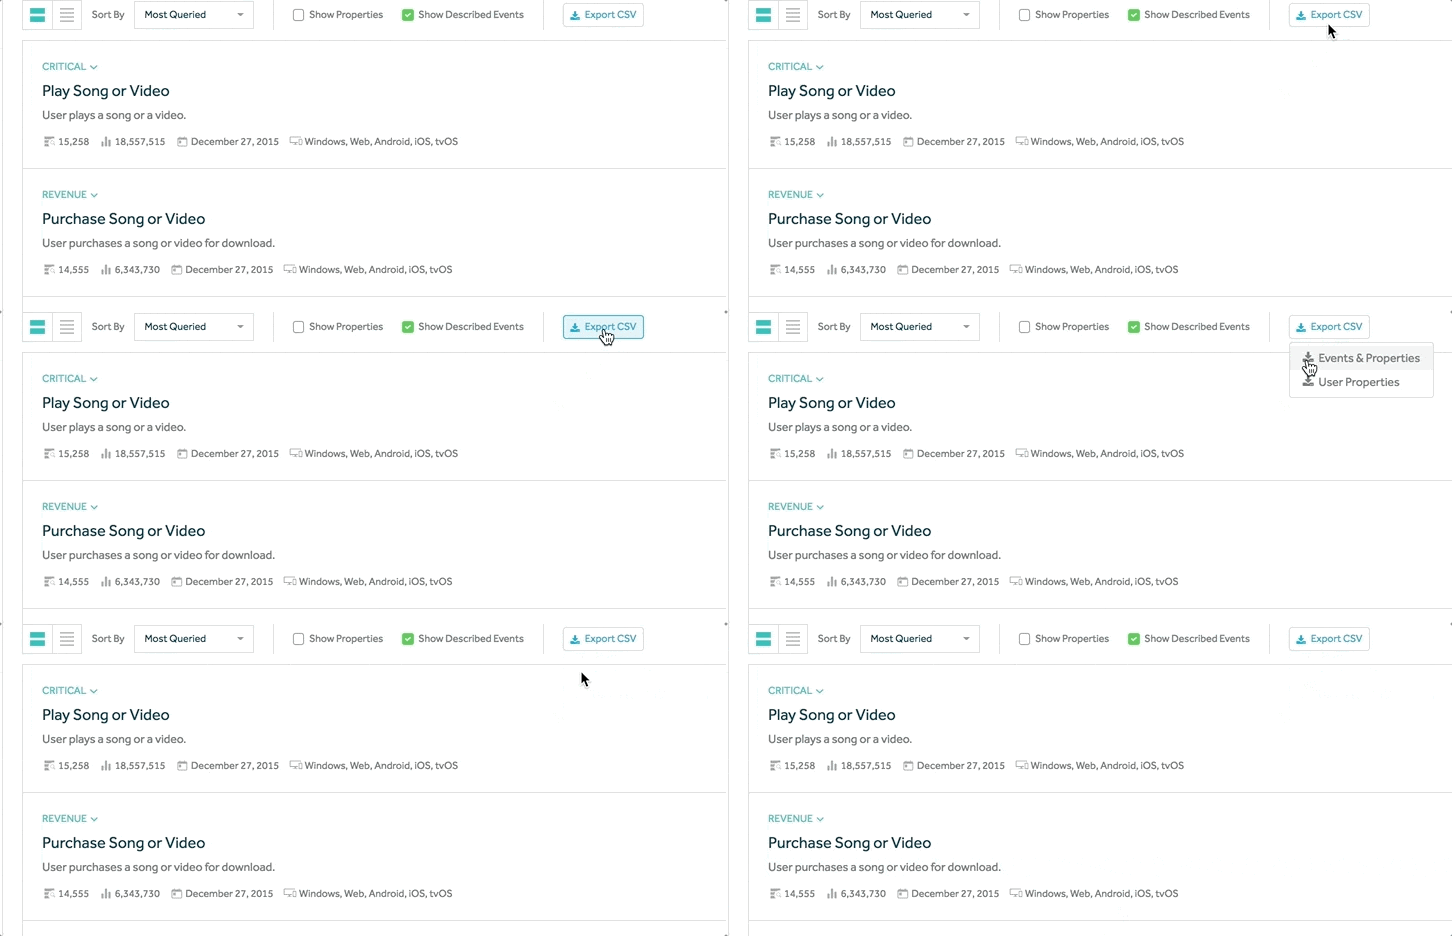
export-blueprint
We recently introduced a small improvement allowing you to export all the rich metadata as part of Blueprint so you can more easily keep other resources up-to-date. We have more exciting incredibly exciting updates for Blueprint coming soon so stay tuned! That’s it! Thanks for using Amplitude, and we look forward to continuing to iterate quickly and build the best possible product analytics platform for you.

Paul Koullick
Former Sr. Product Manager, Amplitude
Paul was formerly on the product team at Amplitude. Previously, product @StrideHealth, product analytics at @Square, and Harvard math & computer science. When not digging into retention curves, Paul likes to play chess and jog along the SF Embarcadero.
More from Paul


