Real-time data analytics: Which KPIs are right for your business?
Track real-time data that actually matters to you and your customers.

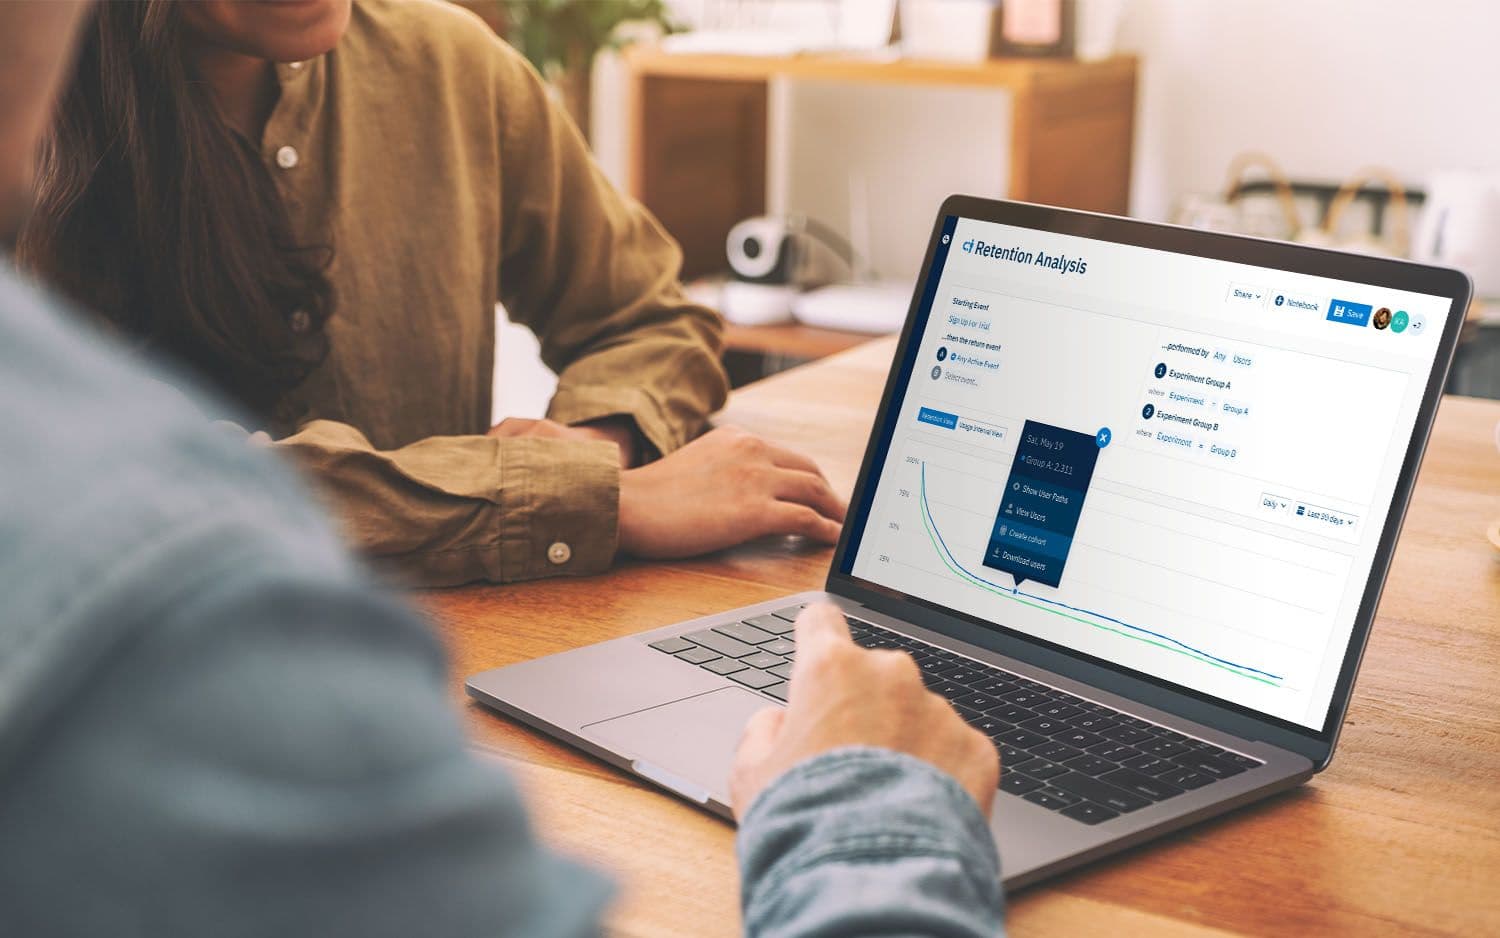
The rate at which consumers buy products, subscribe to services, and experience content is only getting faster. In order for businesses to stay ahead, they need to place accurate bets on what their customers want as fast as possible. Real-time data analytics tells you what your customers are doing now so you can adapt your product to be exactly what they wantReal-time analytics is the process of collecting and analyzing data as it's generated, enabling businesses to understand customer behavior and make decisions within seconds of user actions. This immediate insight lets companies adapt products instantly based on what customers are doing right now, rather than waiting days or weeks for traditional analytics reports.
What Is Real-time Analyticsis real-time analytics?
Today’s businesses are learning that success, growth, and improvement are found where customers spend most of their time—the digital world. When customers perform actions (or don’t) inside a digital application, mobile app, or website, this creates an opportunity to understand your customers in a very specific way.
Real-time analytics means gathering and digesting information that’s being generated in the present moment. Data is instantaneously aggregated into a virtual dashboard giving businesses the opportunity to make decisions within seconds after the user performs an action.
By taking advantage of real-time data, businesses can make on-the-go improvements to digital products, websites, and mobile apps. Clicks to CTA buttons, skips on songs, and abandoned carts are all examples of events that can be analyzed in real-time.
The Value of “Real-time”
The game-changing benefit of observing data in real-time is the speed at which you can make adjustments. It gives you the ability to stay ahead of the competition with a better, more refined, and tested product. Reducing the time it takes to access data, interpret it, and output a change can save resources and prevent product strategy errors.
Companies that fold in a real-time analytics solution will no longer have to roll out a change and wait weeks to see how their user base reacts. A/B testing, experimentation, and error correction become more fluid and calculated when time is on your sideReal-time analytics helps teams see and act on user behavior as it happens. It turns live events into insights your product, growth, and engineering teams can use right away.
What Is Historical Data?How real-time analytics works
Key capabilities include:
• Instant data processing: Information flows directly from user interactions into dashboards
• Immediate decision-making: Teams can respond to user behavior within seconds
• Live optimization: Make product changes while users are still active
Common real-time events businesses track:
• CTA button clicks
• Content skips or engagement drops
• Cart abandonment moments
• Feature usage patterns
Why real-time analytics matters for business
Why real-time analytics matters:
• Speed advantage: Make product adjustments within minutes instead of weeks
• Resource efficiency: Prevent costly strategy errors through immediate feedback
• Competitive edge: Respond to user needs faster than competitors
• Fluid experimentation: Run A/B tests and see results as they happen
Historical data is data that was generated in the pastTraditional analytics create a weeks-long delay between user action and business response. Prior to real-time analytics capabilities, this kind of data was considered the primary source of truth for making informed decisions. This “long-range” information can be used to find patterns of performance over time, not necessarily in the momentReal-time analytics eliminates this gap, letting teams optimize experiences while users are still engaged.
Real-time vs. historical data analytics
Historical data is still important, but its value is more of an investment. Metrics about internal productivity, best times of year for sales, and other long-term benchmarks inform bigger-picture initiatives like business strategies or product roadmapsanalyzes past events and patterns, typically processed hours, days, or weeks after events occur.
Key differences:
Real-time analytics:
• Processes data within seconds
• Enables immediate responses
• Best for: Live optimization, urgent fixes, active user engagement
Historical analytics:
• Analyzes data from past periods
• Reveals long-term trends and patterns
• Best for: Strategic planning, seasonal insights, performance benchmarks
Companies will want to leverage both historical data and real-time analytics to discover deeper insights about their products, customers, and goals. Generally, historical data should be used to create overarching goals orWhy use both: Historical data sets strategic direction and benchmarks, while real-time analytics is used to bring those goals to lifeexecutes those strategies. Perhaps your business used its historical data to locate a slight gap in annual Q3 sales. Then in Q3, you used real-time analytics to experiment with your company’s app to increase conversionsFor example, historical data might reveal Q3 sales gaps, then real-time analytics helps you test solutions during Q3 to close those gaps immediately.
4 KPIs and Which Industries Should Use Themwhich industries should use them
Although every industry is different, there’s a new consensus on what kind of data is most importantReal-time analytics focuses on user behavior over demographics. According to a survey conducted by Harvard Business Review Analytics Services sponsored by Amplitude, respondents said the most important data sets for success revolve around user engagement, customer retention rate research shows the most critical metrics are user engagement, retention rate, and customer lifetime value—all behavioral indicators.
In other words, the new precedent for analytics is not who users are but what they do. Therefore, the faster you can understand why they do what they do, the better you can make your product. You’ll need to track behavioral data in order to create highly personalized experiences that cater to customer preferences.Why behavioral data matters:
• Shows what users actually do, not just who they are
• Enables immediate response to user actions
• Creates opportunities for instant personalization
Having the right tools to track real-time analytics is one thing, but understanding what to track is not as easy. Determining the right KPIs is largely dependent on the nature of your business, its product, and its goalsChoosing the right KPIs depends on your business model. Here are just a few examples to get you thinking about the value of real-time analyticsDifferent industries need different real-time metrics based on their core customer engagement patterns.
1. Free-to-paid Conversion: B2C/Consumer Techconversion: B2C/Consumer tech
Business-to-consumer (B2C) companies sell products or services directly to consumers. From brick-and-mortar gyms to online meditation apps, these companies often use free memberships or trials to entice subscriptions. Business cycles in this segment tend to move fast; every interaction prospects have with the company is important.
Potential subscribers who take advantage of free trials don’'t always convert. To crack the code, you can use real-time analytics to find out where users are dropping off and why. It could be that many users do want to subscribe after their free trial is over, but the activation process is complicated. Using real-time analytics, you find that users drop off when they have to switch devices to activate their membership. The faster your team can host activation on one device, the better your free-to-paid conversion rate may be.
Other tactics like lowering costs, extending the deadline, and finding user engagement moments can all be tracked and experimented with real-time analytics.
2. Conversion Raterate: Ecommerce
Ecommerce companies depend on visitors making purchases on their websites and then coming back for more. The conversion rate KPI measures the percentage of visitors who end up buying something.
Real-time analytics can help ecommerce companies pinpoint exactly where the friction is in the buying experience. For instance, if users are abandoning their carts when trying to add or remove an item, use real-time analytics to fix the problem and see if it worked. It could be a matter of a few clicks. Instead of having to click specific boxes on each item to remove them, perhaps you can add a “delete all”"delete all" button for more convenience. Once you add the option, you can monitor the change in real-time to see if it was effective.
Changing the buying experience to have fewer clicks, altering the design or copy of the page, changing inventory, and sending notifications are all real-time data opportunities in ecommerce.
3. Subscriber Retention: Media and Entertainmentretention: Media and entertainment
Media and entertainment companies can use real-time analytics to find new ways to drive retention. For this segment, converting prospects into subscribers isn’'t necessarily as important as finding out why subscribers stick around. Retention—the rate at which subscribers remain customers—is a huge indicator for long-term success.
One way to increase retentionOne way to increase retention is tracking revenue-driving subscribers with real-time analytics. These subscribers are long-haulers, often called power users. They use every little bell and whistle your product offers and spend the most time consuming content. Real-time analytics can be used to watch what this group of users is doing.
If you can come away with a specific pattern of behavior, you may be able to incentivize those same actions for the rest of your user base. For instance, you might find that users who create a “Watch List”"Watch List" are more likely to remain subscribed. Using real-time analytics, you can test ways to get users to create a Watch List: notifications, bigger buttons, added descriptions. Experiments like this can tell you if your strategies are working or not.
4. Cost per Leadlead: B2B/SaaS
The cost per lead KPI represents how much a business has to spend to generate a prospective subscriber. Getting this cost as low as possible while still maintaining a healthy stream of leads is important for SaaS companies. Anura.io details a hypothetical formula, “"You spend $1,000 on a pay-per-click campaign and convert 10 visitors into leads. Your cost per lead is $100. If you convert 100 visitors, your cost per lead is $10.”"
According to the above formula, creating more converted leads is the way to keep costs low. This is where real-time analytics comes in. By following the behaviors, preferences, and actions of converted leads in real-time, businesses can alter the lead generation experience at a faster pace.
Take a basic landing page prospects visit to fill out a form and go deeper into the funnel. You can use real-time analytics to change things like copy length, headlines, and design to drive more form fills. The best part? Once you find a winning landing page using real-time analytics, you can take that same formula and test it in another marketing campaign.
Make Data Accessible for Everyone at Your CompanyScale real-time insights across your organization
Taking advantage of real-time analytics clearly has its benefits, and if you make data accessible to more teams throughout your organization, it will have a greater effect. All too often, data gets siloed within one teamReal-time analytics delivers maximum impact when shared across teams, not siloed within single departments.
Implementation strategy:
• Break down data silos: Give multiple teams access to the same real-time dashboards
• Share successful patterns: When one team finds a winning approach, distribute insights immediately
• Enable cross-team collaboration: Let copywriters, designers, and product teams act on the same live data
In the case of the SaaS example above, the lead generation team found a way to convert more leads using real-time analyticsExample in action: A SaaS lead generation team discovers a high-converting landing page through real-time testing. If they share that data with the wider marketing team (copywriters and designers), it could have an exponential growth effect across the entire organizationBy sharing this data immediately with copywriters and designers, the entire marketing organization can apply these insights to new campaigns while the pattern is still active. Democratizing data and sharing it widely enables more teams in your business to think outside the box, develop new ideas, and increase collaboration—maybe even in real-time.
Get started with real-time analytics
Learn more about real-time data analytics by requesting a custom Amplitude demo today.Real-time analytics transforms how businesses understand and respond to customer behavior. By processing data as it happens, teams can optimize experiences instantly, prevent issues before they impact users, and stay ahead of changing customer needs.
The key is choosing the right KPIs for your industry and ensuring insights reach the teams who can act on them immediately. Whether you're improving conversion rates, reducing churn, or optimizing user engagement, real-time data gives you the speed advantage needed in today's competitive landscape.
Ready to see how real-time analytics can accelerate your product decisions? Try Amplitude for free today and start turning user behavior into immediate action.

Darshil Gandhi
Director, Product Marketing, Amplitude
Darshil Gandhi is a Director of Product Marketing at Amplitude looking after product and partner launches. He was previously a solutions engineering team principal, helping dozens of Amplitude customers turn data into actionable insights. Darshil graduated from Dartmouth College with a Masters in Engineering Management.
More from DarshilRecommended Reading

Lessons from consolidating our MCP server
Oct 6, 2026
10 min read

What AI engineers do in the age of agentic code
Oct 1, 2026
14 min read

An analysis of Jev: Faster and cheaper, but watch the accuracy
Sep 28, 2026
13 min read

Your agent isn’t broken. It’s guessing.
Sep 23, 2026
6 min read
Explore Related Content
9 Top Feature Flag Solutions for Modern Product Teams in 2026
Jan 27, 2026
Using behavioral analytics for growth with the Amplitude app on HubSpot
Jun 17, 2024
10 min read
Identity resolution: The secret to a 360-degree customer view
Feb 16, 2024
10 min read
Inside warehouse-native Amplitude: A technical deep dive
Jun 27, 2023
15 min read
5 Proven Strategies to Boost Customer Engagement
Jul 12, 2023
Designing High-Impact Experiments
May 13, 2024
9 direct-to-consumer marketing tactics to accelerate ecommerce growth
Feb 20, 2024
10 min read
Leveraging analytics to achieve product-market fit
Jul 20, 2023
10 min read