Release Notes: April 2018
New in April: find existing charts more easily, top events for segments, and one click CSV exports.
April was a busy month for us at Amplitude. Here’s what we’ve been working on.
1. Stability and performance improvements.
April investments included a database migration to improve scalability, automatic failover triggers, and additional data replication. Infrastructure will remain a top investment area for the team in coming months.
2. Find existing charts more easily.
How many times do you find yourself re-creating the same analysis that you, or someone else on your team, has surely already done? Last month’s search page improvements aim to make it easier to leverage existing analyses (both your own, and co-worker’s), to avoid needing to create charts from scratch.
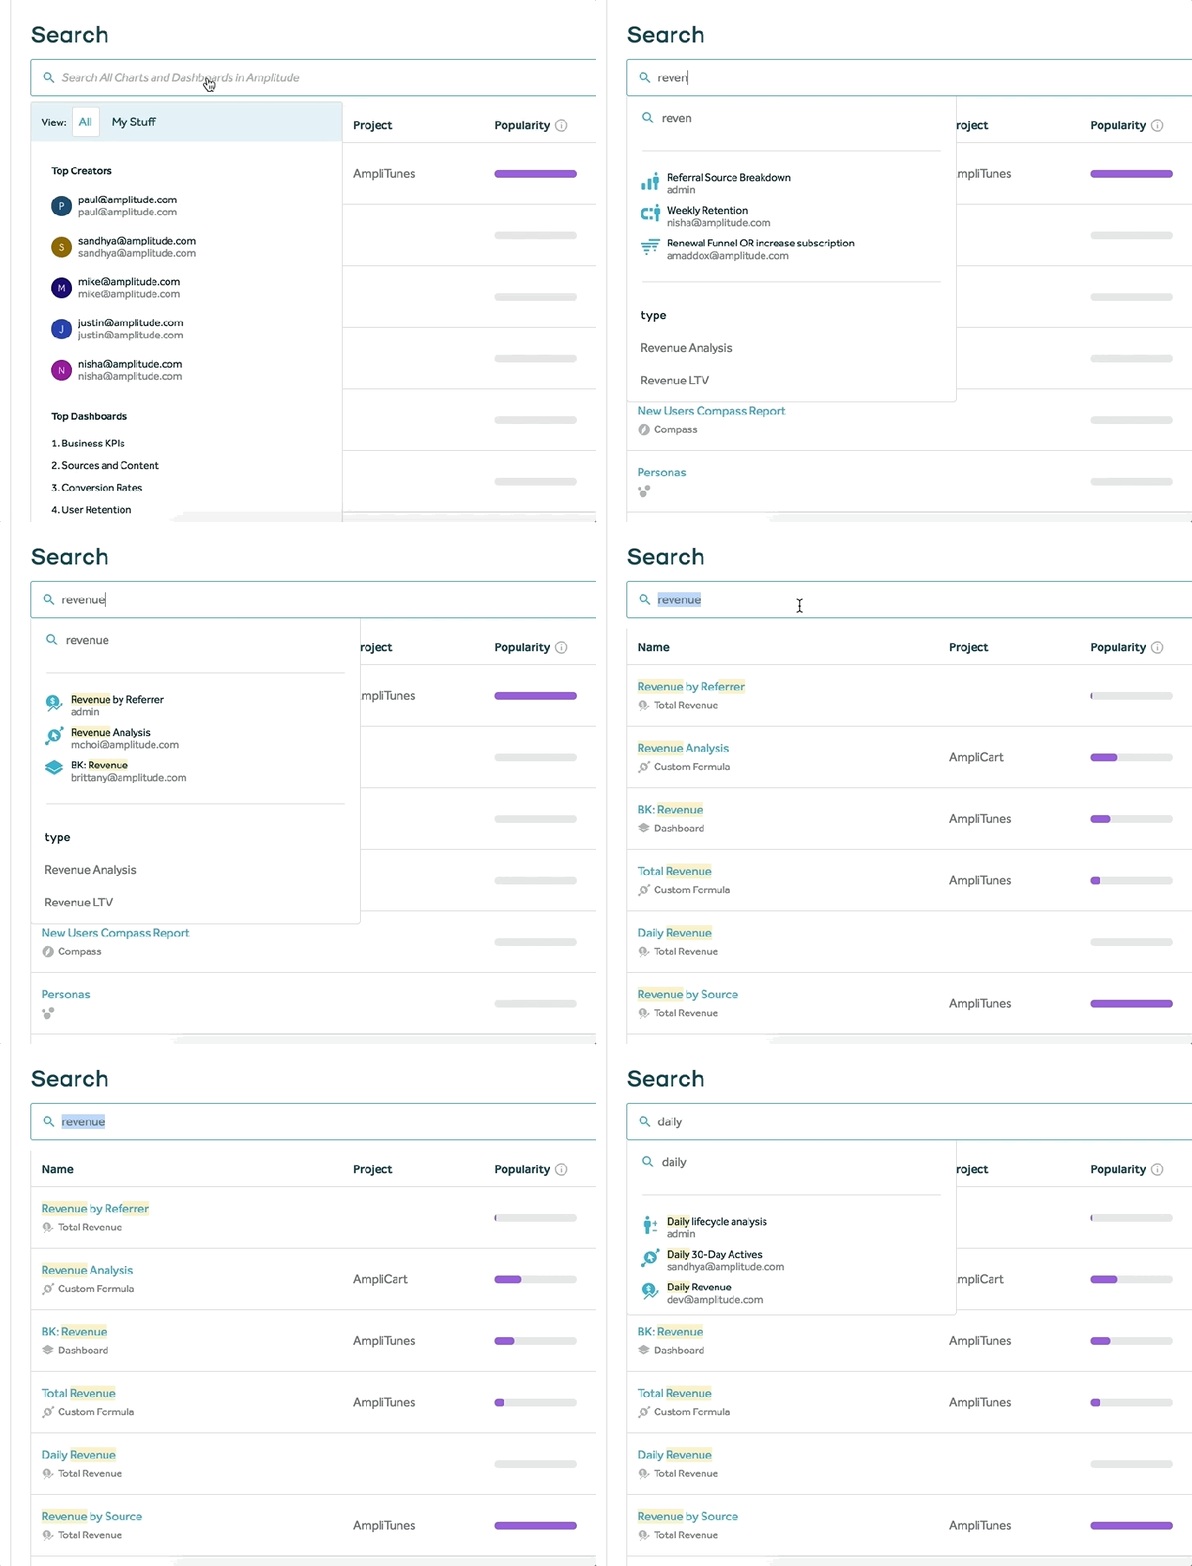
Search is getting spiffier! Letter-by-letter autocomplete, ranking improvements, and more to come.
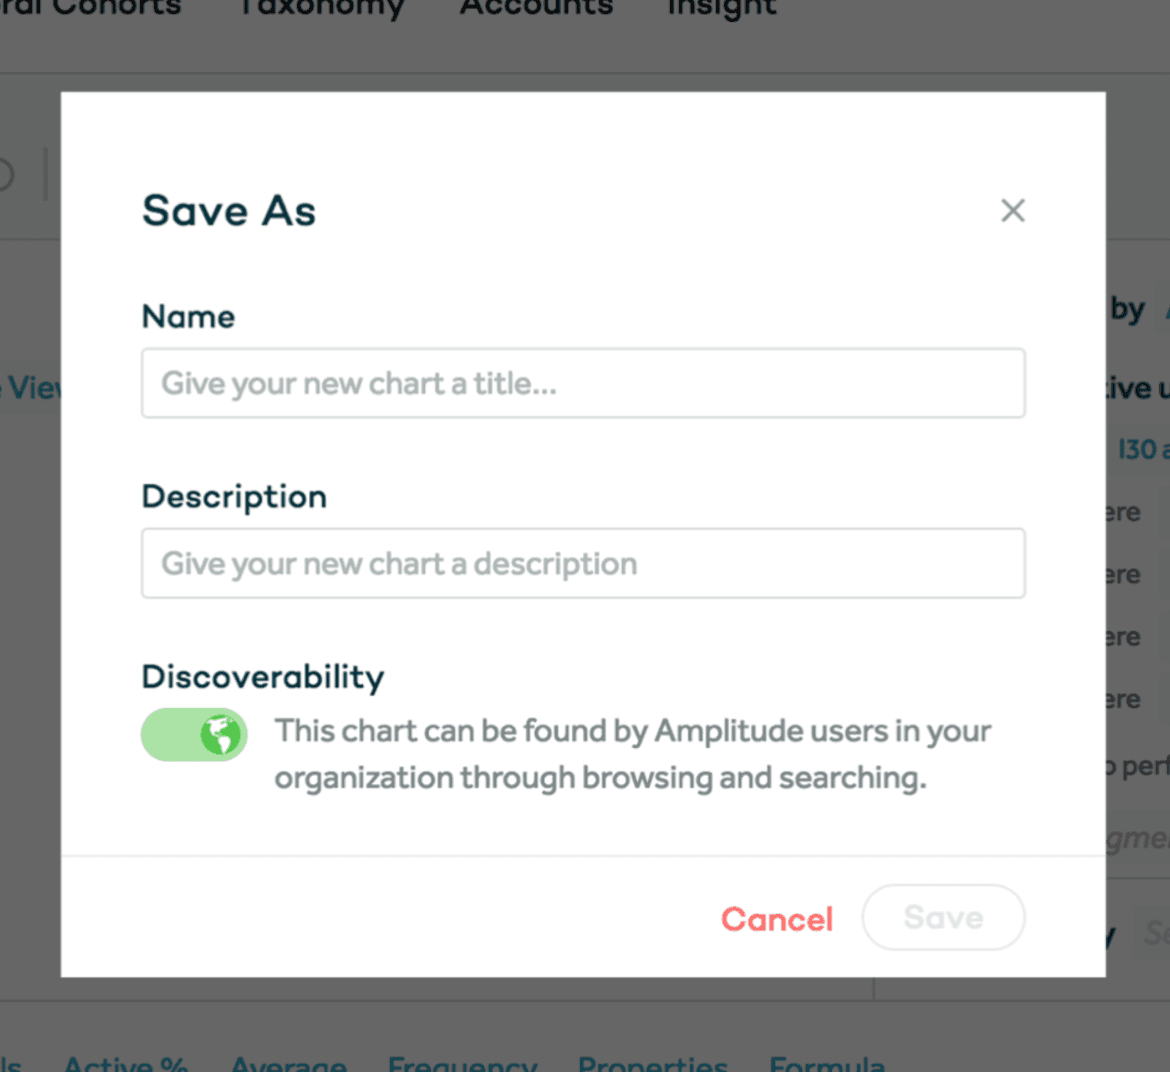
We’ve also made new saved charts discoverable by default, so that your co-workers can discover it and benefit from the tribal knowledge!
Newly saved charts and dashboards are now discoverable by co-workers, by default.
3. Better insight into the behaviors of a user group.
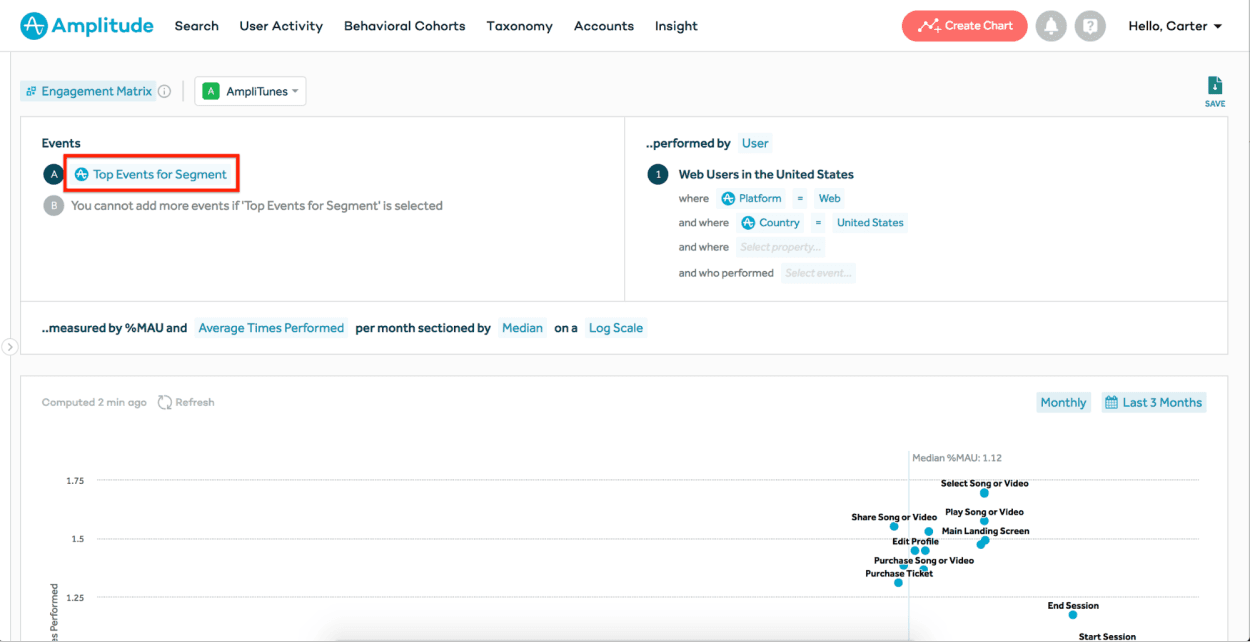
To make it easier to analyze the key behaviors of a given group of users, we’ve added a new default event type, “Top Events for Segment.” This automatically determines the 10 most common behaviors by number of times performed for the Segment of users you’ve selected. Try using this with the Engagement Matrix chart to see the percent of users in the cohort who perform each behavior, and how many times they do it, on average.
Top events for a user segment, displayed on the Engagement Matrix chart type (available on the growth and enterprise plan)
4. Tired of inviting every new employee to Amplitude, one-by-one? Turn on SSO for your team!
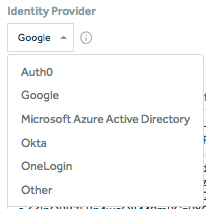
Single Sign On (SSO) is a great way to securely and easily manage access to Amplitude at scale. We’ve made some improvements to make it easier to configure SSO on your own along, with more detailed documentation and explicit support for various Identity Providers. SSO is only available on our Enterprise plan. To learn more, contact your Success Manager.
Amplitude now offers all of these identity provider options for SSO.
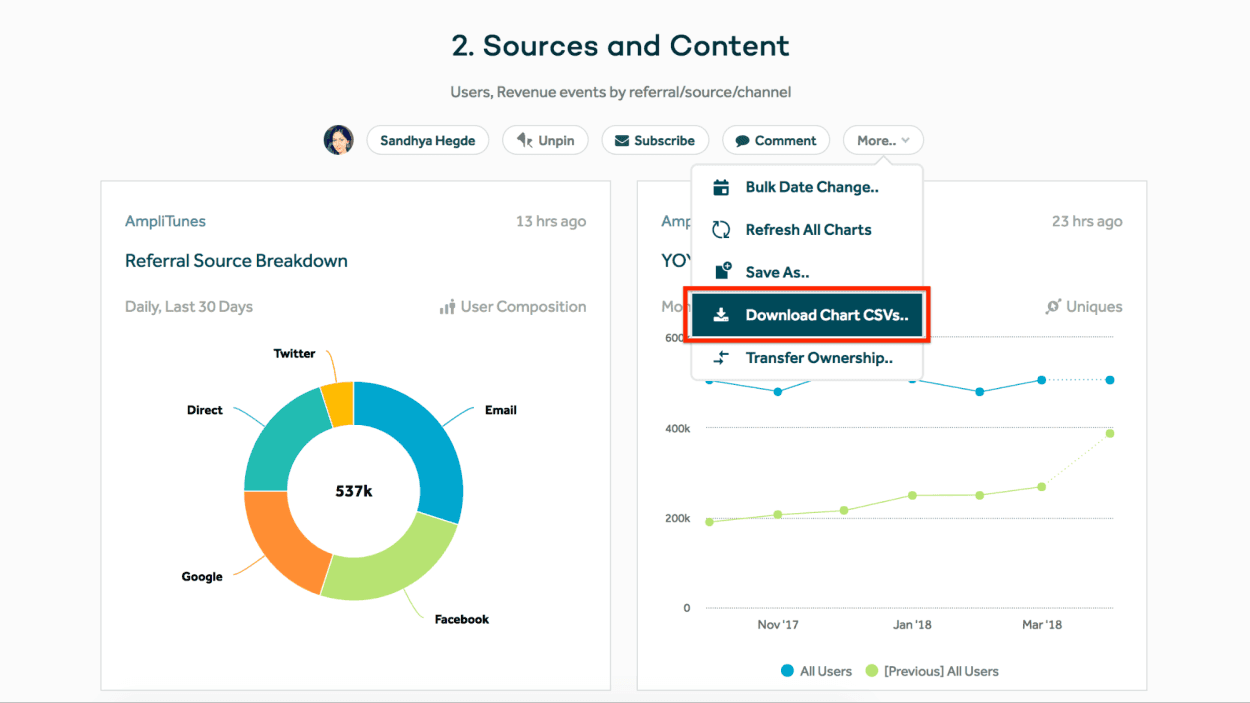
5. Save time with one-click dashboard .CSV exports.
It’s now possible to export the data from each chart on your dashboard with one click!
6. Bonus! Chrome extension to show the events fired as you click around your company website.
We’re experimenting with a new instrumentation explorer chrome extension that shows you what events are fired as you interact with your website.
The chrome extension shows all event activity, including identify calls, for easier QA.
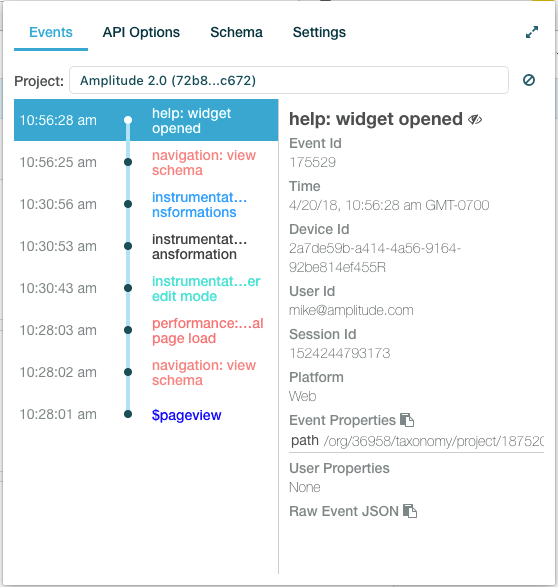
If your organization has access to Schema, and you are planning your instrumentation, the chrome extension shows you which events, properties, and values that are out of spec.
That’s it! Thanks for using Amplitude, and we look forward to continuing to iterate quickly and build the best possible product analytics platform for you. Leave a comment below and we’ll get back to you ASAP.

Paul Koullick
Former Sr. Product Manager, Amplitude
Paul was formerly on the product team at Amplitude. Previously, product @StrideHealth, product analytics at @Square, and Harvard math & computer science. When not digging into retention curves, Paul likes to play chess and jog along the SF Embarcadero.
More from Paul


