Release Notes: August 2018
It’s been a busy month for us at Amplitude: Slack integrations, team space permissions, and rolling out the new layout
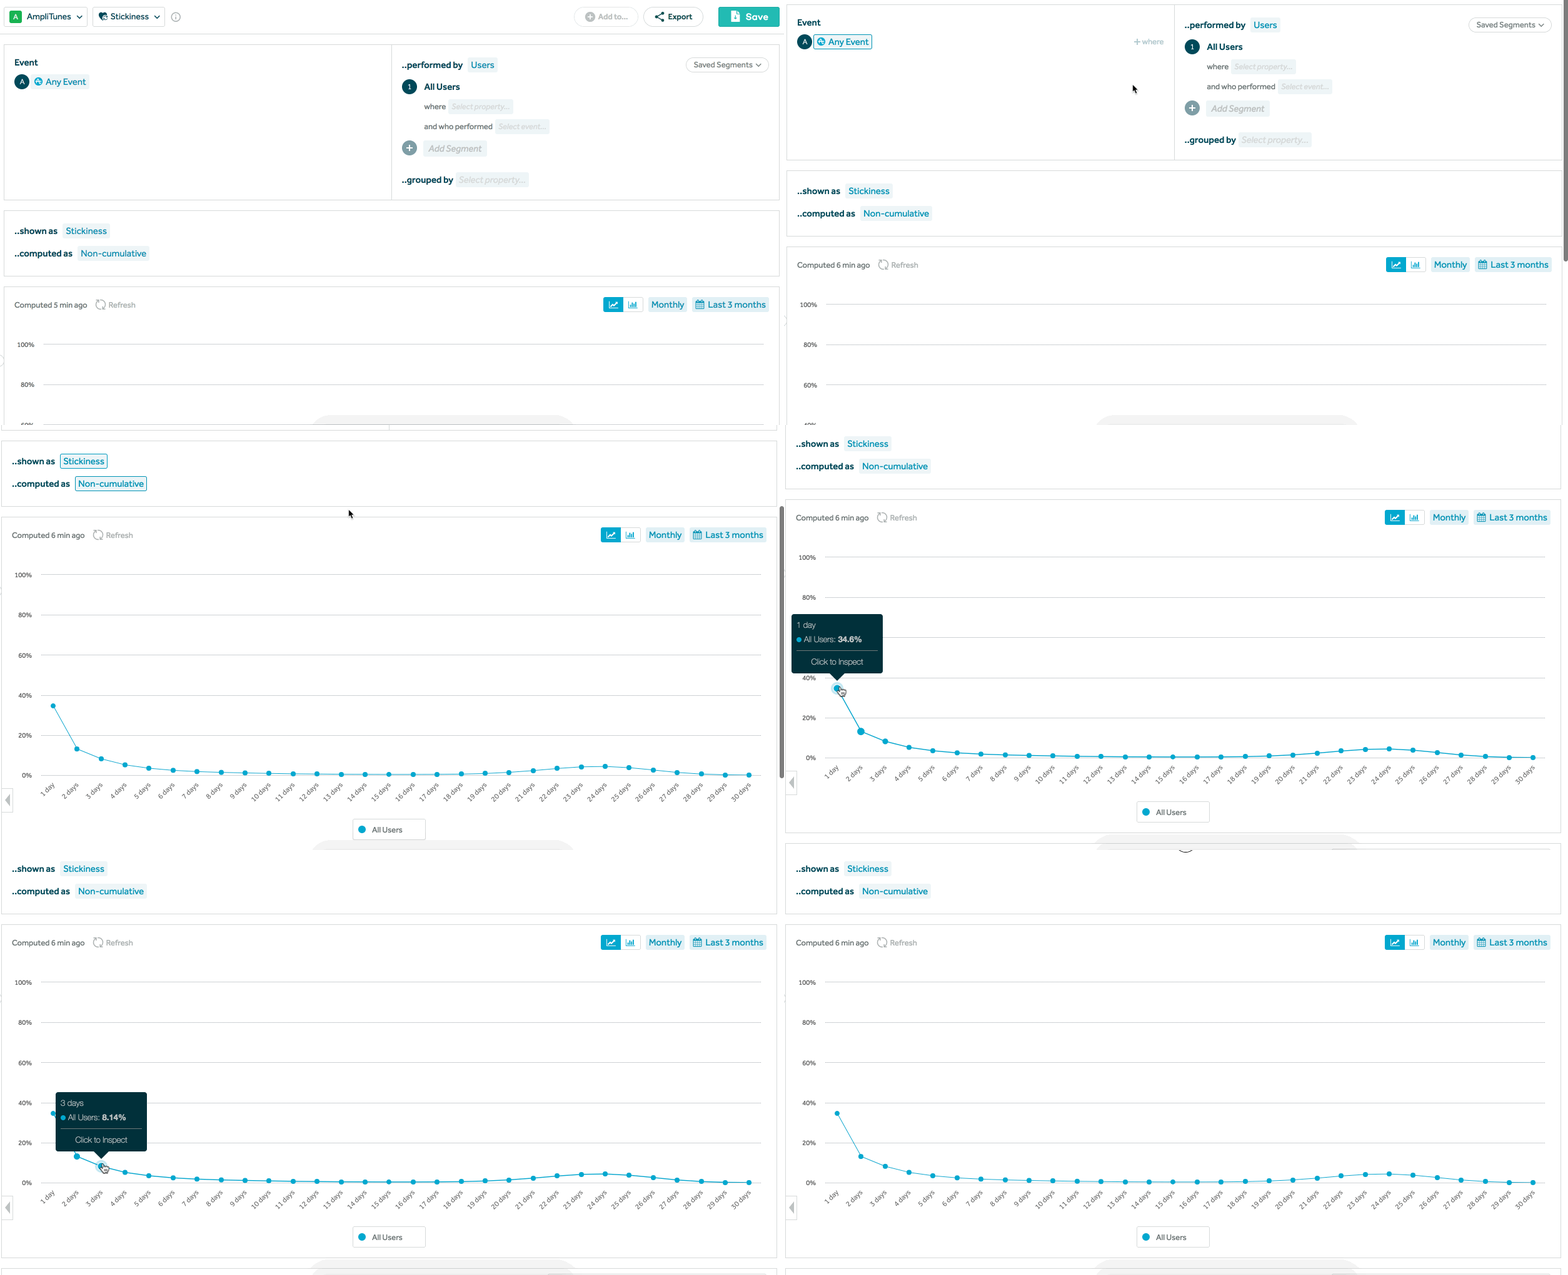
What’s your product’s Power User Curve? Find out with the Stickiness chart
Available for all organizations using Amplitude.
Understand your power users’ engagement by looking at the distribution of how frequently they use your product. Stickiness in Amplitude shows the number of days people used the product. Inspired by Li Jin and Andrew Chen’s fantastic blog post, we’ve added the option to view Stickiness non-cumulatively so you can measure the exact number of days in a week or month that users perform an event by percent of users.
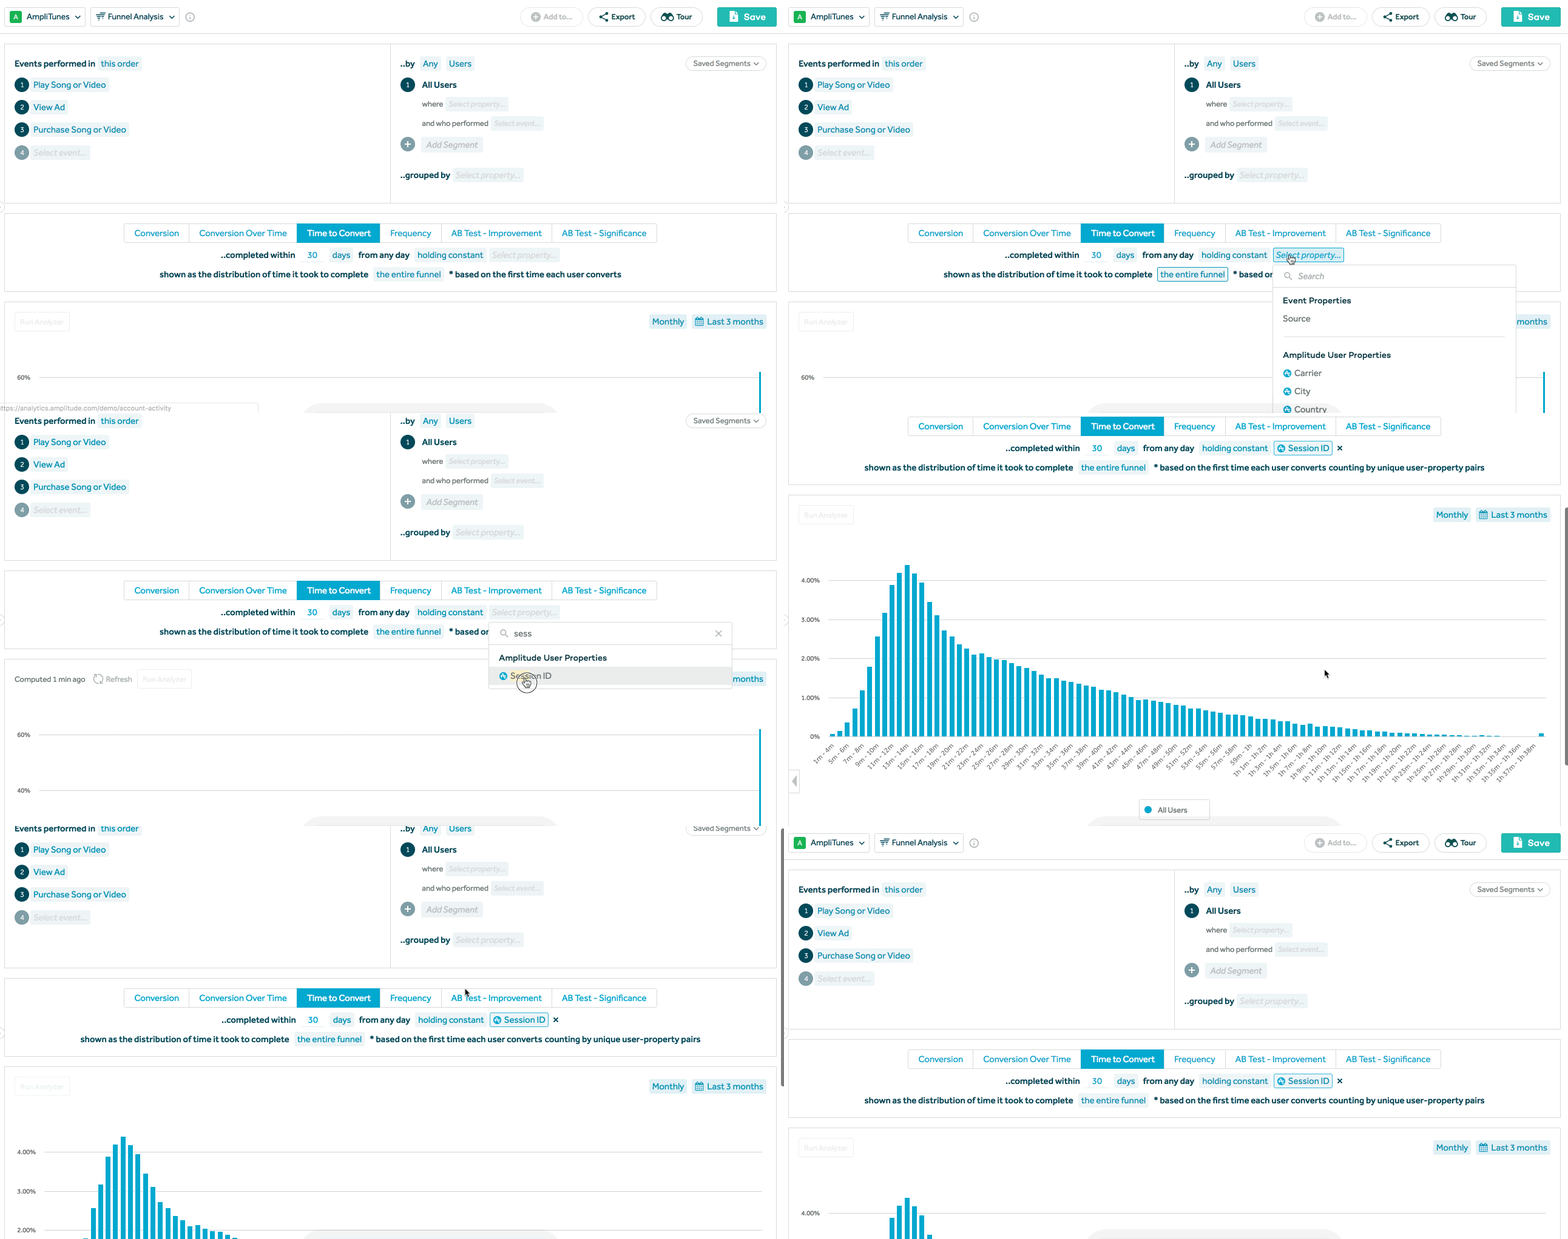
Calculate your users’ time-to-convert and step frequency in Funnels across every session
Available for all organizations using Amplitude.
Determine how long it takes for your users to convert and how many times they perform a given step prior to converting, across every time they went through the Funnel, by holding Session ID constant! We’ve extended the holding constant capability in Funnels to the Time to Convert, Frequency, and AB Test metrics.
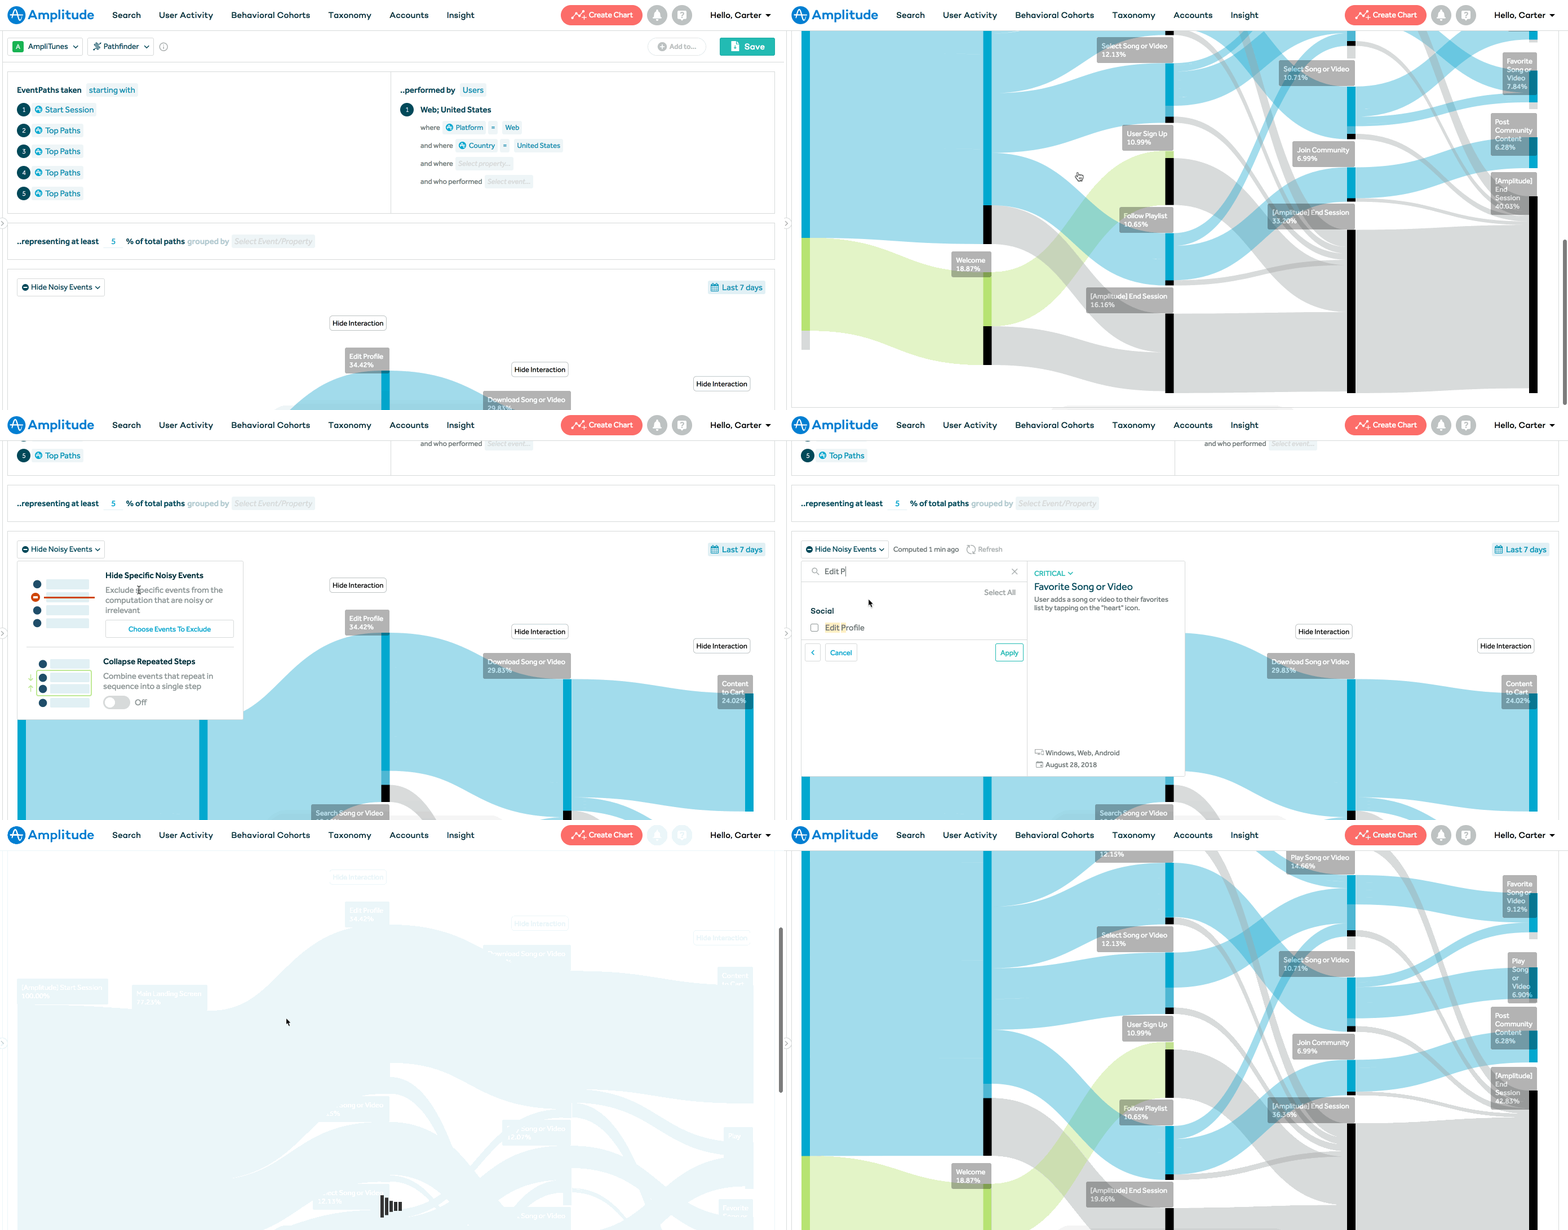
Exclude noisy events from Pathfinder to better understand user journeys
Available as part of all paid plans.
You can now exclude noisy and irrelevant event types from Pathfinder on a per-chart basis in order to learn about the paths that your users take through your product! Learn more here.
Ship product more confidently with near real-time notifications of changes in product metrics
Available as part of the Enterprise plan or as part of the Insights add-on.
When launching new features or versions of your product, one of the most important checklist items for any team is ensuring you haven’t broken any critical experiences or core flows in your product. With hourly notifications for Custom Monitors, you can continue to iterate on your product quickly knowing that Amplitude will notify you of any adverse changes in important KPIs. Learn more here.
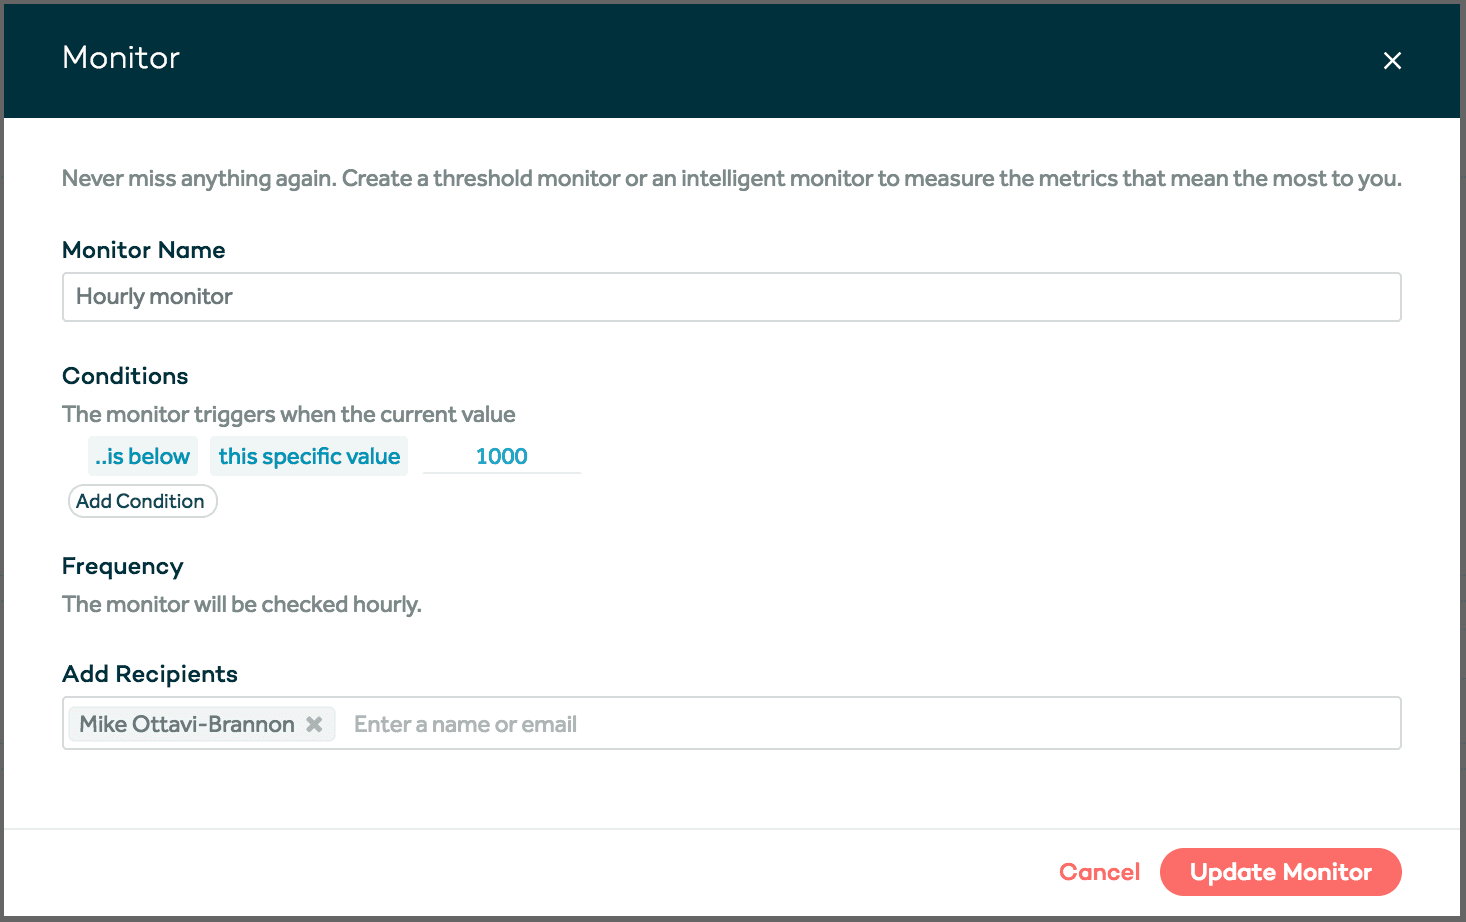
Some limitations: Hourly monitors can only be created on hourly event segmentation charts. In addition, the thresholds need to be defined manually as either an absolute value, or a change from the previous hour.
Search for familiar keywords or references to other tools with searchable descriptions in Schema
Available as part of all paid plans.
We’ve seen a lot of customers take advantage of describing their event data in Amplitude to improve the accessibility of data across their organizations. We’ve expanded on that by making descriptions for event data searchable. That means you can put in descriptions for event types that have references to other tools in your analytics stack that other end users may be more familiar with. Learn more here.
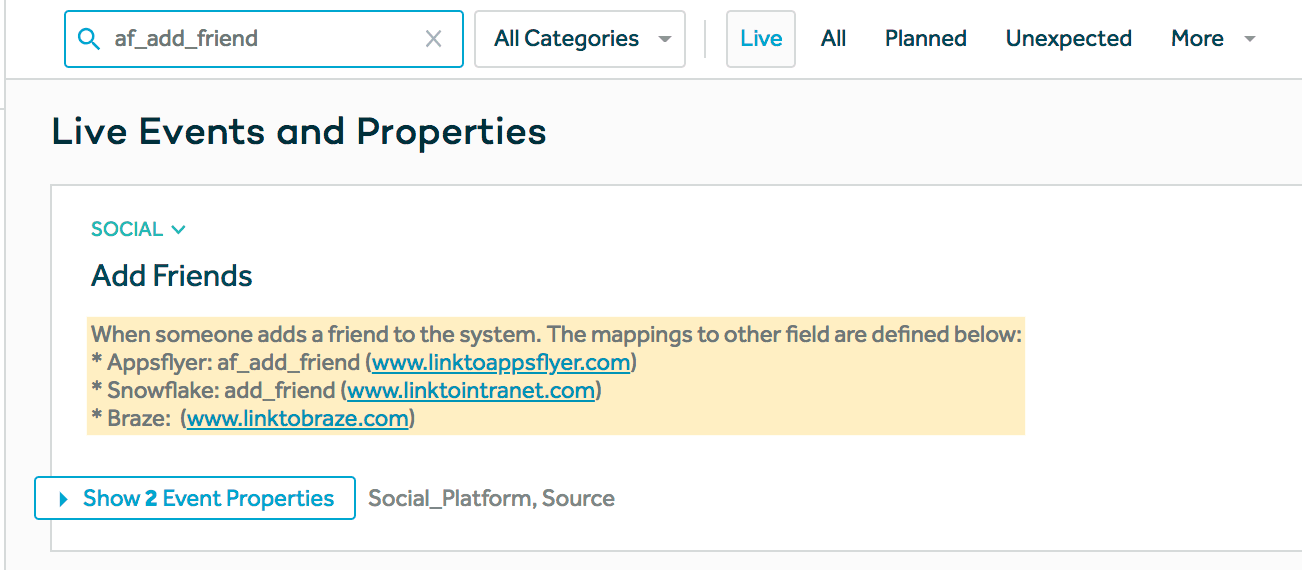
Keyword matches found in the description field are highlighted in search results.
Admin alerts to avoid event quota overages
Available as part of all paid plans.
We’re implementing new event quota alerts for all paid plans that will notify org admins when you’re at risk or have exceeded your contracted event volume. Effective September 4th, the notifications will trigger upon your organization reaching respectively 80%, 90%, 100%, and 110% of your event quota, notifying admins via email and in the application. Please note, this update will replace the customizable alert threshold.
Avoid throttling when sending batches of data using the new /batch ingestion endpoint
Available for all customers using our server-side implementation methods.
Last month we announced the beta of a new batch ingestion pipeline built to improve throughput and reduce the likelihood of running into throttling errors. Today we’re announcing the general availability of the new/batch API endpoint. With this new endpoint, each API key can send up to 1,000 events per second per device id or user id. The new endpoint also provides richer error messaging including identifying offending devices in the event of throttling errors, allowing you to make better decisions about which events to retry. Take a look through our documentation to learn more.
You can now download much larger behavioral cohorts (over 1M users)!
Available as part of all paid plans.
We recently launched a new asynchronous version of our behavioral cohorts download APIs that supports downloading cohorts with up to 1 million users. Support for cohorts with up to 10 million users is coming soon. Take a look at our documentation to learn more.
Outlier Cohorts have been deprecated
Affects for all organizations using Amplitude.
We have deprecated an experimental feature, Outlier Cohorts, that segmented users by whether they were statistical outliers in the rate at which they performed a behavior.
Feeling adventurous? Check out some of the features we have in Beta, below
A new, more intuitive, navigation layout! (Beta)
Available for any organization using Amplitude.
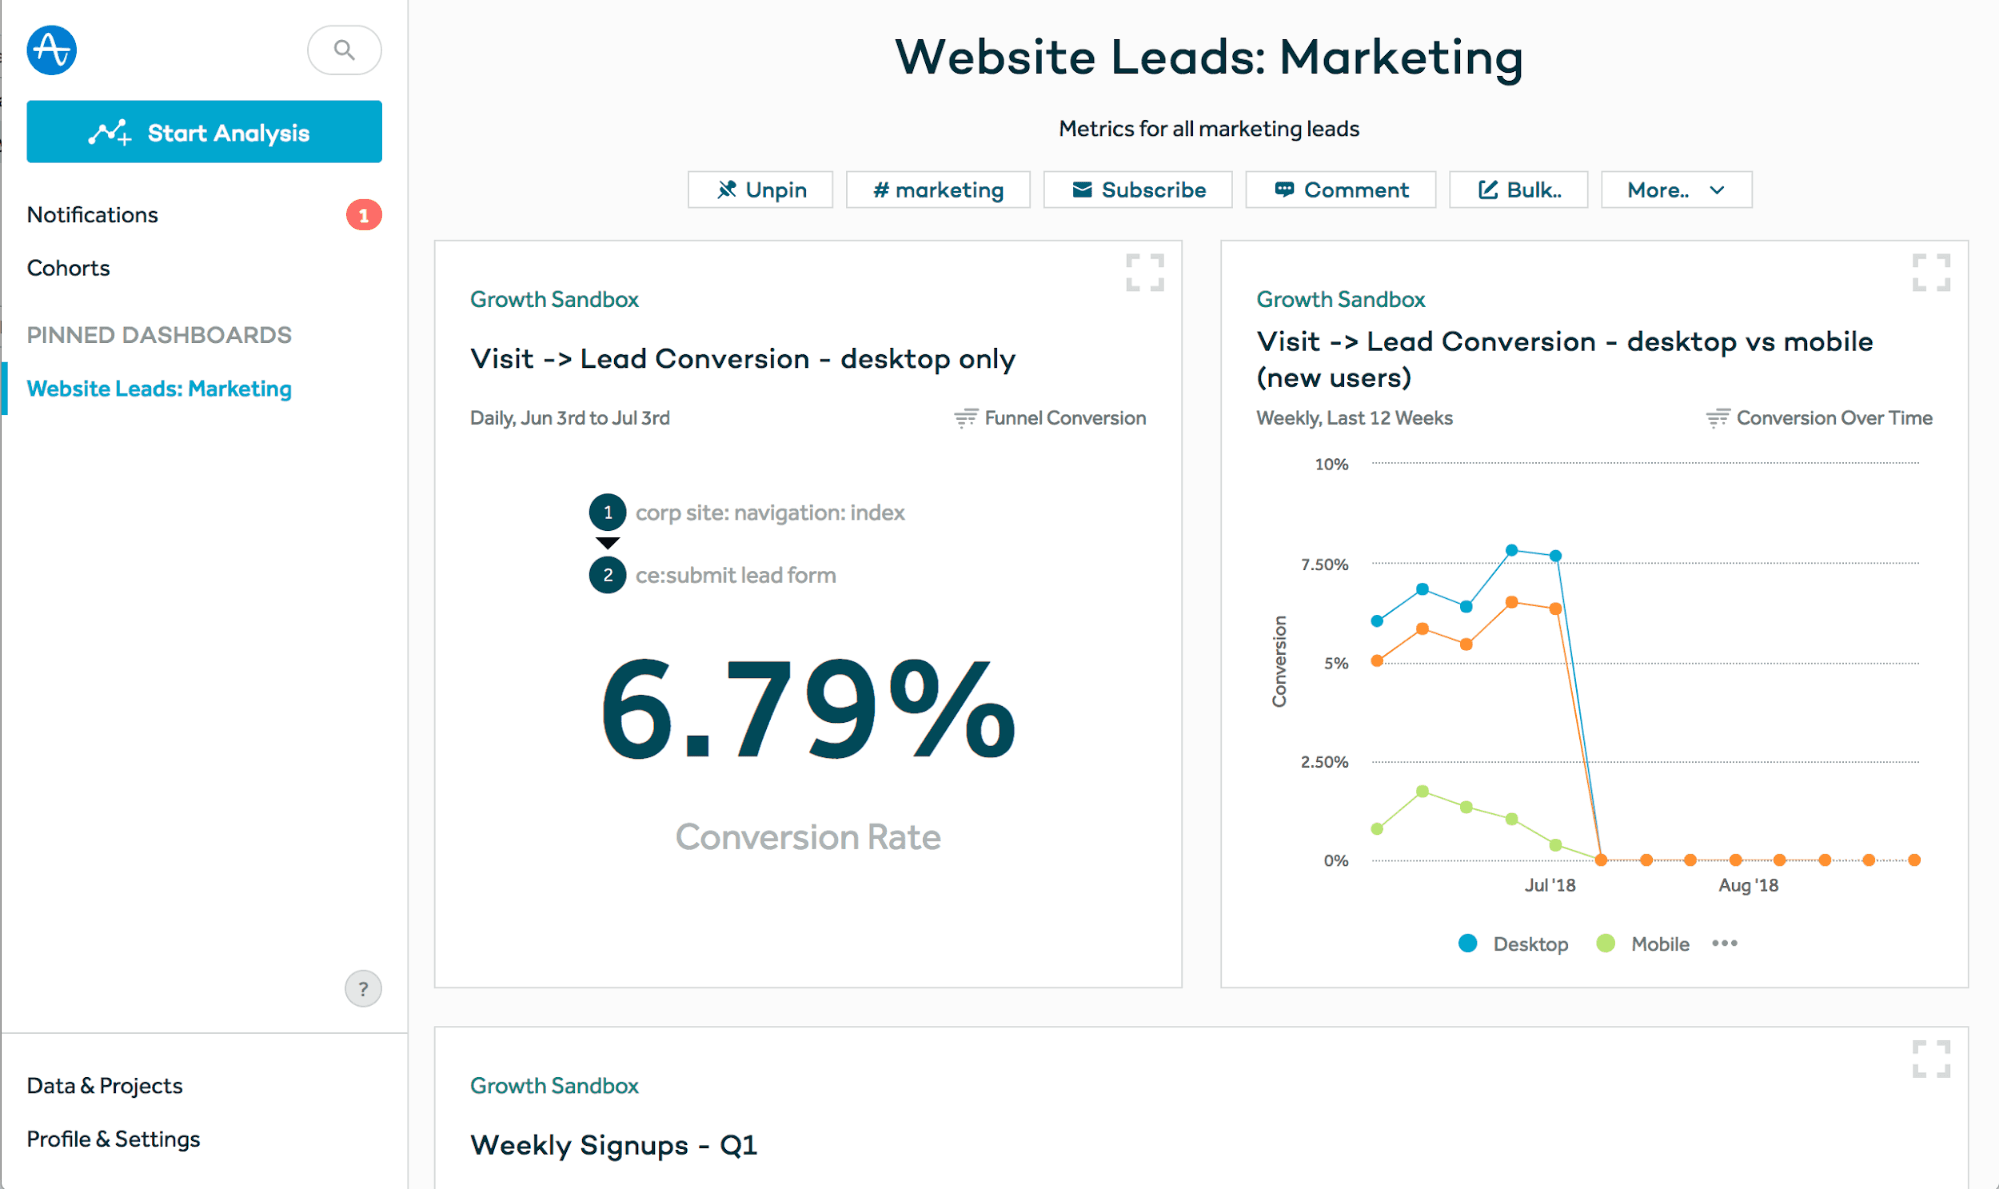
We’re still months away from a full release, but we’re starting to test a new layout for Amplitude that’s designed to put the things you care about front and center, and simplify your workflow. You’ll be able to create charts, dashboards, cohorts, and user lookups all in one place. We’re also consolidating data management and simplifying settings!
A space to share analyses with your team! (Beta)
Available for any organization using Amplitude.
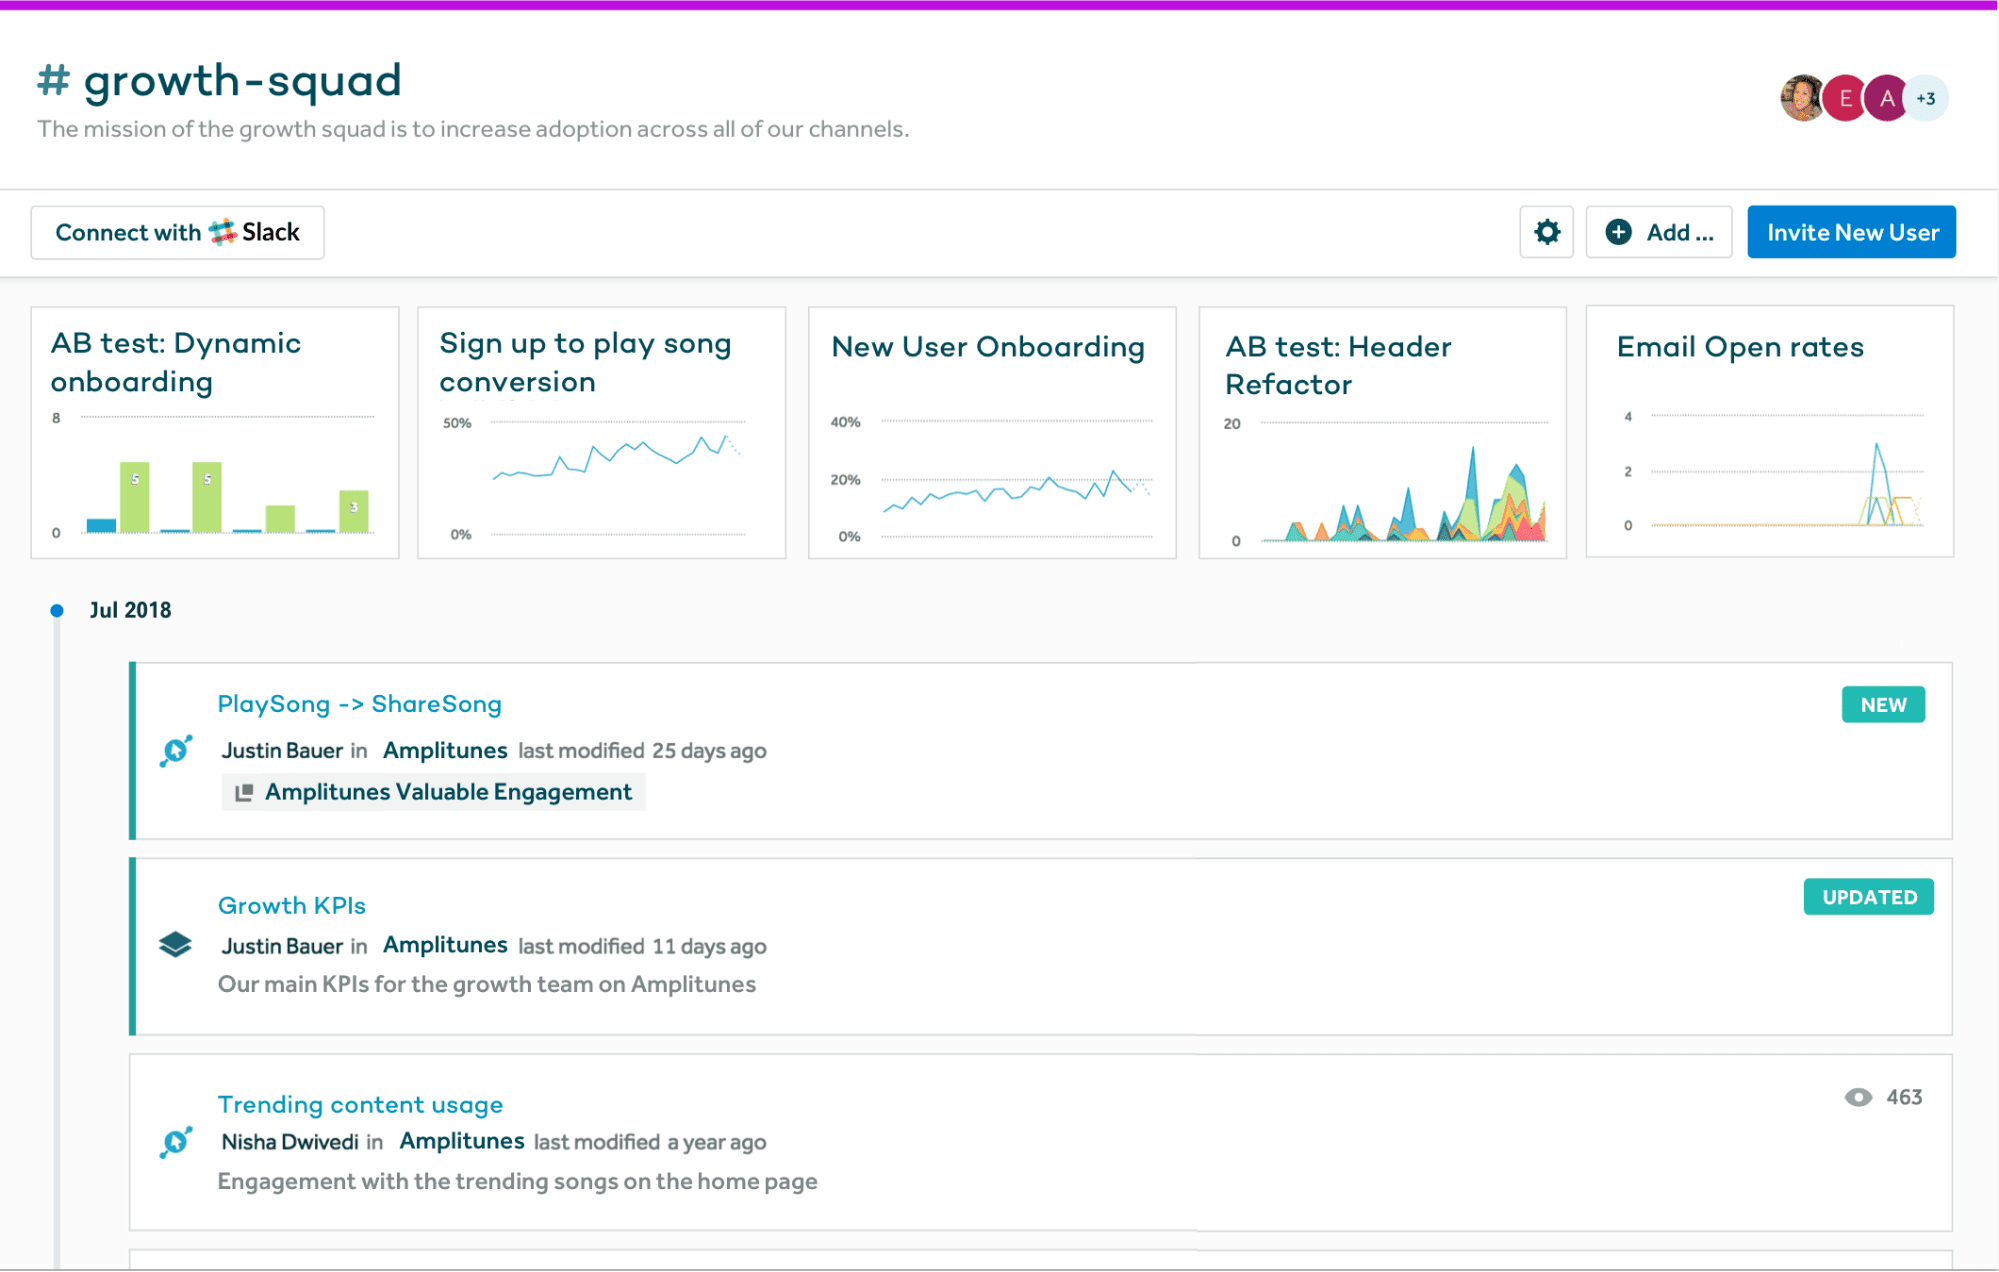
Analytics is a team sport–some of the most valuable analyses are collaborations among teammates. That’s why we’ve been testing out a new feature called Team Spaces to help product teams subscribe to and organize the analyses relevant to them.
Discover how your release is doing without having to create a chart! (Beta)
This Beta is currently available as part of all paid plans.
Understanding the impact of product changes can be a challenge for product teams–especially as new priorities arise. We help reduce the friction of understanding the impact of your product changes by automatically delivering analysis to you for each of your releases.
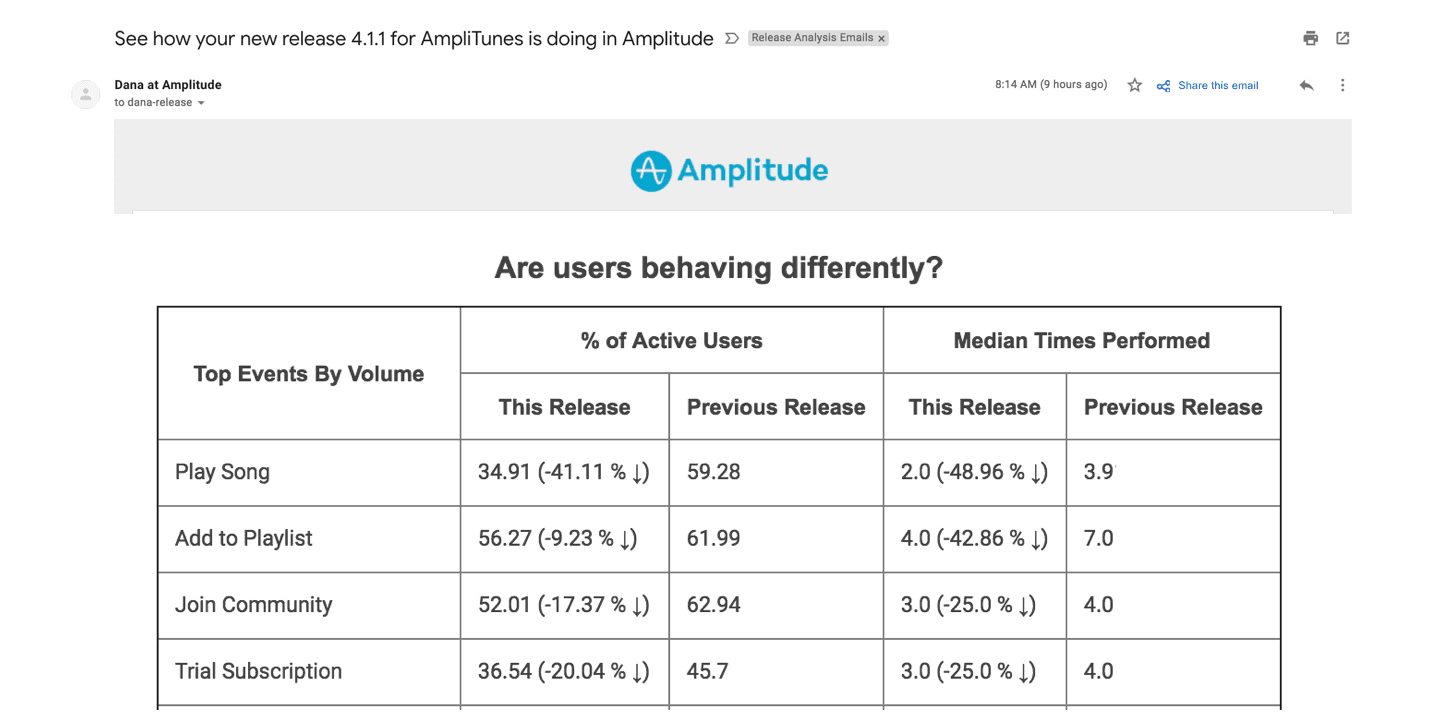
When Amplitude detects a new value for the [Amplitude] Version User Property, we automatically create a “release” in Amplitude and deliver an email with analysis on its rollout that we’ve done on your behalf. See what new events have been captured, which users are performing those events, and even see how behavior has changed between releases. Not using the [Amplitude] Version User Property? Get in touch and let us know how you distinguish product updates in Amplitude.
Example table in an automated email showing how behavior has changed between releases
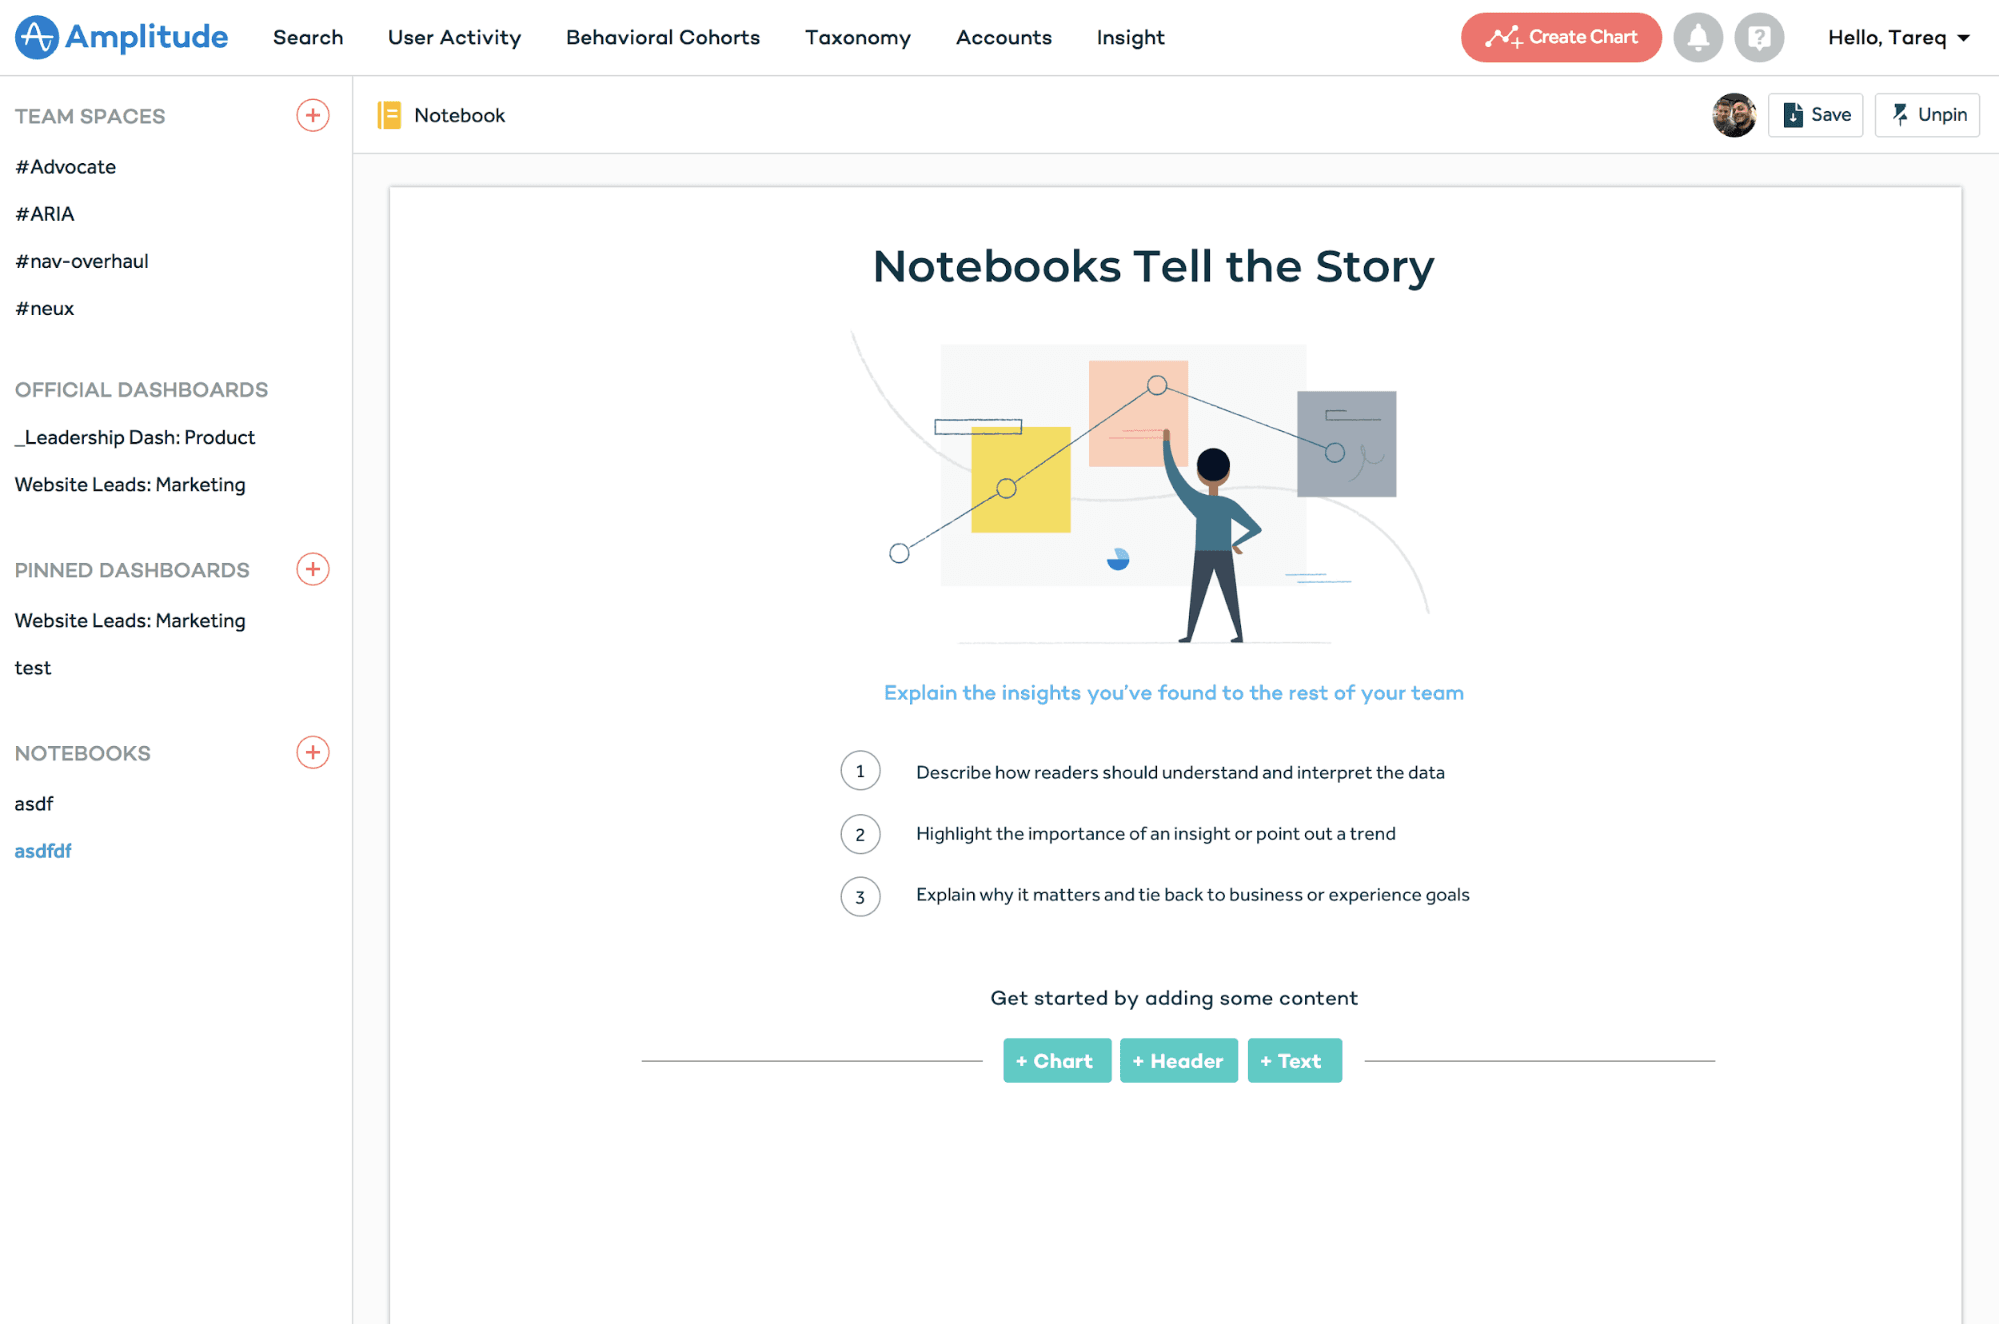
Tell a story with your data with Notebooks! (Beta)
This Beta is available for all paid customers.
Sharing what you learn about user behavior is as important as discovering the insights themselves. Notebooks help you tell the story in your data and share it with your teammates. Unlike Dashboards, which are great for monitoring metrics, Notebooks are documents that combine charts with headers, text, and call-outs so you can communicate the important takeaways to your team. Contact your Success Manager for access!
Target your Braze growth campaigns with more precision! (Beta)
This Beta is available for all paid customers.
Our existing Braze integration is great if you just needed to send a one-time email or push notification to a static cohort of users. But many of our customers wanted to be able to continuously target campaigns at behavioral cohorts that are being updated. We listened, and are about to launch daily and hourly syncing of behavioral cohorts with Braze. This is just the beginning of a number of exciting integrations that we are working on.

Paul Koullick
Former Sr. Product Manager, Amplitude
Paul was formerly on the product team at Amplitude. Previously, product @StrideHealth, product analytics at @Square, and Harvard math & computer science. When not digging into retention curves, Paul likes to play chess and jog along the SF Embarcadero.
More from Paul


