Release Notes: March 2018
Here's what's new in Amplitude as of March 2018.
Our March 2018 product update includes new features to: make Amplitude easier to learn; help product teams measure the impact of feature releases; and support instrumentation and data governance.
1. Make Amplitude easier to learn
We think folks should not have to be a product analytics expert to get value from Amplitude. That’s why one of our focuses this month has been on helping new users get value from the tool (without needing to become event taxonomy experts).
New user onboarding: some basics to help new Amplitude users feel less daunted
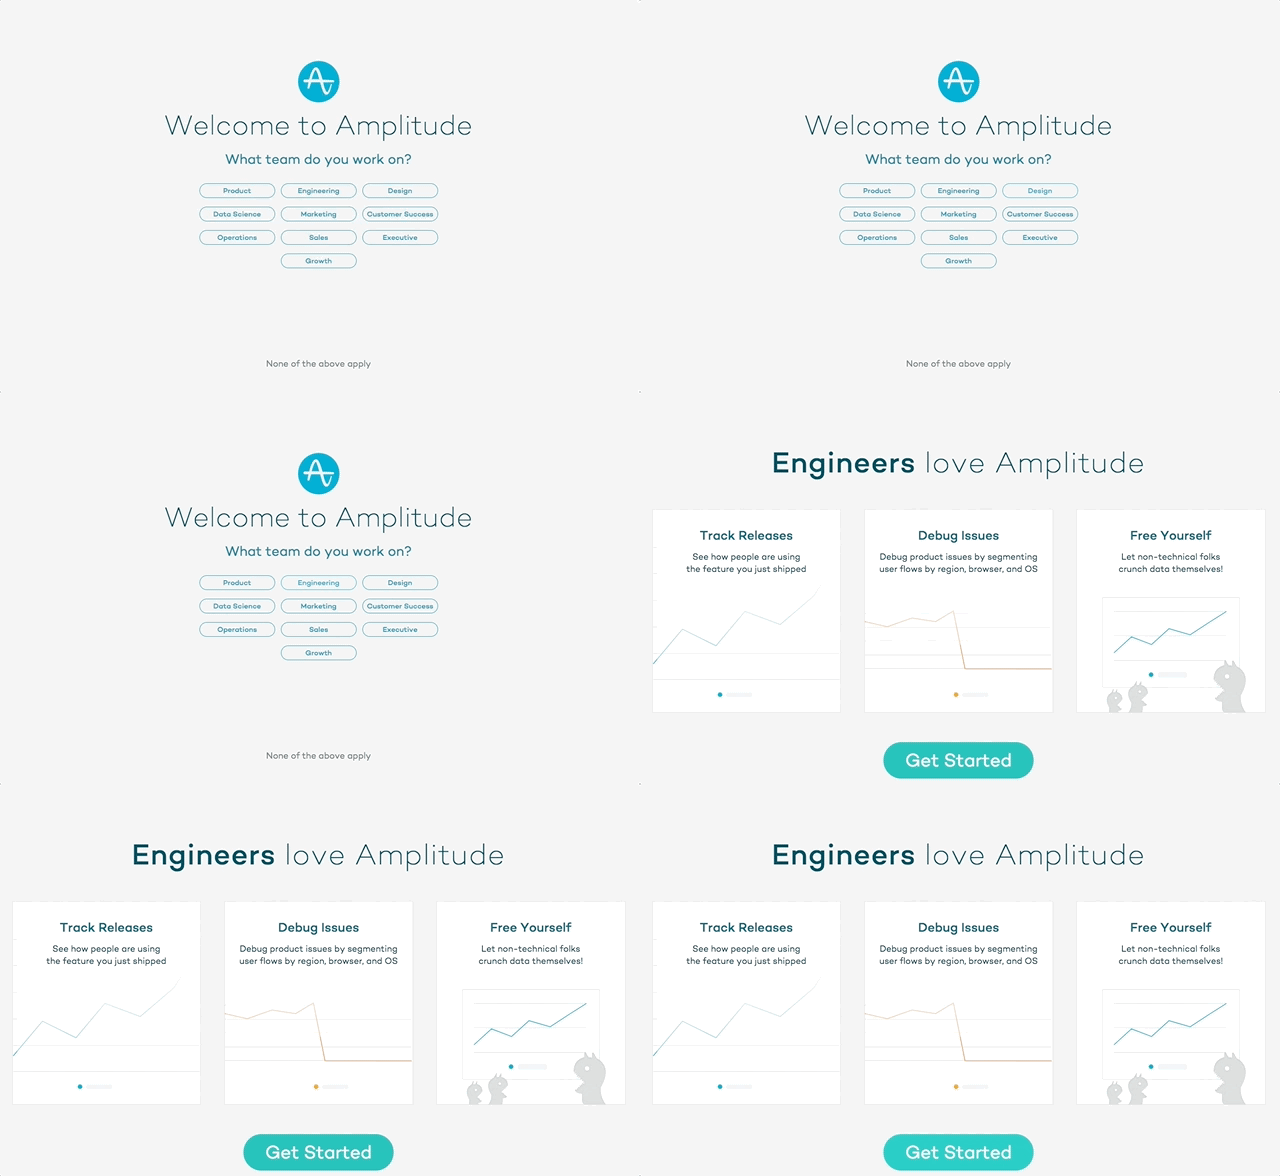
As your organization gets bigger, it’s hard to sit down with every new employee to teach them how to use Amplitude. We’ve added a simple onboarding flow which provides personalized content depending on what team the new user is on.
The onboarding flow helps new users see how Amplitude will help them do their job.
Browse page improvements: so that new users can more easily find and tweak existing charts
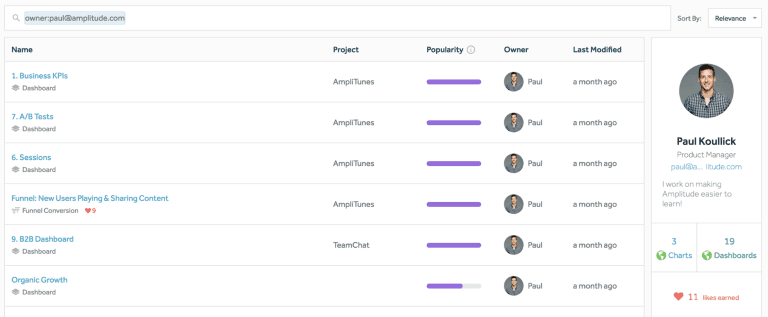
We believe that one of the easiest ways for a new user joining Amplitude to learn how to use the tool is to copy and tweak a co-worker’s chart. That’s why we’re starting to make investments in the Browse page – to make it easier to find other people’s content, rather than having to create every new chart from scratch. Alongside several smaller search ranking improvements and visual cleanup, we’ve made searching for other users more informational by including user profile information in the search results.
Searching for, and copying, a more experienced Amplitude user’s charts is a common behavior that is now easier and more personable.
2. Measure the impact of product changes
We’ve been working on a number of features to better help you measure and share the impact of your hard work!
App New Version Release Notifications
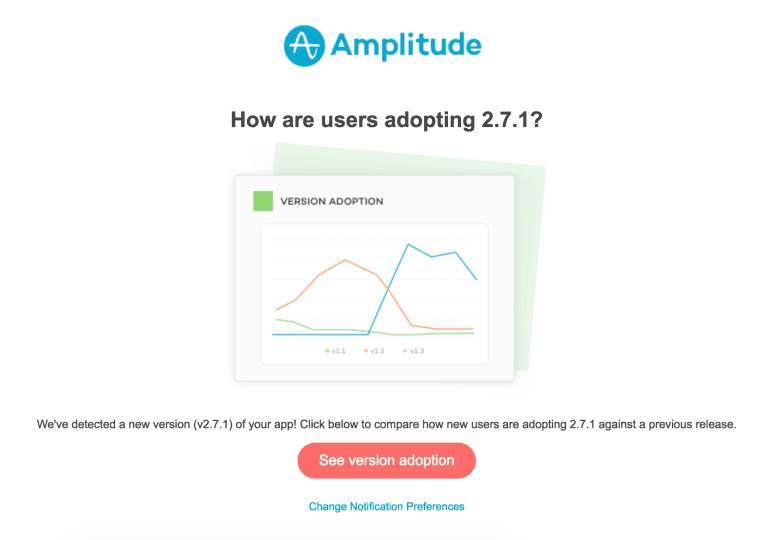
We want to make it easy to understand the impact that your product changes and new feature releases had on users’ behavior. For customers with mobile app products, we’re now able to automatically detect a new version and notify you about the impact of those changes. Stay tuned for more updates on how we’re helping to make this analysis even easier for you in the future!
How did your latest release go? Automatically-generated release emails for mobile apps will remind PMs to find out.
Sorting Version and Start Version by Recency
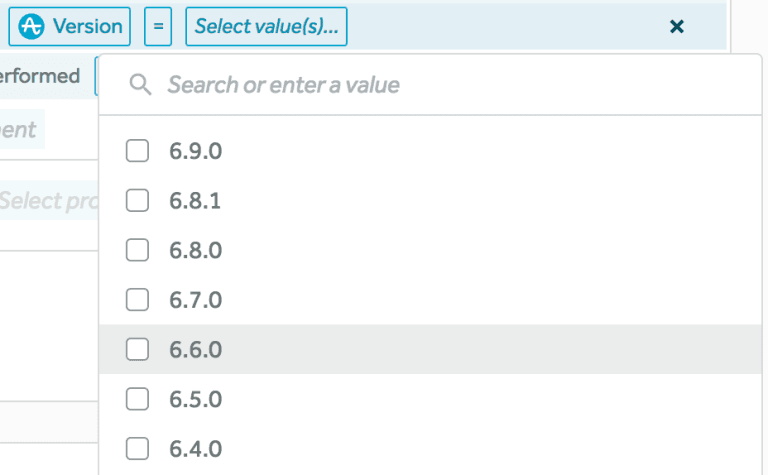
We noticed that it’s hard to filter by the most recent version of your application in Amplitude, so now sorting the Version and Start Version filters by the recency of the release.
Version-over-version analysis is a common Amplitude use case that is now a little easier!
Metrics on Dashboards
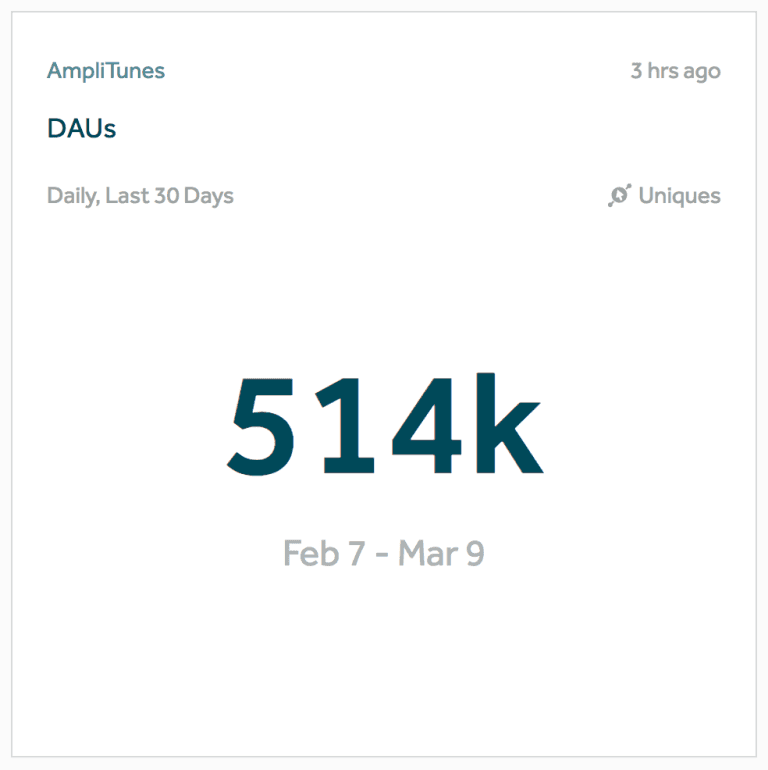
For single-series Event Segmentation Charts on Dashboards, you can now display a KPI-only number for the chart panel, making it easier to visibly track the status of important product metrics!
Sometimes, the metric you need to unify your team is a big number on a dashboard. Now, we have it.
Notebooks
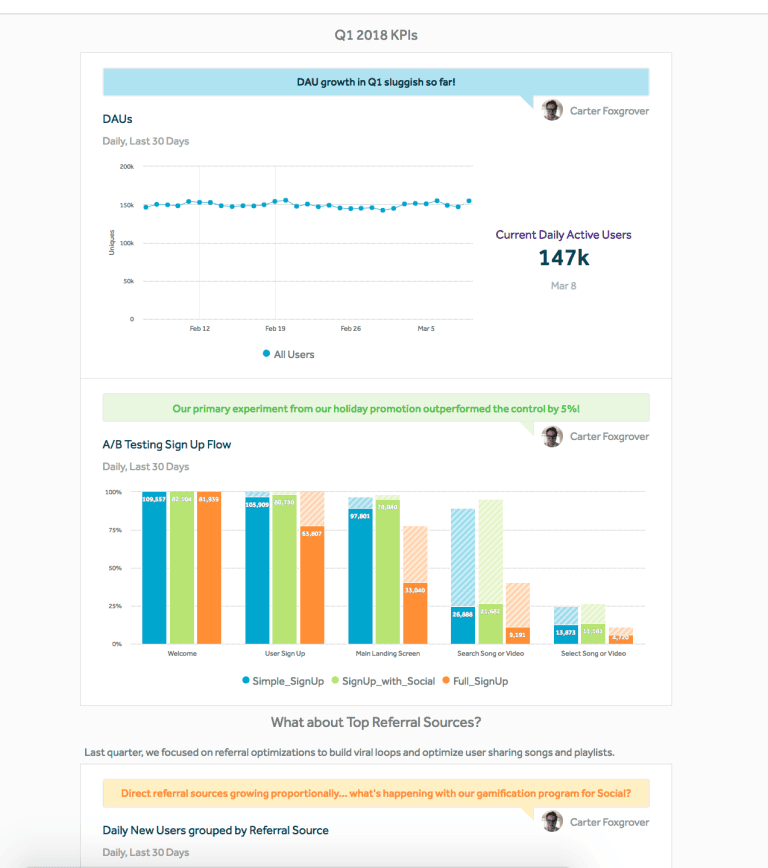
Sharing the insights you uncover into your users’ behavior is as important as discovering the insights themselves! To help you tell the story in your data and share it with your teammates, we’ve launched a beta of our new Notebook format. Unlike Dashboards, which are great for monitoring metrics, Notebooks are documents, combining charts with headers, text, and call-outs, so you can communicate the important takeaways to your team. Please contact us to join the free beta!
This beta feature helps you comment on dashboards to make them feel less like analytics and more like telling a story.
3. Support instrumentation and data governance
Schema will be available as part of the Taxonomy Product Line Extension
Instrumentation planning and ingestion whitelisting for total data governance
How often have you instrumented new event data for Amplitude, only to find a few days or weeks later that it’s incorrect, missing values, or entirely unexpected? Data validation, and ensuring that the data collected in Amplitude is what you intend to collect can be challenging for product-led teams, especially as the number of Projects and contributors increases. We built Schema to give teams total governance over what is collected.
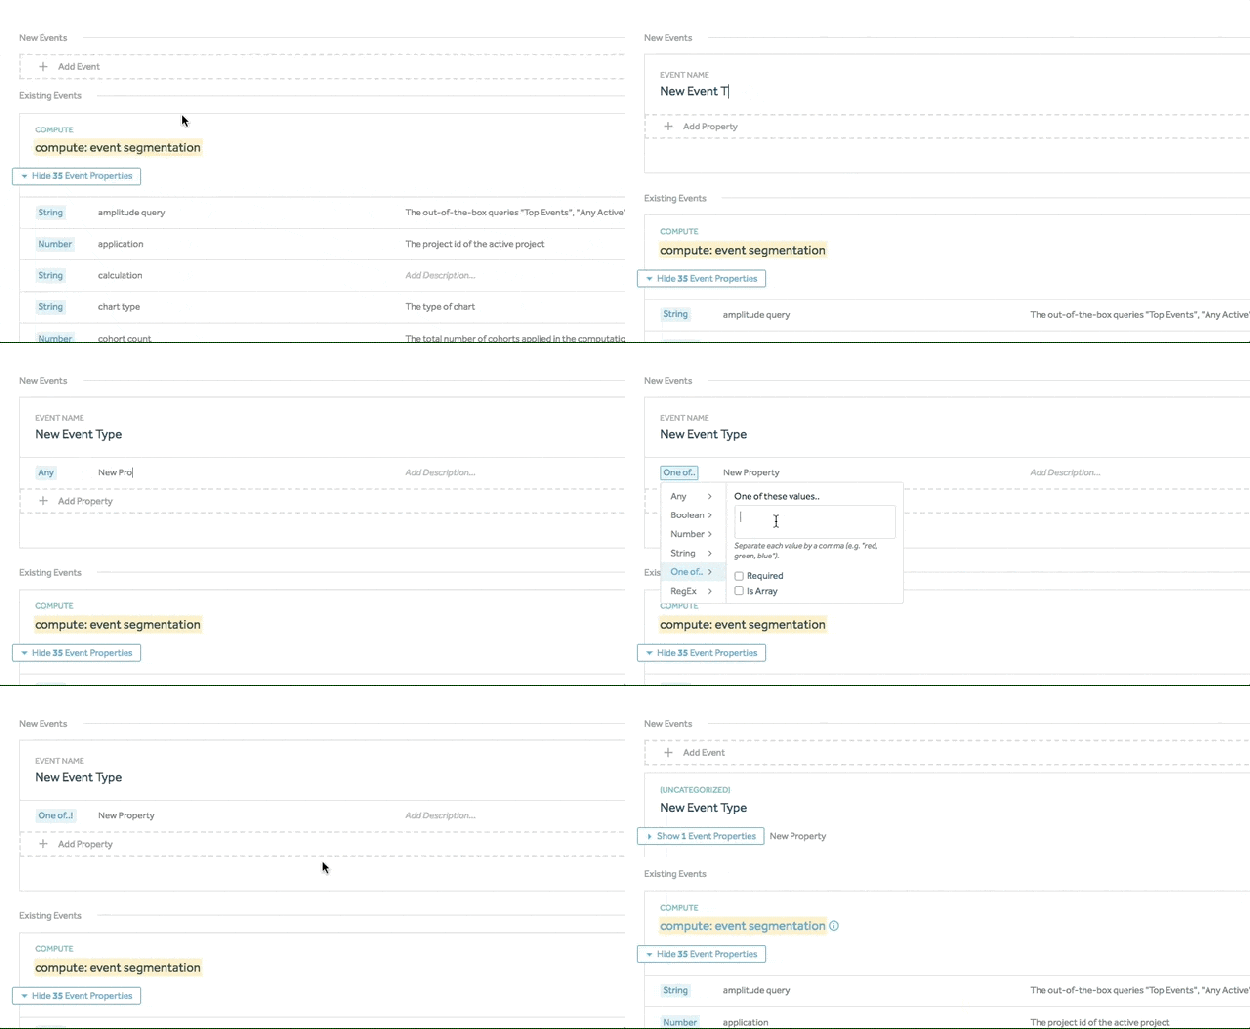
Whether you’re implementing Amplitude for the first time, releasing new features, or want to ensure that your most critical events are never malformed, Schema enables you to plan the Events, Event Properties, and Event Property values you expect to collect. Data that is out-of-spec can trigger a warning and send you a notification – you can even configure a whitelist so that the only data you collect, is the data you want.
Schema makes it easy to plan events and properties.
Schema is also great for giving users on your team context about the events that matter. The new context menu shows you important metadata and links to common analyses to better understand the context of your Events.
User Data deletion API for GDPR compliance and security
Last month, our Chief Development Officer wrote about our commitment to data privacy and the GDPR. In service of that, we’ve built out a new data deletion API to delete the event data stored for Users. In addition to submitting deletion requests, you can also query to look at the status of all current and past requests so you can have confidence that you are respecting the rights of your EU Customers. If you are interested in using the new data deletion API, please contact your Success Manager.
That’s it! Thanks for using Amplitude, and we look forward to continuing to iterate quickly and build the best possible product analytics platform for you. Read previous product updates

Paul Koullick
Former Sr. Product Manager, Amplitude
Paul was formerly on the product team at Amplitude. Previously, product @StrideHealth, product analytics at @Square, and Harvard math & computer science. When not digging into retention curves, Paul likes to play chess and jog along the SF Embarcadero.
More from Paul


