You Can Now do Revenue Data Analysis in the Event Segmentation Chart
Starting in February 2018, we're making it easier to do Revenue Analysis by consolidating it with the Event Segmentation chart.
In an effort to simplify our chart creation experience, we’re consolidating the functionality of the Revenue Analysis chart into the most popular chart – Event Segmentation! Existing Revenue Analysis charts will still be functional but we encourage you to do new revenue-related analysis in the Event Segmentation chart.
The Event Segmentation chart has everything you need!
Don’t worry, you’ll still be able to do the same types of analysis – all without leaving the Event Segmentation chart type. The Revenue event type is now accessible in the Event Segmentation chart type. Simply select it from the dropdown, and use Custom Formulas to do revenue related analysis.
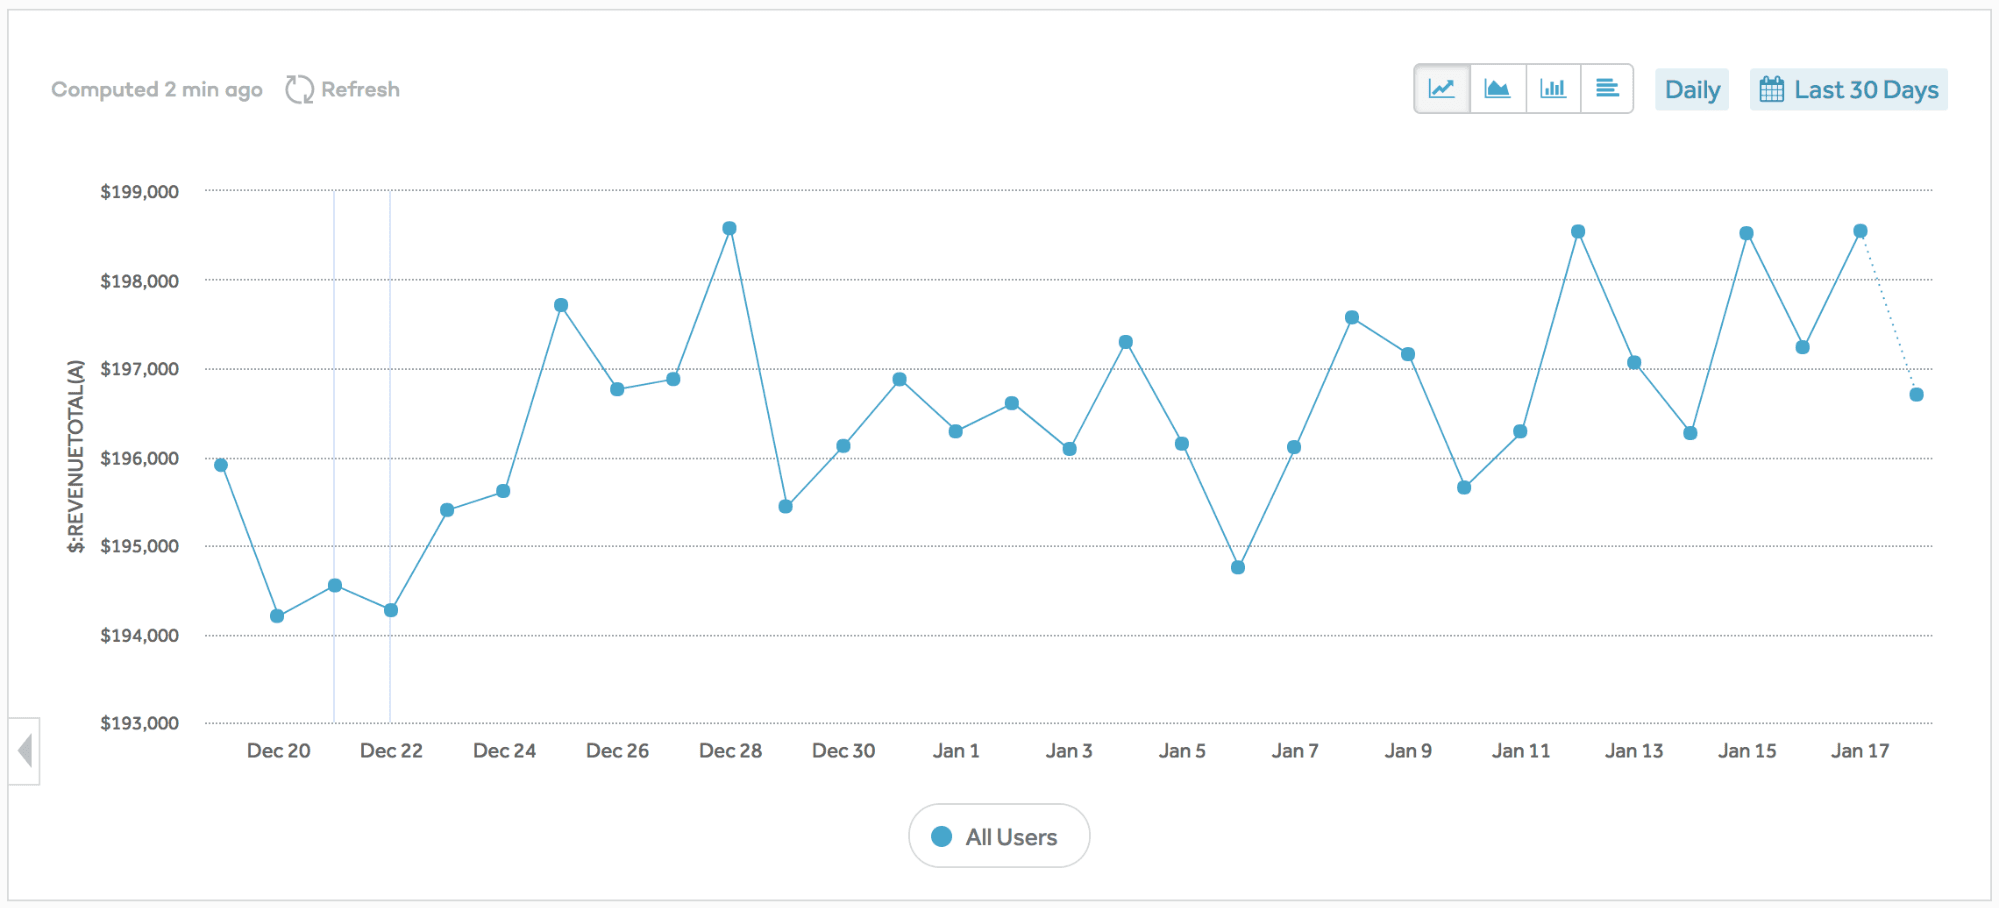
You can now use Custom Formulas to do revenue data analysis in Event Segmentation.

Chart output showing total aggregated daily revenue formatted as a currency.

Below is a mapping of how to do these analyses in the Segmentation Chart Type, where A and B are your revenue event.
Common formulas for revenue data analysis.

*Note: When using the REVENUETOTAL and ARPAU formulas, you’ll need to apply a Group By to your event specifying the numerical event property that you want to sum.
Frequently Asked Questions
- Will I still be able to access my previous Revenue Chart analyses? Yes. Existing Revenue Analysis charts will continue to be accessible and editable, but we encourage you to do all new revenue-data-related analysis in the Event Segmentation chart type.
- Do I have to use Amplitude’s special Revenue event to use these formulas? Nope. You can use the formulas on any numerical event property.
- Is the Revenue LTV chart also getting deprecated? No, it’s not! If you’re using our special Revenue event API to send Amplitude revenue data, you’ll continue to be able to view your LTV analysis in the Revenue LTV chart type.
- Can I also format the y-axis of other charts to be currency? Yes. Just add the “$:” prefix to any existing formula to ensure that the output will be interpreted as a currency, i.e. there will be a “$” on the y-axis.

Paul Koullick
Former Sr. Product Manager, Amplitude
Paul was formerly on the product team at Amplitude. Previously, product @StrideHealth, product analytics at @Square, and Harvard math & computer science. When not digging into retention curves, Paul likes to play chess and jog along the SF Embarcadero.
More from Paul


