Optimize Your Engagement with New Session-based Analysis from Amplitude
Announcing new ways to set up and analyze session-based engagement to better understand how customers are engaging with products

Whether your users are kicking back to watch their favorite streaming movie, enjoying the hottest new online game, shopping online for the holiday season, or wrapping up work on one of your many enterprise apps, the time spent in these digital experiences can say a lot about your customer experience and business performance. In the digital analytics world, we refer to the time spent in-app as session-based engagement, defined as a period of activity in which engagement takes place within these products, across any platform. Digital organizations know that session-based engagement is a critical metric to understand how customers are engaging—or not engaging—with their products. This metric can better inform digital teams about their customers and products, as well as directly tie into your bottom-line revenue.
At Amplitude, we focus on helping customers optimize their digital products and customer experiences with sophisticated behavioral insights. To help customers unlock powerful session based insights, we’re making it even easier to analyze session-based engagement, with new tools and simpler ways to set up session engagement analysis regardless of how their data is instrumented.
Improve How You Measure Session Engagement
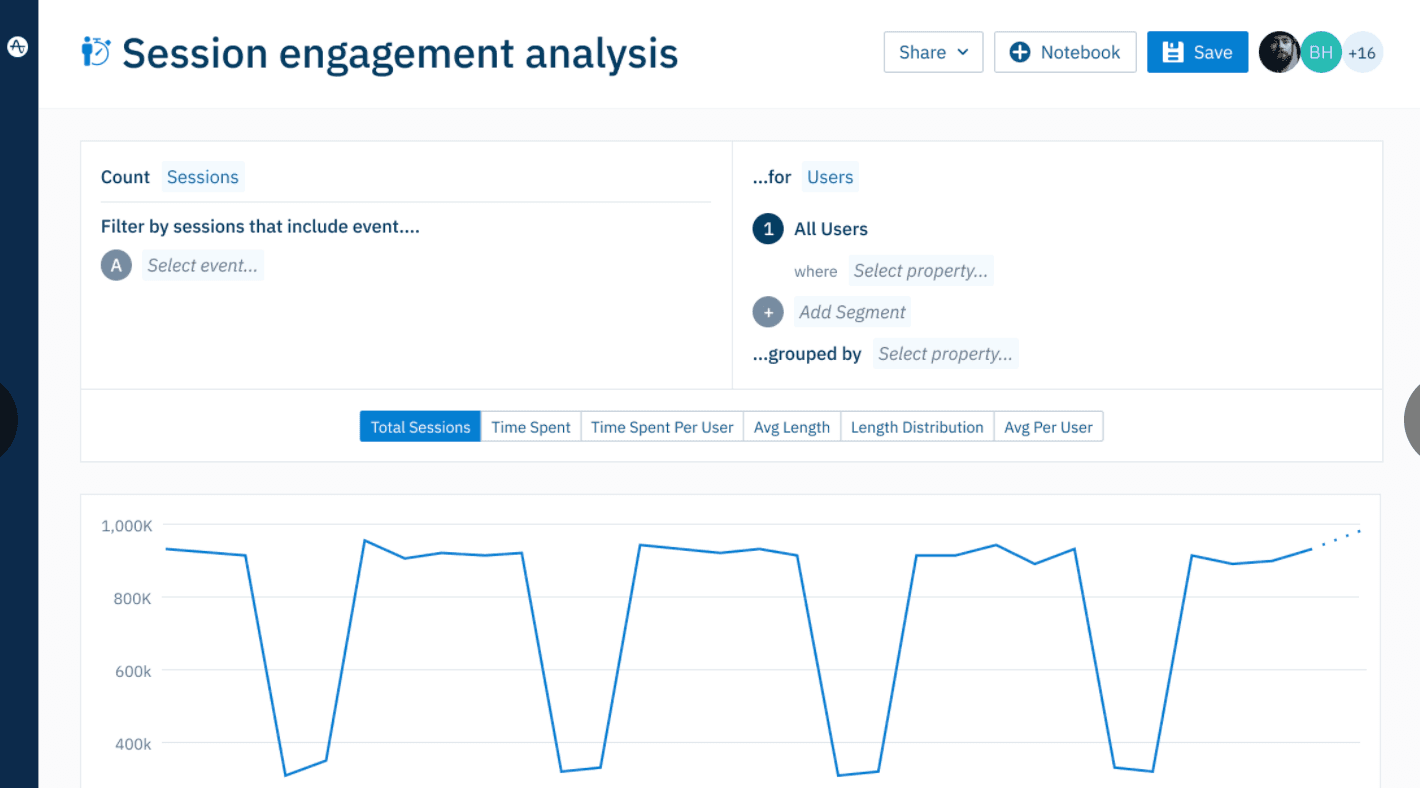
To unlock powerful session engagement insights, we recently introduced more ways to measure engagement per session, as well as flexible options to bucket your session activity. With our User Sessions chart, all teams using Amplitude – from product managers to marketers and analysts – can now answer a broader set of the questions, such as:
Which sessions are leading customers to the important outcomes?
New filters let you identify your most important sessions, such as making a purchase or subscribing to your favorite online service. Identifying these types of time spent metrics can provide some of the most valuable insights to engagement focused teams and help organizations better understand what sessions are driving key business outcomes in your products.
How many times did key actions occur in a particular session?
New session engagement metrics also let you measure the number of times a key action or a particular event of interest occurs within a session in order to better monitor in-session engagement over time. You can measure feature engagement in session using new chart views that include average engagement per session, total engagement across sessions, or a distribution of sessions based on engagement.
What does my user engagement look like?
Amplitude’s flexible bin sizes allow organizations to identify and cohort users that are heavily engaged or bouncing from your product in order to dig in deeper to understand what’s driving behavior. Organizations can also apply the created cohorts to further their analyses in Amplitude and test working hypotheses around what’s driving users to actively engage with your product or bounce.
New Ways to Set Up User Sessions
Behavioral user data today comes from multiple sources, which means many customers rely on multiple data platforms or repositories—think Segment, mParticle, Snowflake—to manage this inflow of user data. With more companies leveraging their own data pipelines, We want to ensure support for session based analysis regardless of the data source and without requiring complex SDK instrumentation. Now, customers have new “out of the box”’ ways to define a session retroactively in Amplitude. These include grouping events by custom properties you associate as a session, custom session timeouts and even start-end events to associate when a session begins and ends.
Additionally, we are adding support for our Pathfinder charts in Amplitude to group periods of activity based on how you set up user sessions, as well as increasing the number of user flow steps from 15 up to 50 steps. These new updates will be available to all customers as part of our public beta starting today. To get started, check out our product documentation on session tracking here.
Gamestry, a Spanish based gaming video platform uses Amplitude to better understand how their creators use the platform to share on-demand gaming videos and engage with their viewers. By unlocking session engagement analysis, Gamestry can now quickly dig into how engaged their viewers are, and what types of in-session experiences lead to higher retention along with meaningful ways to grow their product for both viewers and creators. With session-based insights from Amplitude, Gamestry can focus on building an amazing video streaming experience for its gaming community.
Accelerate Time-to-Insights with Amplitude
With these updates to session based analysis, we’re making it even easier to enrich your pre-existing data sets in Amplitude and make them more consumable and actionable. Amplitude now lets you easily plug into your existing customer data stack, understand complex end-user behavior and quickly generate session engagement insights that inform better decisions about your digital products.
Want to learn more about bridging the gap from legacy web analytics to best-of-breed product analytics? See how Amplitude helps teams go beyond page views to deliver sophisticated behavioral insights that connect to your bottom line revenue and helps you make better product decisions. Interested in learning more about Amplitude? Schedule a demo with our team today.

Nikhil Gangaraju
Director, Product Marketing, Amplitude
Nikhil is a product marketer at Amplitude focusing on Amplitude Analytics and works with teams to advance our mission to help companies build better products.
More from Nikhil


