The COVID-19 Digital Report: 15 Trends Across 600 Applications
Explore the original data from Amplitude to see how shifts in consumer behavior changed everything about how people use digital products.
As the CEO of a company that serves over 40,000 digital products, I routinely talk about sea changes affecting our customers. Digital trends can take years of buildup and several waves to reach ubiquity. COVID-19 changed that pattern overnight. Today, Amplitude is sharing our digital report quantifying this impact.
From early February to early May, customers sent Amplitude 44% more event data. The team has been hard at work making sure our systems perform without a glitch, and that our customers can do the important work they need to do.
It is difficult to fathom the magnitude of this change. Imagine a startup experiencing Cyber Monday or a publicity windfall or a competitor launching a surprise product for the first time. Now imagine this happening each week. Things are moving that fast.

As part of our goal to continue helping our community during these times, we wanted to share with you this critical data, found below, on the state of digital products across industries and provide context on how businesses are responding to the changing winds. Amplitude is in a unique position to observe these trends across our behavioral dataset, which comes from thousands of products with billions of users from over 180 countries.
What the Data Show
To better understand what’s happening, we looked at anonymized digital product usage data from over 600 products across five industries — consumer tech, B2B SaaS, streaming media, ecommerce and marketplaces, and Fintech.
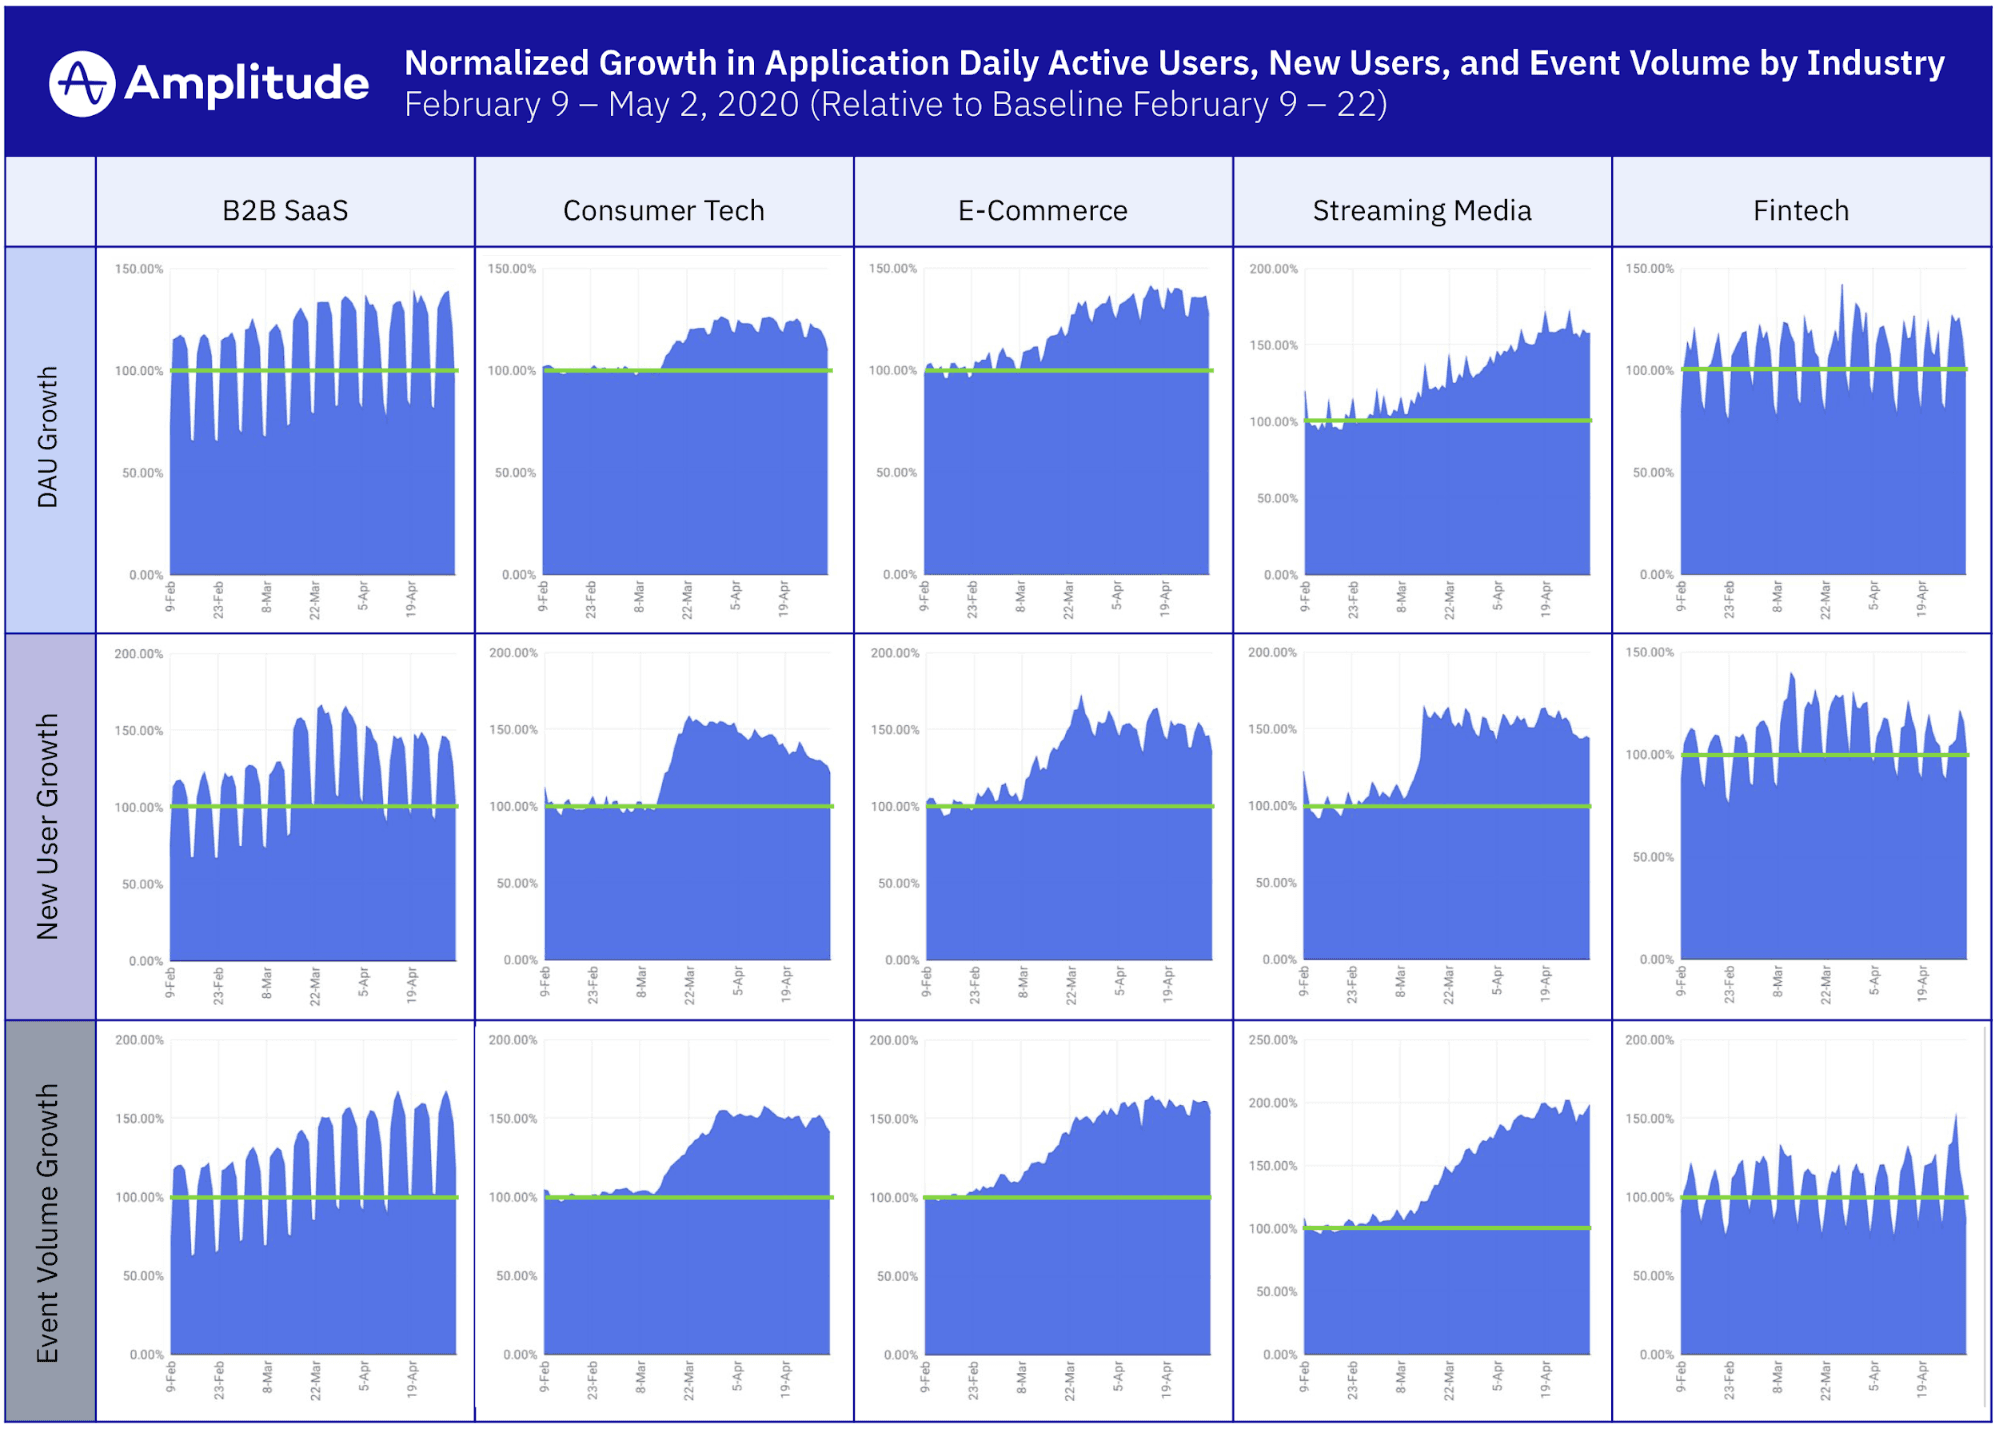
We started our analysis time frame on February 9 before most of the world imposed travel bans and shelter-in-place policies. We used the period between February 9 and February 22 as a baseline. After filtering out trials, newly onboarded customers, and applications with anomalous increases and decreases in event volume, we normalized key metrics on the application level so we could compare growth rates between small and large products, and growth trends between industries.
Note: For this analysis, we reviewed aggregate data for daily active user, new user, and event volume data for 600 onboarded, non-trial, in-production applications grouped by industry. % increase/decrease represents change relative to the 14d average from the start of the period (Feb 9-Feb 22)

We observed unusual growth compared to the monthly average across all five industries, but some more so than others. The inflection point also varied by industry. The shifts were unprecedented, and diving into the data only cemented how differently consumers are behaving.
Ecommerce was the first to accelerate in late February as consumers started to become wary of larger gatherings and many physical store locations started to close. Consumer tech and media accelerated in early March followed by B2B SaaS in mid March. The Fintech industry overall didn’t see a clear sustained inflection point.
B2B SaaS: Mid-March Inflection Point
The near ubiquitous movement to remote work and the need for digital tools to collaborate are top reasons behind why we see growth in B2B SaaS. These tools either were being purchased for the first time to fill a void (e.g. no more in-person meetings or conferences) or the product was in-use prior to February but “the shift” accelerated rapidly. The world is embracing entirely new collaboration patterns, an intuitive observation that is clearly confirmed by the data.
- Average DAUs (daily active users) grew by 19% between mid and late March. This growth has sustained into May. Collaboration-first SaaS tools tripled active users in March.
- DNUs (daily new users) saw a spurt of growth in March peaking at as much as 72% above the baseline with an average change of 48% after shelter-in-place orders began.
- Overall usage in terms of actions (event volume) saw a sustained increase of 41% on average
Consumer Tech: Early March Inflection Point
- Average DAUs grew by 21% between early and late March. This growth has sustained into May.
- DNUs saw an immediate spurt of growth in March peaking at as much as 58% above the baseline with an average change of 40% after shelter-in-place orders began.
- Overall usage in terms of actions saw a sustained increase of 50% on average.
Ecommerce: Late February Inflection Point
As noted, consumer behaviors for shopping changed more rapidly than any other industry. The need for physical goods didn’t change — the ability to buy them in person as well as the possible fear of doing so caused a shift to digital options.
- Average DAUs grew by 33% between late February and mid April. This growth has sustained into May.
- DNUs saw an immediate spurt of growth in February peaking at as much as 73% above the baseline with an average change of 48% after shelter-in-place orders began.
- Overall usage in terms of actions saw a sustained increase of 55% on average.
Streaming Media: Early March Inflection Point
As shelter-in-place orders became prevalent and in-person live events, movie theaters, bars, restaurants, and cafes closed, consumer entertainment preferences pivoted to their over-the-top media services.
- Average DAUs grew by 52% between early March and mid April. This growth has sustained into May.
- DNUs saw an immediate spurt of growth in March peaking at as much as 64% above the baseline with an average change of 52% after shelter-in-place orders began.
- Overall usage in terms of actions saw a sustained increase of 86% on average — the highest across all industries.
Fintech: No Clear Inflection
A shift to ubiquitous digital banking is inevitable, yet how we bank and invest has not necessarily been impacted by COVID-19: The data show that the pandemic hasn’t been a catalyst for consumers to suddenly start or increase ebanking.
- Average DAUs grew by 6% between early March and mid April.
- DNUs saw a spike of growth in early March peaking at as much as 41% above the baseline with an average change of 17% after shelter-in-place orders began.
- Overall usage in terms of actions saw a small increase of 6% on average — the lowest across all industries.
Your Mileage May Vary
Individual companies within each of these industries may have seen wildly different patterns based on the types of content they offer and the level of digital collaboration they provide.
For example, within industries we observed context-specific patterns:
- Some subgroups of consumer tech companies like physical goods delivery companies grew DAUs by over 10x in the span of two weeks as shelter in place was instituted.
- Our subgroup of media companies that stream live events saw a steep decline while our subgroup of on-demand content platforms saw over 400% DAU growth versus the baseline.
If your company is experiencing unprecedented shifts in usage, know you are not alone.
What We Learned
Our intuition about consumers’ shifting behavior didn’t prepare us for what the data revealed. We’ve seen changes in digital product usage that are orders of magnitude more impactful than we imagined. This was particularly surprising and humbling for our team given that we’re a data analytics company.
This analysis covers only the first nine weeks of what will be a sustained change. All previous bets about the speed of digital transformation are off, and the data show it will only get faster.
We will be publishing observations like these on the continued impact of this digital acceleration at a systemic and industry level over the next few months. If you are interested in collaborating with us, please write to press@amplitude.com.

Spenser Skates
CEO and Co-founder, Amplitude
Spenser is the CEO and Co-founder of Amplitude. He experienced the need for a better product analytics solution firsthand while developing Sonalight, a text-to-voice app. Out of that need, Spenser created Amplitude so that everyone can learn from user behavior to build better products.
More from Spenser


