
10 Million Events a month. Completely Free.
Analytics is often the single largest infrastructure expense for a company[][][].
We’ve been taught to pay for analytics linearly by data volume: see and . This is bad for product managers and bad for analytics culture. Paying by event volume discourages you from tracking everything you want to. You’re effectively performing a cost benefit analysis with every event you instrument.
It’s hard to imagine people still doing this 10 years from now. I no longer worry about how much storage my email is using or how many minutes I have left this month on my cell phone plan.
As a step in that direction, I’m incredibly excited to announce that for the first time today, Amplitude is giving away 10 million events a month, completely free. That’s right – what other providers charge $1,000 a month for, we’re providing at no cost. That’s more than 20x the volume of any other free plan out there.
And we can also scale. Amplitude now tracks 25 billion events a month, with multiple customers analyzing billions of events themselves with ease. Even have limits – one of our first customers came to us because they were kicked off of Google Analytics for tracking too much data.
We can scale to such data volumes because we’ve developed a custom stack that allows us to answer complex queries through processing and aggregating data across memory and disk in a number of different ways.. We’ll share more details about how our stack works soon (honestly, we haven’t had time in preparation for today’s launch!), but the short of it is we’ve been hard at work developing a distributed query engine over the last 3 years. Not only does it scale efficiently, it’s incredibly fast over large volumes of data. We’ll be publishing more details about how we’re able to give away 10 million events a month for free in the coming weeks.
Introducing the Behavioral Layer
In addition to giving away 10 million events for free, we’re also announcing a new way to think about analytics.
Analytics has historically come in two forms- raw data from individual users or high-level dashboards, like a conversion funnel or a retention chart. Want to analyze data outside of that and you have to go to your big data/data warehousing platform of choice.
Looking at individual user data is good; it gives you a qualitative feel for what each user is doing in your product. However, it’s impossible to look over all your user data- if you had infinite time maybe you could accomplish it. On the other end of the spectrum, dashboards give you important high-level information. Knowing that your day 7 retention is at 10% is incredibly important. (See: . . .) But what if you want to know what leads a user to retain or churn? As a product manager, the one thing that matters is the difference between users who engage and users who don’t. Analytics offerings today give insight into what your retention is, but they don’t give any insight into why it’s happening or what you can do to improve it.
We can do better than raw data and static dashboards. Let me introduce you to the Behavioral Layer:
The behavioral layer is the rich layer between reporting dashboards and raw user data that reveals patterns of user behavior inside your app. Unlocking is the key to understanding your users and driving growth.
Finding your product’s ‘a-ha’ moment
Facebook famously found that adding seven friends in 10 days led to long-term retention. Focusing on that was the a 250 billion dollar market cap, and avoiding the fate of Myspace. .
One way to get at this kind of insight is through behavioral cohorts. Traditional cohorts are based on acquisition date. Behavioral cohorting allows you to group users by what actions they’ve performed.
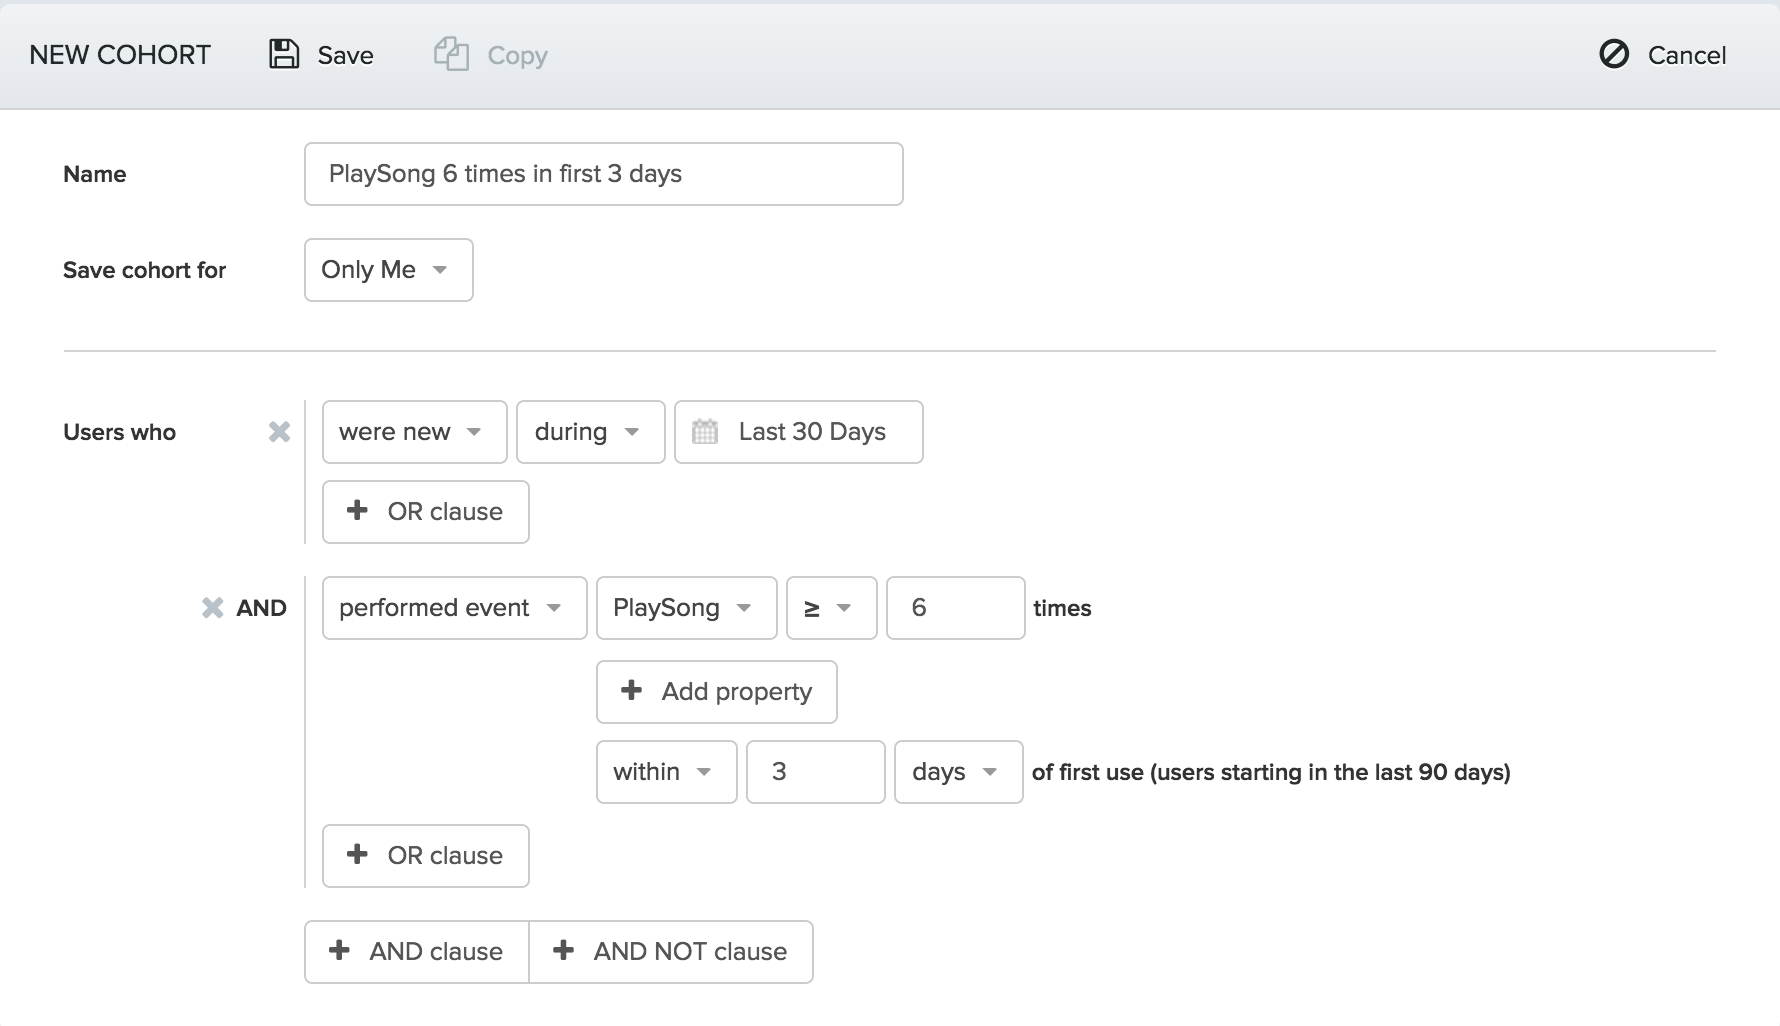
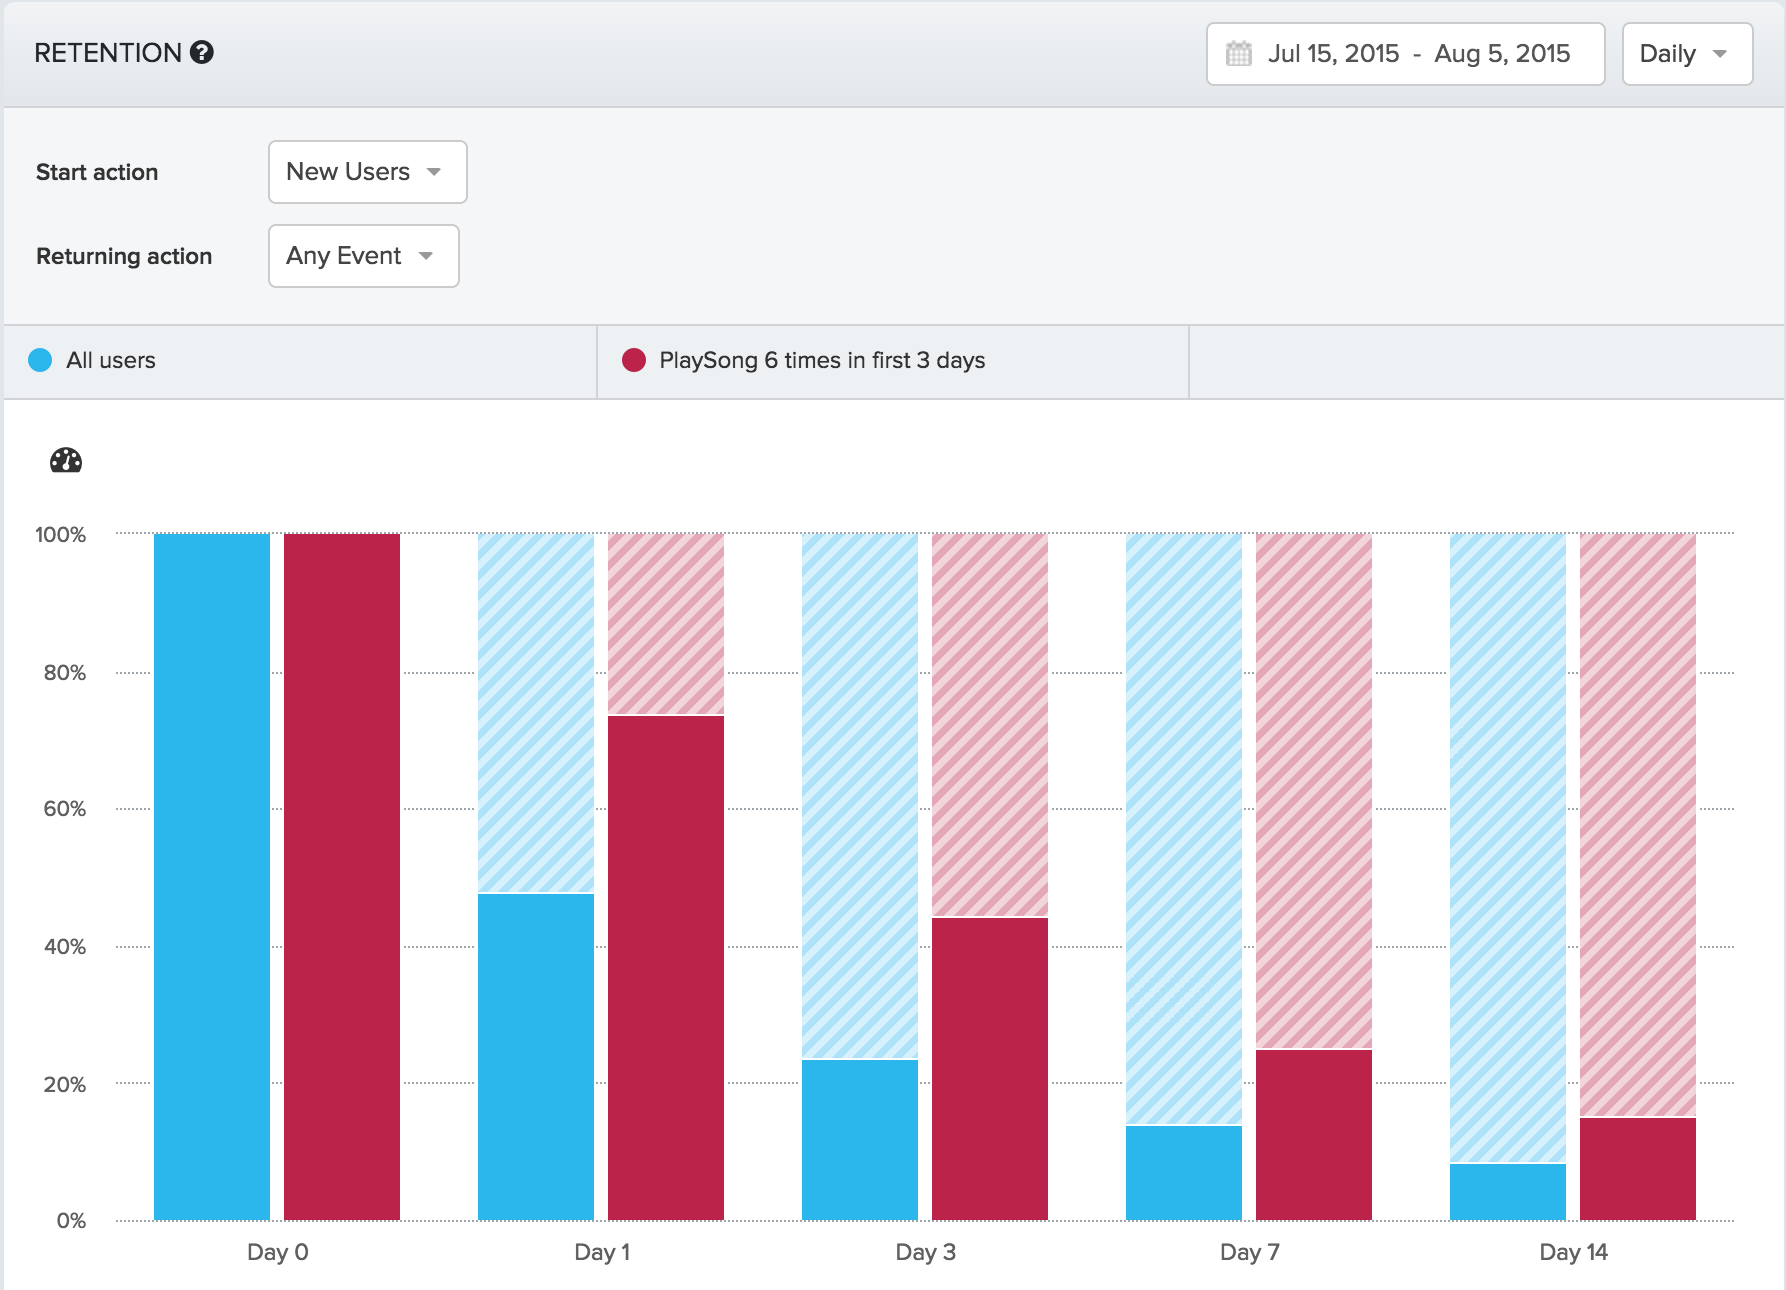
You can then apply that behavioral cohort to a retention graph to see how a user’s behavior at the start impacts their long term retention and find the moment where your users understand your core product value, the ‘.
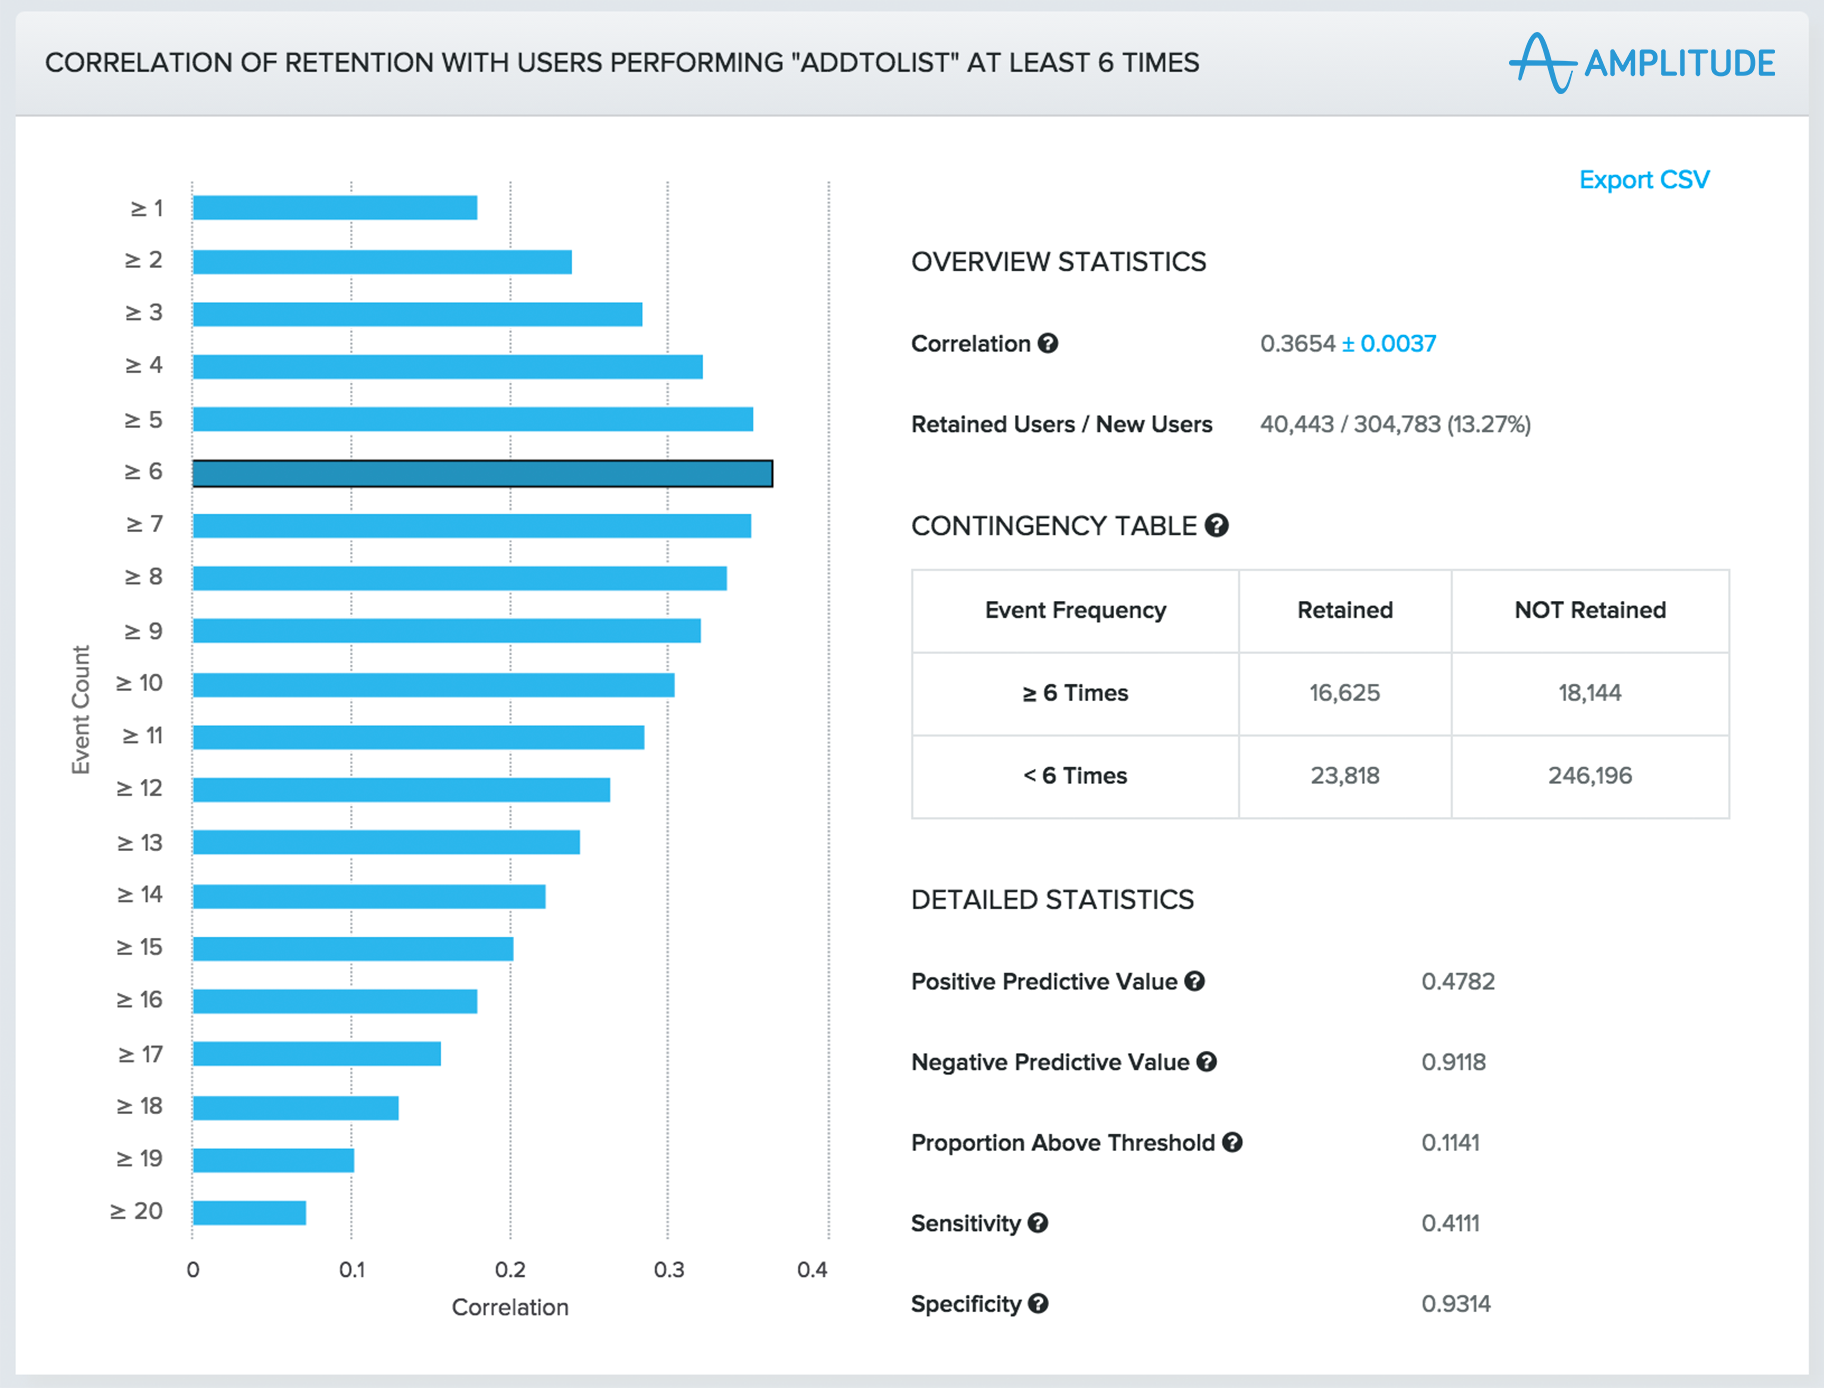
Behavioral cohorting allows us to test a hypothesis quickly. But what if you don’t know which events are key to growth, or want to look across multiple permutations of events performed and time periods? The Growth Discovery Engine does just that. It helps you explore all of the possible ‘a-ha’ moments within your user data and zero in on the best candidates at the click of a button. What used to take a data science team weeks can now take anyone hours, allowing you to quickly zero in on the behaviors that are
Diving into the data
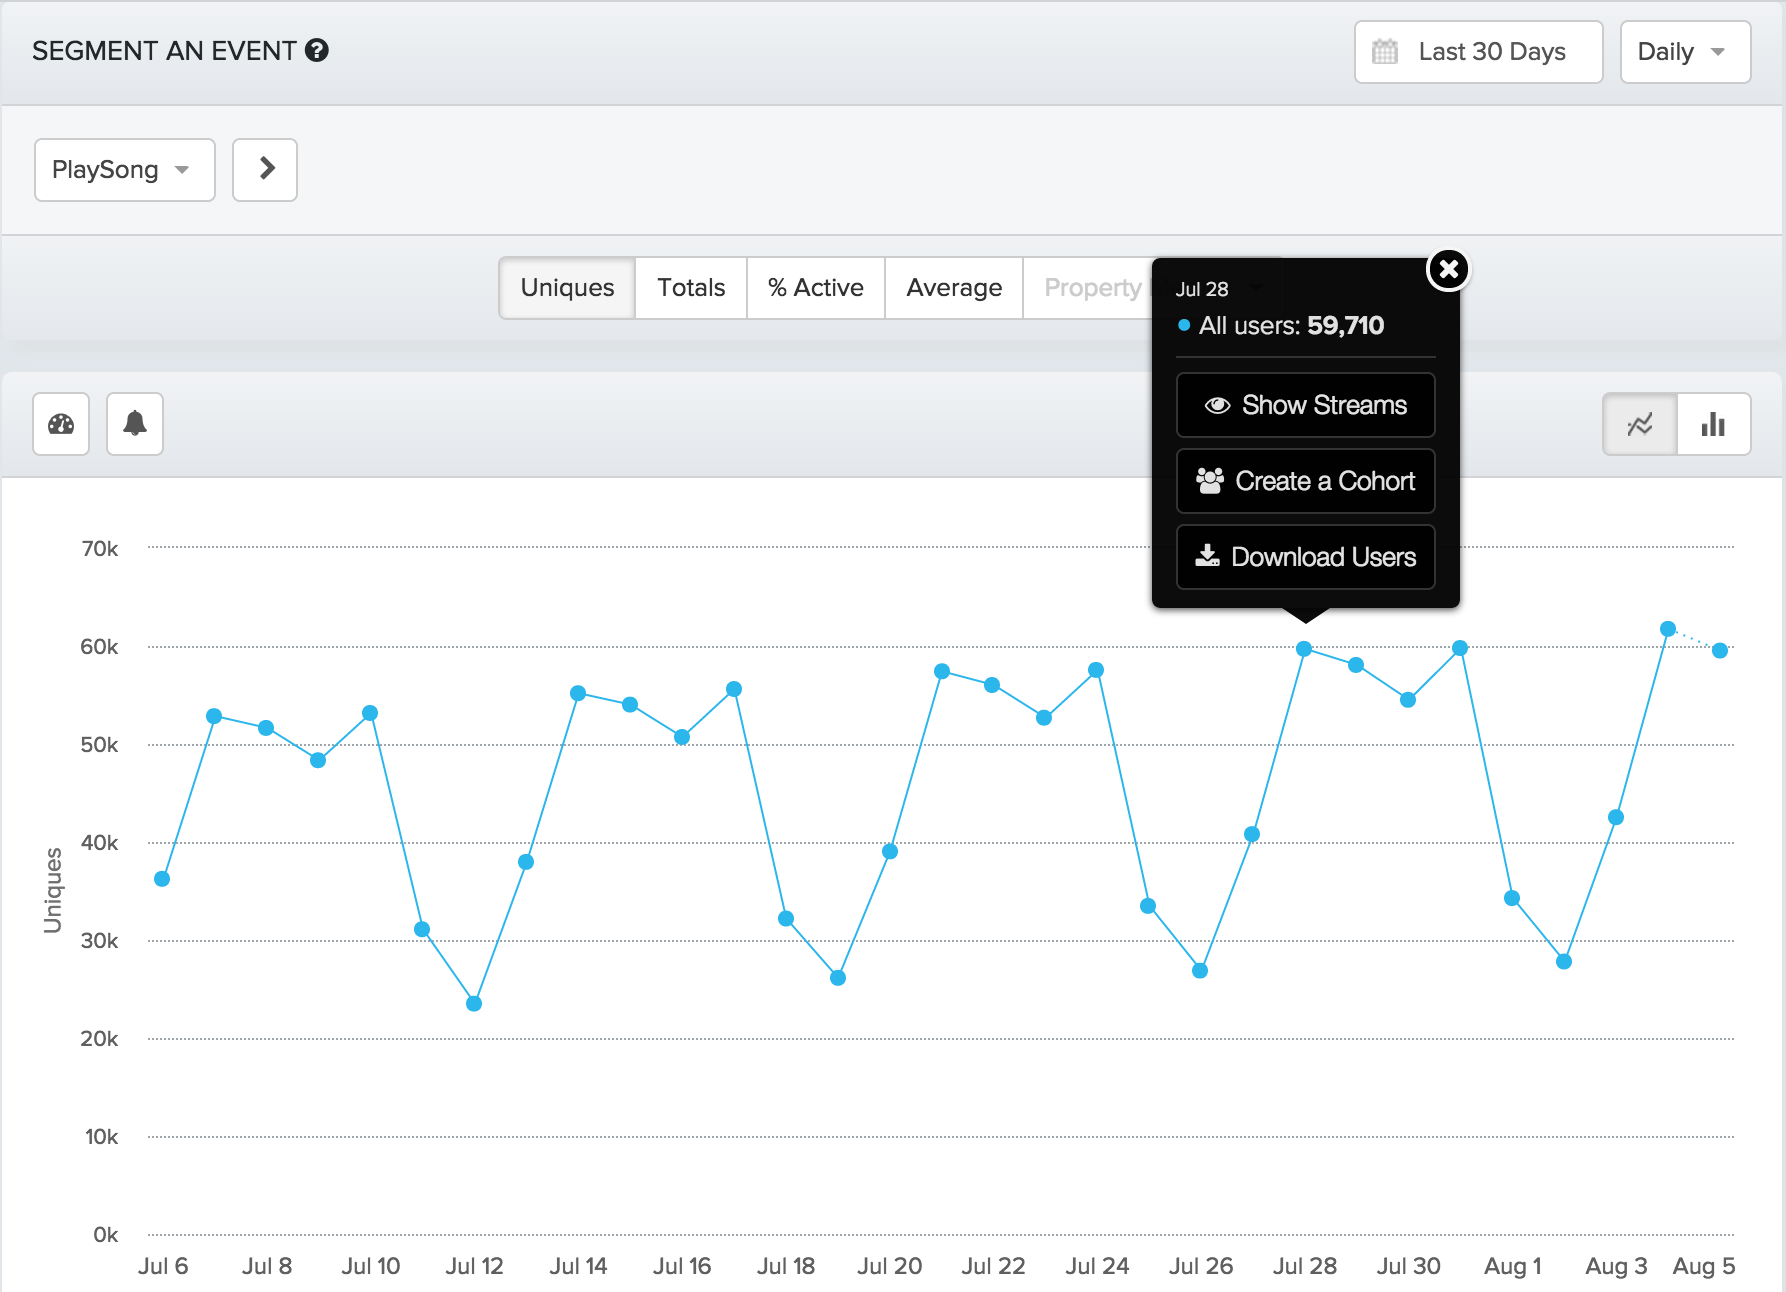
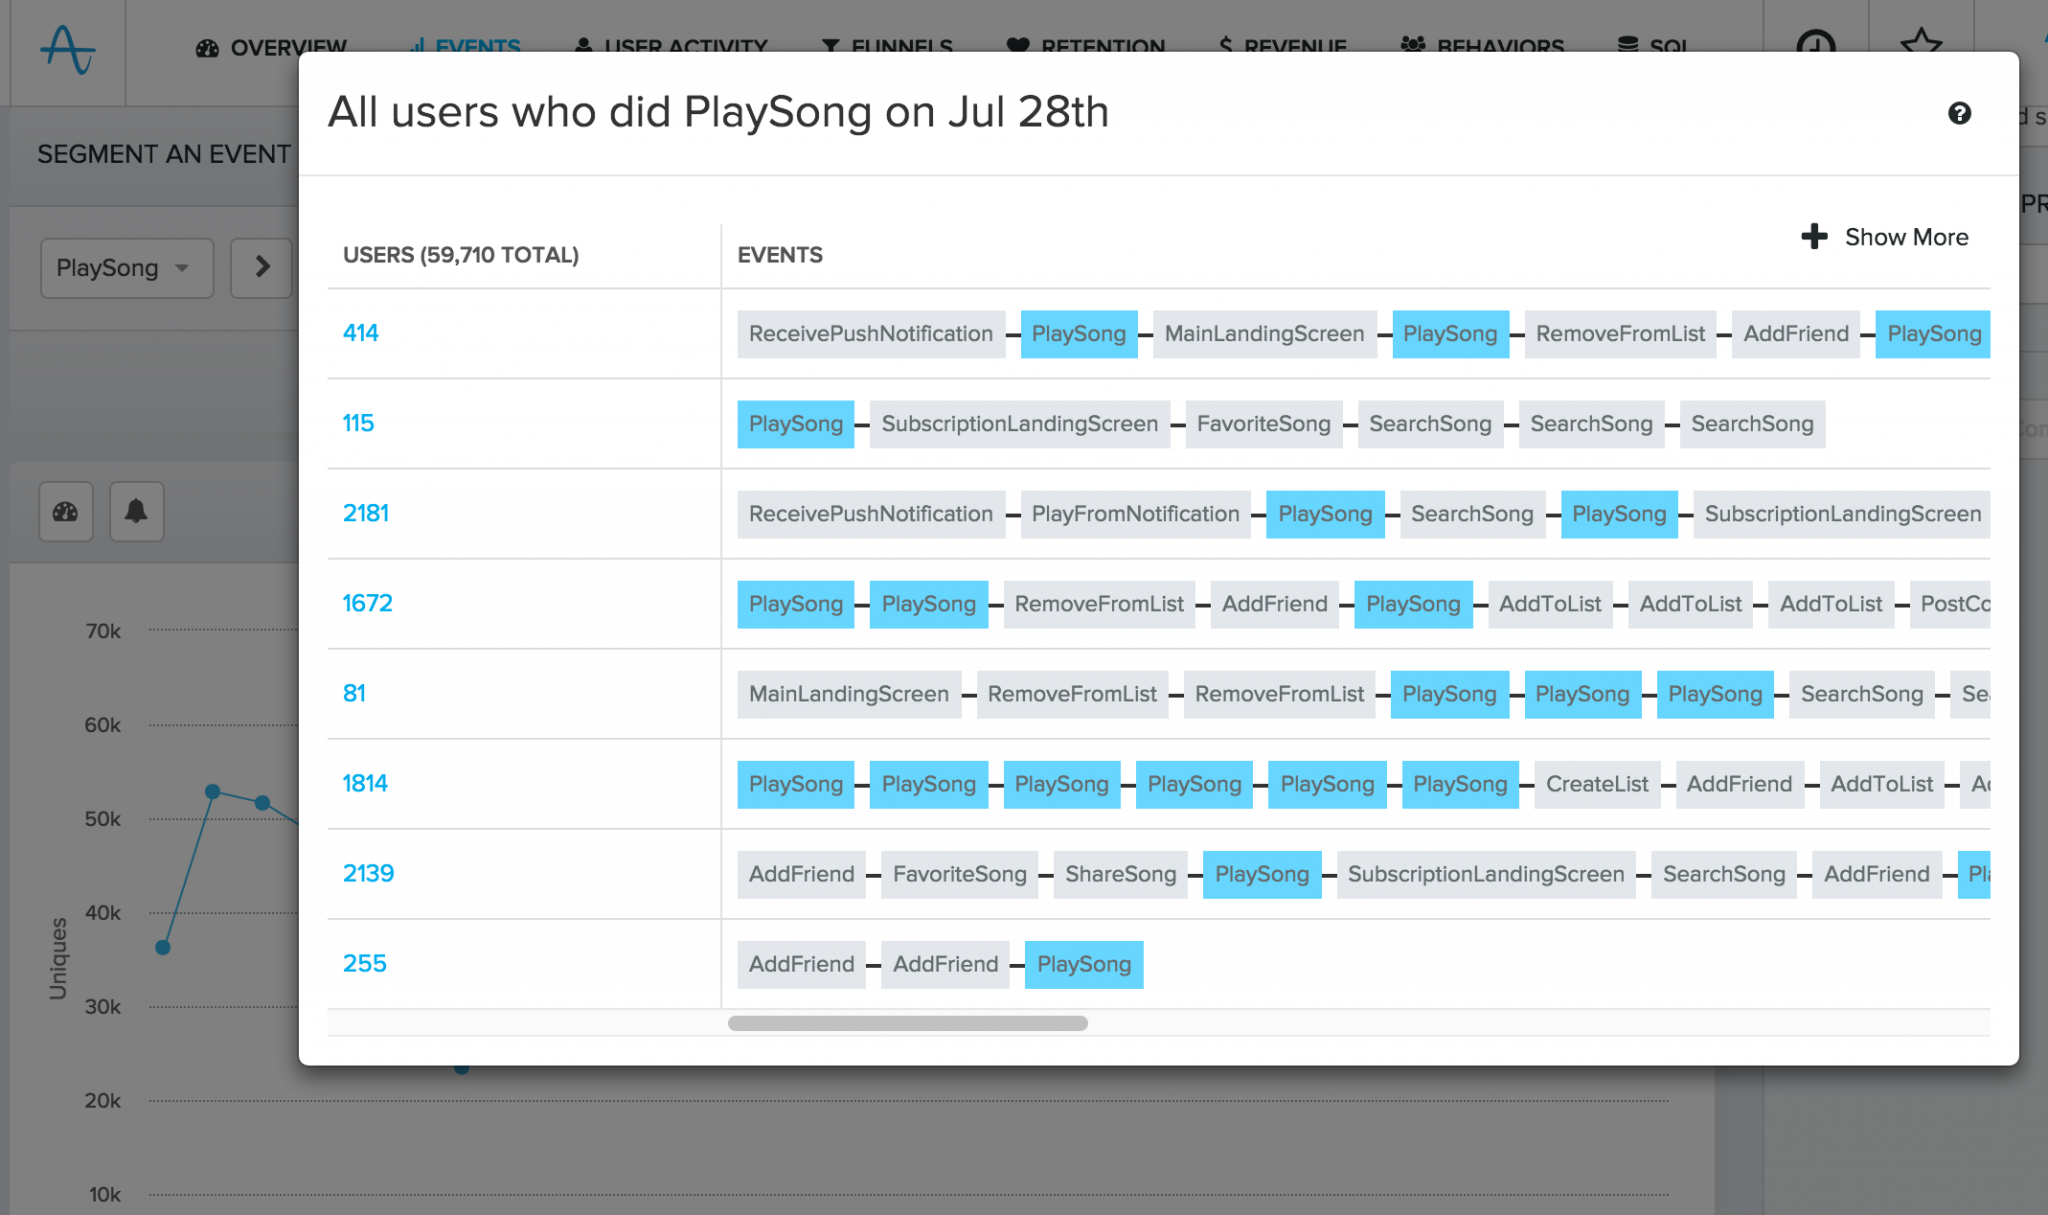
Traditional analytics dashboards are static aggregations of the underlying data. They’re a very thin slice of the data along a specific dimension. Dashboards lose so much of the context of what they’re tracking as each point is a one dimensional representation of everything that underlies it. We’ve seen an example of this with where you can click a data point to see what’s associated with it, but what if you want to go further? Seeing that you had 10,000 users perform the Play Song event on a particular day is a start, but what if you want to understand what makes up those 10,000 users? In Amplitude, you can use Microscope to click on any data point to dive into those underlying users and behaviors:
You can then see a list of users that make up that data point as well as what they’re doing at the time they contributed to the data point.
The Future of Analytics
I’ve always been excited by data. I’ve been thinking about how to better use data to make decisions from a young age (I’m lucky that both my parents are statisticians). Compared to academia, we have it good in software. We can look at millions of a data points in a few minutes while it takes millions of dollars and years to get a handful of data points for an academic study. There’s finally a that connects a majority of the world. And we’re .
The real barrier has always been the analysis, and we’re excited to make an impact here. I’m incredibly lucky to be able to do it as part of a . What we’re announcing today is just the start; we’re going to continue to push on the boundaries of what analytics can do.
One more thing
We’re also announcing a few other items today. We’ve raised a from Benchmark. Eric Vishria will be joining the board- we’re excited to work with him as he understands what the future of analytics can be.
In addition to tracking 25 billion events per month, we’re also being used by teams, including Nokia HERE, Yik Yak, Rdio, QuizUp, and DoorDash.
We look forward to making the jobs of mobile product teams a and helping them find .