Why Designers Need to Care about Data
If you’re a product or UX designer just getting started with data, these three areas of practice can help you demonstrate the value of your work.
Creatives are notorious for defying measurement. Sayings like “You can’t rush creativity” and “I’m not a numbers person” make it seem like design is all subjective magic. Well, if your work is subjective, your value is too. Unclear value is the reason design does not always have a seat at the table. It’s the reason design is the least staffed position in product organizations. And I’m betting it’s the reason designers get paid less than their product or engineering counterparts.
But how do you prove the value of design?
First, you have to define success and how it’s measured. Most companies set goals. But if you don’t truly understand the goals or know how to measure them, then it’s impossible to reach them.No one can be successful without a clear view of what success looks like.
Designers cannot be successful when they can’t see the bar for success.
As designers, we should thoroughly understand the behaviors that are happening in our products. When we make customer-facing improvements, we need to be able to see what changed for the business. We must align our day-to-day work with broader business goals and we must do so specifically and tangibly. It is our responsibility to inform our decisions with evidence. It is our responsibility to understand and demonstrate our value.
If you’re a product or UX designer just getting started with data, here are three important areas of practice that can help you make your work more valuable.
Practice Area 1: Defining Your Impact on the Business
Start by breaking down company goals into team or individual goals you can affect and measure. For example, if a travel company’s goal is to increase revenue by 20%, your team’s contribution might include increasing bookings by 10%. This is critical to know but it is just the beginning. (If you want to know more about goal setting, read Radical Focus, Measure What Matters and Grit.)
ref Related: Every Product Needs a North Star Metric: Here’s How to Find Yours
Make sure you understand where this goal is being measured and how you can see that you’re affecting it. If that’s not currently possible, work with your team to make it possible.
Put it into Practice
Investigate Details
Once you have a clear goal, you need a thorough understanding of what’s happening right now and what’s getting in the way of attaining that goal. Investigate current performance, gathering as much intel as you can. This is where design shines. Ask. all. the. questions.
- Where are bookings at now?
- How are we measuring it?
- Where are we measuring it?
- Who’s in charge of measuring it?
- What’s preventing people from booking?
- What kinds of errors are happening when people try to book?
- Who are these people who are booking?
- How fast are people booking?
- What makes people more likely to book?
The answers to these questions can be found within your organization, in your analytics reporting and in interactions with customers. Talk with your colleagues. Sit in on their meetings. Ask them to show you where they looking at these metrics. Ask them how to pull these reports yourself. Ask them about customer behavior. Ask them for help.
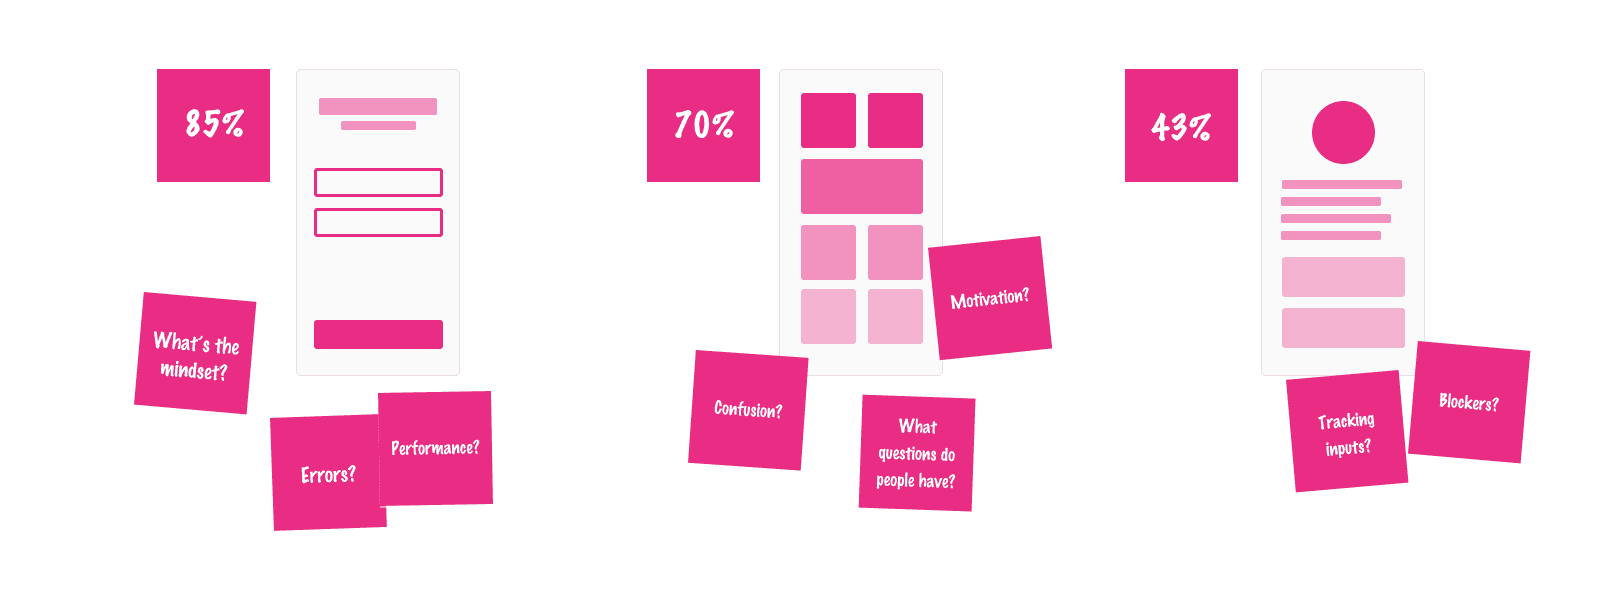
Share what you’re learning by creating a discovery board or wall that includes the current design, current metrics, customer insights and questions
Progress Reports
Now that you know where and how your goal is being measured, establish a cadence for sharing out progress. This could be a team conversation. It could happen at standup or in planning meetings. Or it could be more passive–a dashboard on the wall, an email, a Slack report.
Designers often lean on qualitative research for discovery but leveraging quantitative analytics can help you find patterns more quickly.
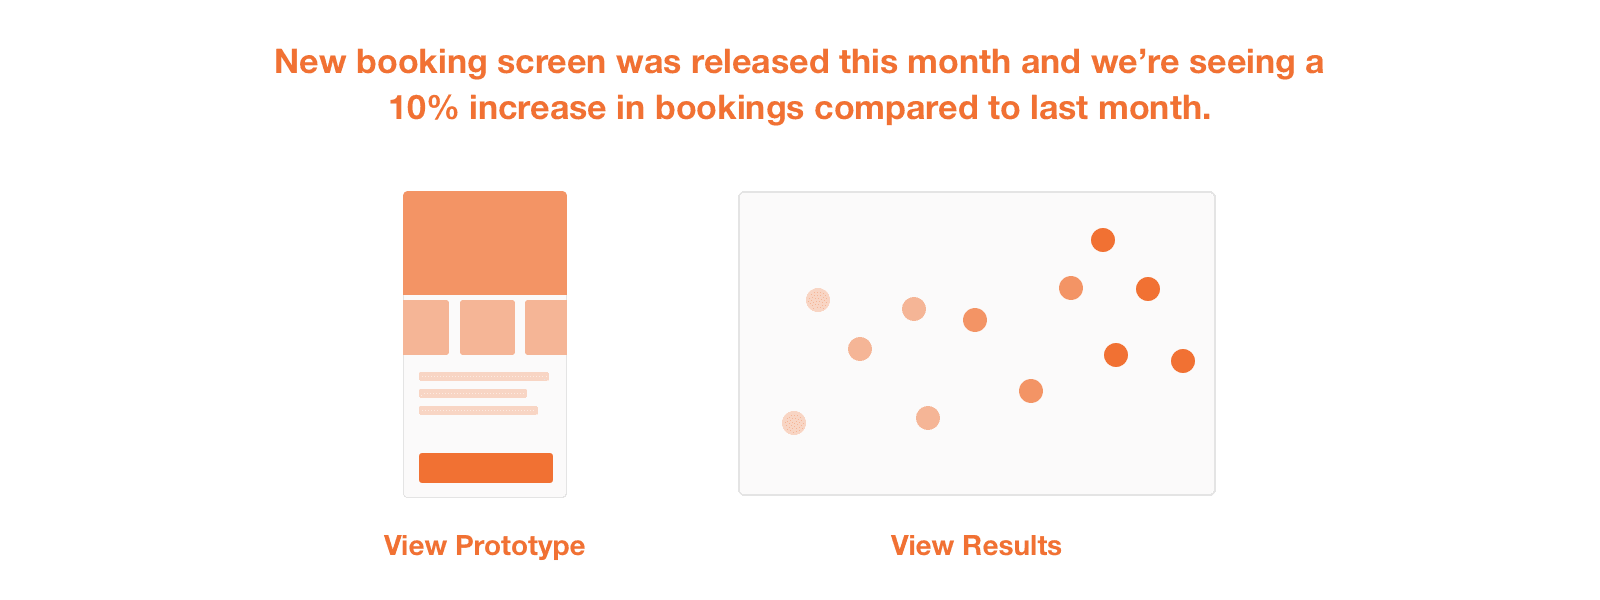
However you do it, make sure you are sharing the actions the team is taking every day and how customer behavior is changing in your product as a result. For example: “Here is a chart of bookings for the past month. Last Tuesday, we released our new booking calendar and we have seen bookings increase by 1% steadily for the past two weeks.”
These progress reports should be a collaboration between product, design, and engineering (and any other key roles on your team–maybe customer success or marketing). Design can share visual references, demos or customer anecdotes to help those outside the team understand what’s working.
Example progress report
Practice Area 2: Understanding Real Customer Behavior
The secret to business growth lies in truly understanding and serving customers. If you can figure out who your customers are, why they showed interest in your product and what else is missing from their lives, you can capture the market. Easier said than done.
We think we know what our customers need and want. We think we know how they behave, how they use our products. If you’ve ever run a usability test, you know that’s not true. Gathering information on how real human beings outside your company see and interact with your product is the first step to improving it. There is absolutely no reason to take on a blind redesign of your product without an understanding of what’s happening now. Designers often lean on qualitative research for discovery but leveraging quantitative analytics can help you find patterns more quicklyIt can help you learn who you should be talking to. You can then follow up with these individual customers and interview them.
We think we know what our customers need and want. If you’ve ever run a usability test, you know that’s not true.
Put it into Practice
Look at real customer journeys
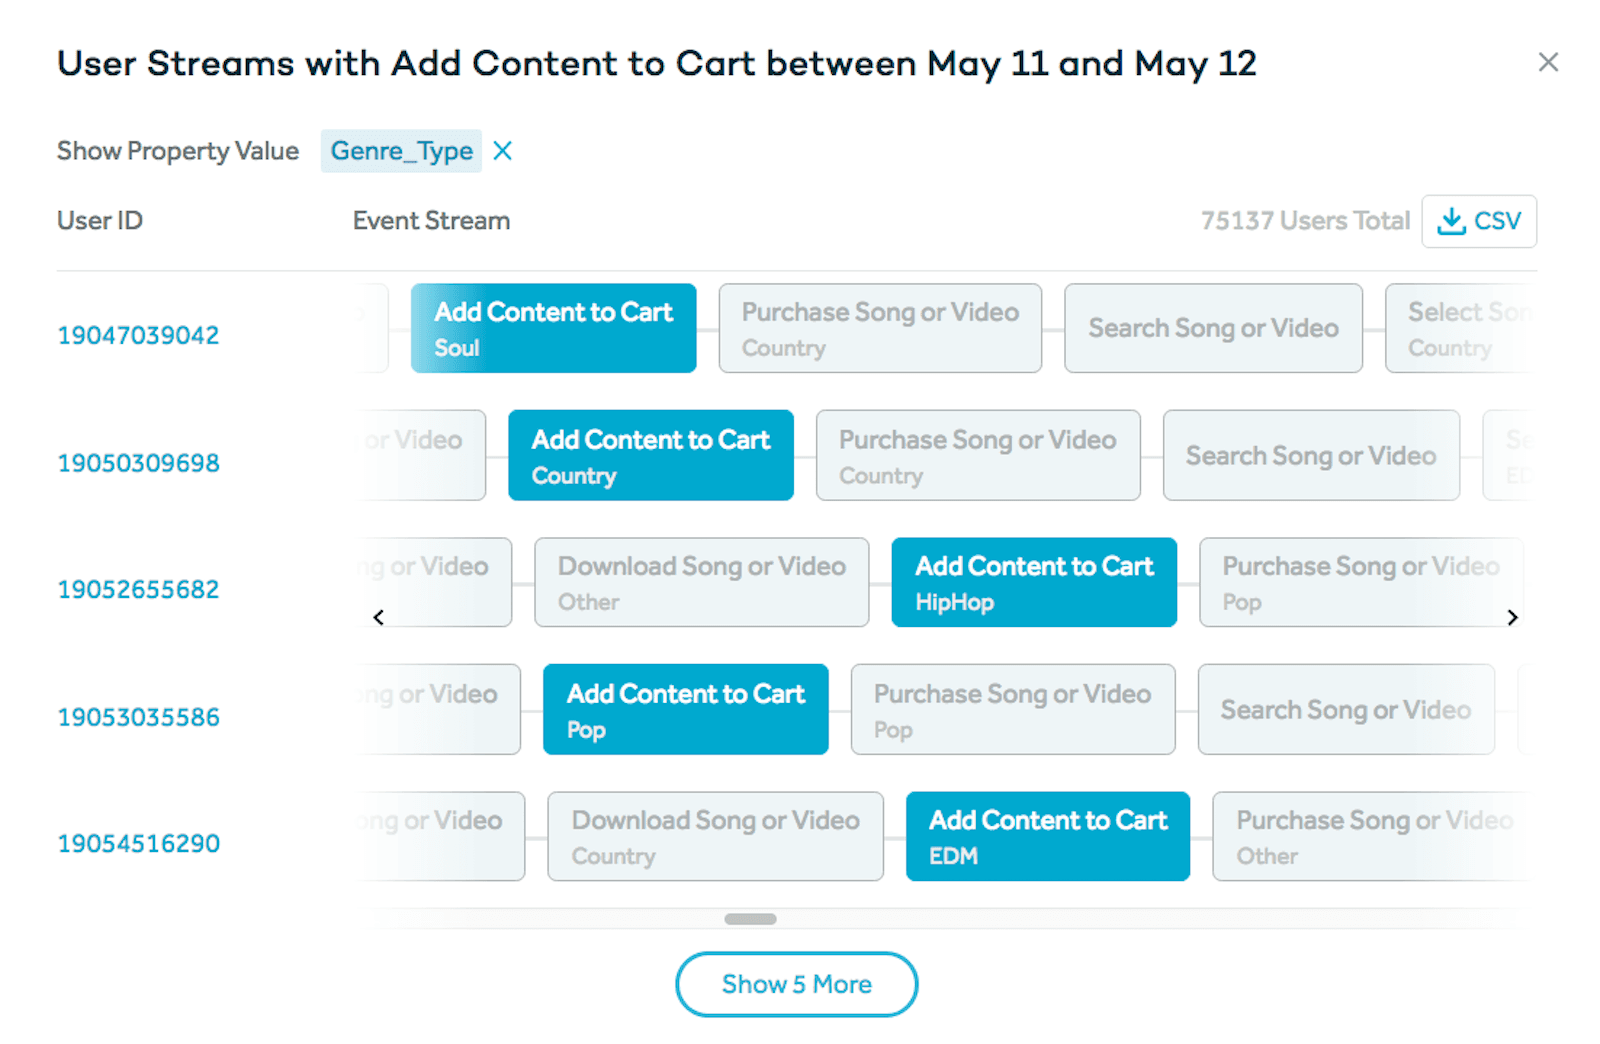
Platforms like Amplitude provide moment-to-moment timelines of how individual customers are behaving in your product. Review them. Question them. Rebuild your reports to answer your questions.
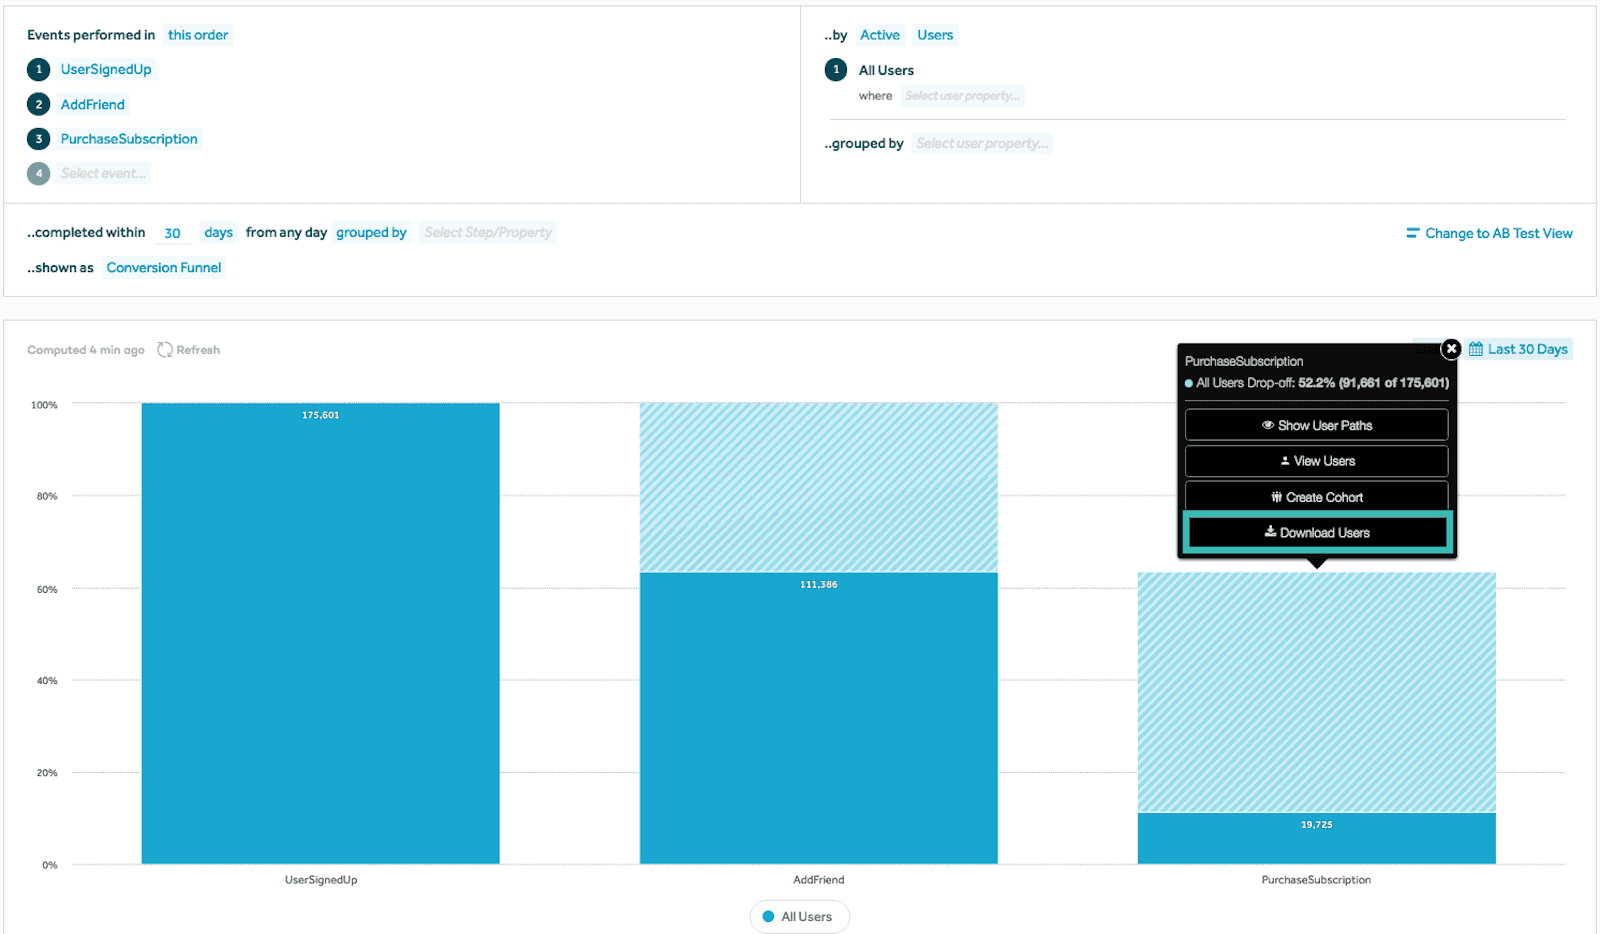
You can start with a funnel report that shows where people are missing your goal. Going back to our bookings example, find the step before booking and open those customer journeys. Who is not booking and where did they go instead? In a tool like Amplitude, you can pull up a report of individual customers. Amplitude even has path reports that will group the most common paths from or to an interaction in your product. (Side note: Amplitude didn’t ask me to include a single mention about their platform. I genuinely rely on it every day so it’s hard not to highlight its utility.)
If you don’t have these tools, your data, engineering or customer success teams might be able to help. Enlist the help of your teammates to help you answer your questions. Gather all the information you can about how people are currently using the product.
Amplitude’s User Streams feature lets you see how real humans are using your product individually. Read more about how to use it in their documentation.
Talk to real customers
As you find customers that are interesting or unusual, you can recruit them for one-on-one interviews. Email them or use a tool like Ethnio to intercept them in your product. Set up the interview by letting them know you’re interested in understanding how they are using the product. Be as human as possible and make it about them, not about your product. Also, probably don’t tell them you looked them up in your analytics tool (Check out Talking to Humans for more on exploratory interviews – also known as customer development.)
Once you’ve interviewed some people, you can try to rework some of your analytics reports to see if any new information emerges. Maybe those ten people you talked to are unique or maybe they signal a larger pattern. Either way, you’re starting to uncover clues that you can use to inform your growth and design decisions.
How to download a list of users who performed an action in Amplitude. More on this in their documentation.
Practice Area 3: Validating Design Decisions
By now, you should be onto something. Your team has a focused metric. You’ve identified opportunities and you are designing possibilities. The fog is clearing and a vision is emerging.
Before you double down and rip out your onboarding, consider how you will derisk your decisions. Even if the brand new design is seemingly much better, how might you be able to prove that? Are you sure it’s worth spending X number of weeks (or months) building this new design? You’ve come too far into the land of customer understanding to put all your eggs in one basket.
The bigger the risk of your design proposal, the more you need to build a case for investing in that direction.
It’s critical to have vision but over-investing in unproven ideas is one of the biggest mistakes teams make. It’s up to your team to determine what the level of risk is but you can think of it in terms of cost-benefit. If you’re right, what’s the upside? If you’re wrong, what has been wasted?
Related Reading: How to Set Metrics for Design
Put it into Practice
Measure your releases
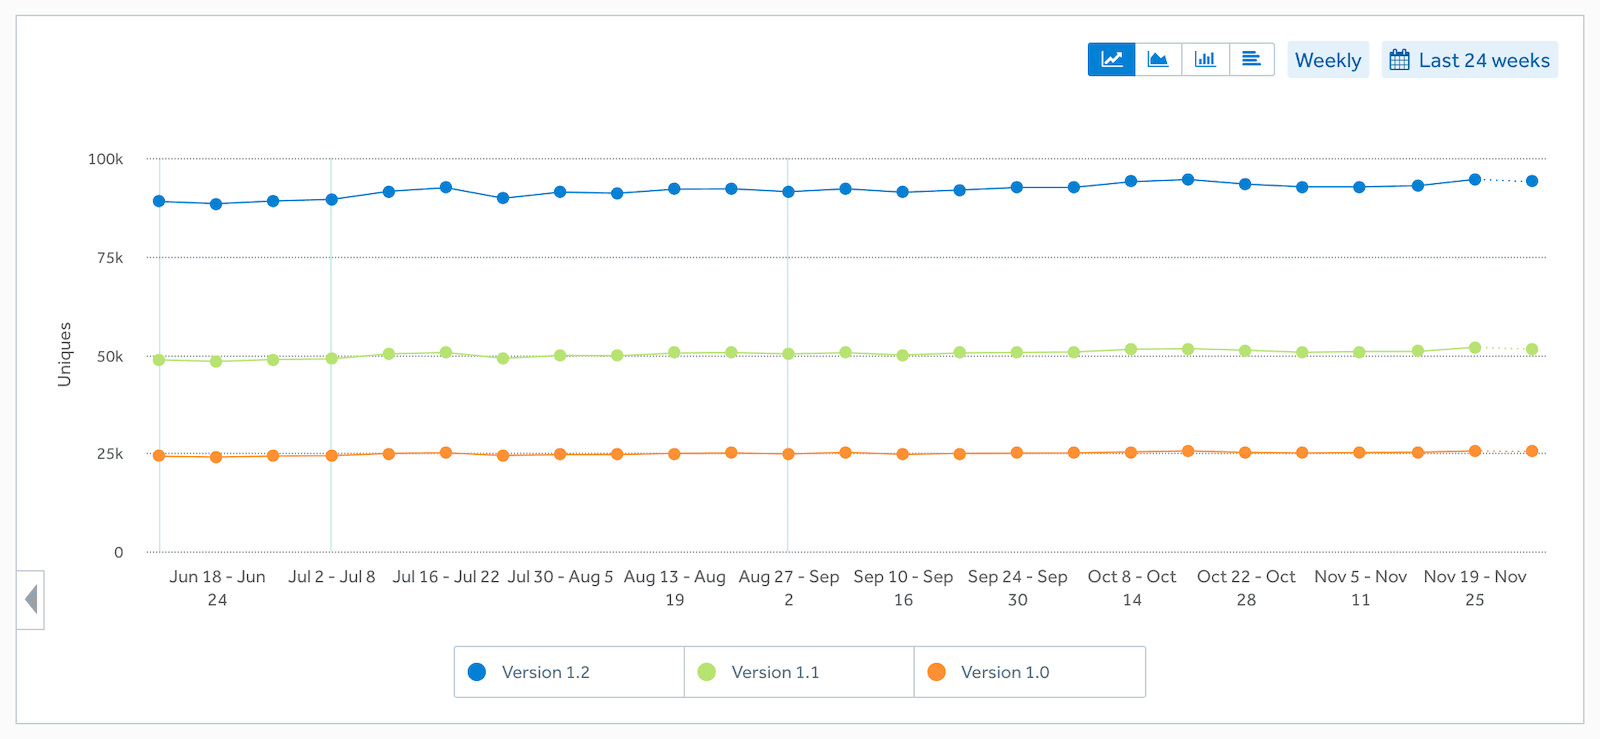
As you release changes, set up reports that show their impact. Start with your key metric–the one you’re trying to move for the company–and build views around that behavior. For mobile apps, you can also send version numbers to your analytics tools so you can compare versions. On web, you would look at week-over-week or month-over-month to see how things are changing. Ideally, your team is releasing often so you can learn more specifically what’s working and what’s not.
Make sure it’s clear who on your team monitors the outcome of a release. Even if this is not you, you should be aware of where to find these reports as you’ll need that information to inform your next decisions.
An event segmentation view in Amplitude showing how each release of the app is performing. Read up on how to do event segmentation.
Improve your strategy
With each release (or experiment), you learn about customer behavior and your impact on the business. Reflect on these releases with your team. Did you see what you expected to see? Did you move your key metric? Document what you learned, what new questions you have and what you’re planning to do next. Share this information in your team’s progress reports.
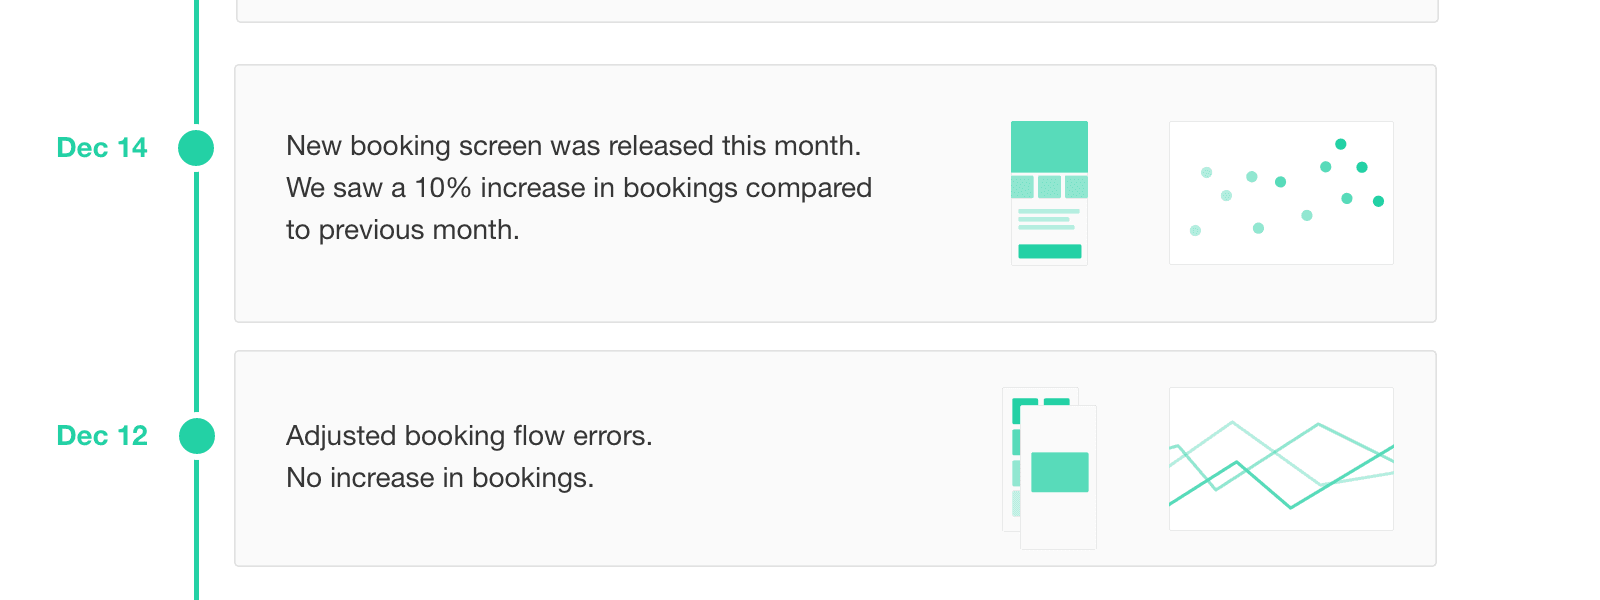
You can even create a timeline of releases so the story of where you are heading and why is easy to follow. This can be a helpful artifact for having conversations with executive leaders as well as onboarding new teammates.
Your release timeline could include not only dates and verbal explanations but also prototypes, screenshots and relevant reports
The Proof is in the Data
Our jobs depend on our ability to convince leaders we are valuable. Without any tangible proof, we rely on someone else’s understanding of how design improves a business. Luckily for us, there are so many tools for proving the value of design. It’s up to us to take full advantage of them.
Designers who want to own their success and control their destiny should equip themselves with a rich knowledge of data. You do not have to do it alone. Read the documentation for your analytics tools. Talk with your colleagues and ask for a walk through of how they look at data. Create one report and show it to a teammate to see if they see what you see.
Designers who want to own their success and control their destiny should equip themselves with a rich knowledge of data.
Use data as both an input into design and a demonstration of the outcome of better design. Use data to understand the human stories behind your product. Use it to elevate the role of design in business. Use it to tell your own success story.
Your seat at the table is waiting.


Lex Roman
Independent Growth Designer
Lex Roman is an independent Growth Designer based in Los Angeles. She drives business growth through customer understanding and strategic design. Previously, she led growth design and product analytics at Burner and practiced early stage validation and conversion strategy at Carbon Five. Past clients include Nissan, Prosper, Joyable, Macys.com, Toyota and some startups you’ve never heard of because they didn’t make it.
More from Lex


