Making Stone Soup: Eval-Driven Development for Analytics With AI
How our whole village, from dev teams to customers to LLMs, contributed to automate insights in Amplitude
There’s an old fable about travelers who arrive at a village with nothing but a pot and a stone. With no food, the travelers start boiling some water and the stone in their pot. It’s not much initially, but it draws curious villagers who add carrots, potatoes, some herbs, and meat. Ultimately, the whole village ends up with a hearty meal that no one could have made alone.
Building Amplitude’s AI for insight automation felt a lot like the travelers’ process of making stone soup with their community. We started with a vision and basic tools, but with input from our village, our customers, we cobbled together the ingredients to build a strong set of evaluations (model inputs and outputs) that guided our AI product development.
🪨 The first stone: Internal scenarios
We started with an idea: What if AI could extract insights from user data, just like a seasoned product analyst? It was a promising idea, but one without a clear recipe. So we started with what we knew: how human analysts typically move from a question to analysis to insight.
Using our intuition and internal scenarios, we built our first evals mapping question (input) to insight (output) flows that analysts go through in Amplitude. We collected stories from Amplitude PMs about their analyses related to the Amplitude Made Easy launch last year:
- Question: “Why did data setup rate spike going into May?”
Insight: Our PM knew, based on expert business knowledge, that this metric bump was due to a new data setup experience rollout.
- Question: “But then, why did our signup to data setup conversion rate drop?”
Insight: Our PM dug in, found the event volume per step, and manually compared data against historical trends. This investigation revealed that more people were setting up data, as expected. However, there was even more unexpected top-of-funnel signup growth, so conversion dropped!
- Question: “We didn’t ship any top-of-funnel product improvements, so what explains the surge in new signups?”
Insight: After hours of analysis, guesswork, scouring through internal product releases, and segmenting the data by different event and user properties, our PM finally stumbled upon a finding. Segmenting by country showed a spike in signups from Brazil. Grouping by “utm_source” confirmed that the unexpected surge in signups was coming from a LATAM-focused marketing campaign!
These early evals (question inputs → insight outputs) weren’t anything new, but they gave us something tangible—water in our pot and a stone to swirl around. We built a scrappy initial agentic system that followed these investigation loops: gather context about product releases, identify trends and anomalies, and break down metrics by assorted properties until something explains observed patterns. Our system was able to perform the same steps as a human analyst and respond with similar insights on each eval, except a lot faster than a human!
🥕 Carrots (use cases) from customers
Soon, early customers grew curious about what we were cooking. When we asked them what they wished AI could do with their data, they volunteered real-world question → insight examples of their own. For example, customers described time-consuming analyses required to make predictions around seasonal engagement, comparisons across user groups, and summaries of product launch impact.
This wish list expanded our eval set and gave us new directions for development. We updated our agentic system to tackle these new use cases (e.g., tools for seasonality and period-over-period comparisons).
🥔 The meat and potatoes
Adding one hand-picked eval at a time was valuable but slow. To match our pace of development, we needed more examples to model our system after all at once. The breakthrough came when we realized we already had a trove of ingredients: Amplitude Notebooks, the storytelling reports Amplitude PMs had been creating for years.

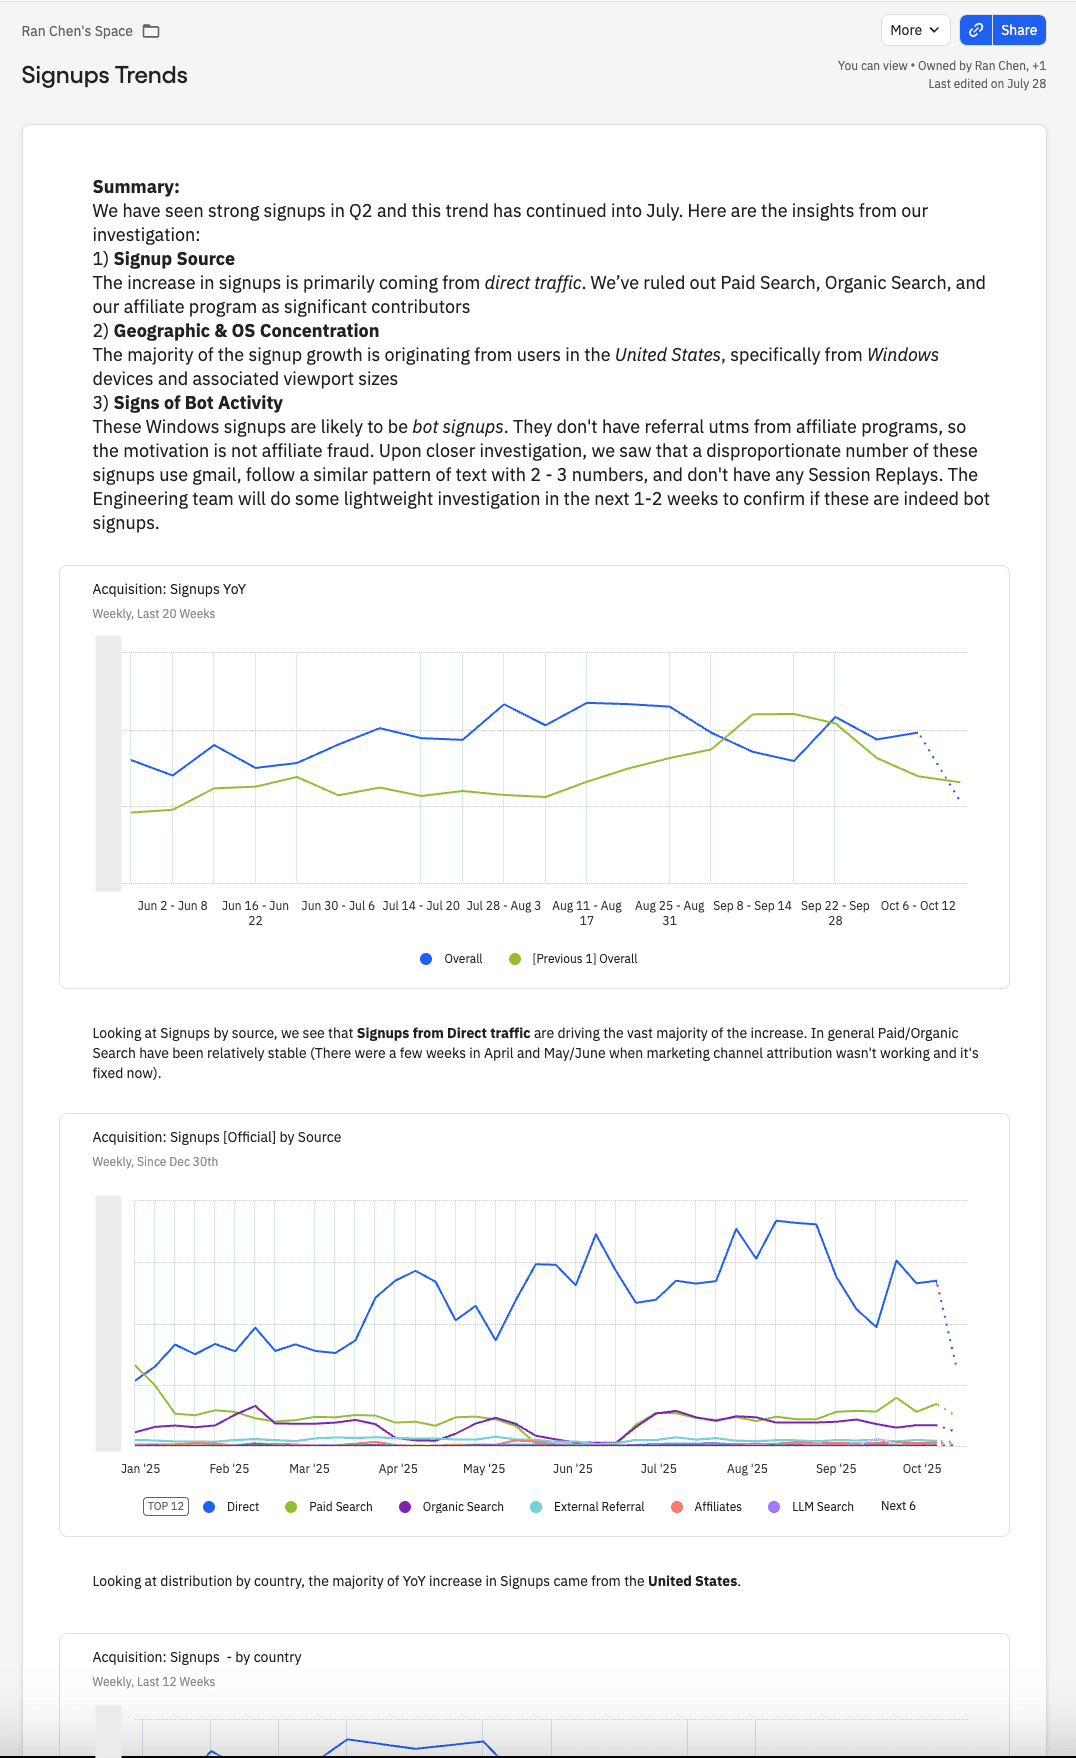
An example of an internal Amplitude Notebook investigating signup source attribution
Our internal Amplitude Notebooks contained perfect examples of what our AI system should replicate: step-by-step human-written analyses investigating anomalies, comparing cohorts, annotating release notes, and synthesizing learnings.
We built an LLM pipeline to synthesize hundreds of internal Notebooks and curate evals at scale. Using LLMs, we extracted key questions, mapped the steps to answer those questions, and identified the insights generated by the process. Our team then reviewed and sanitized each Notebook-sourced question → insight example to ensure quality and variety in our evals.
Our soup was getting richer. The aroma got people inside and outside of Amplitude asking exciting questions: What types of questions could it answer? What types of outputs does it generate? What exactly is an insight?
♨️ Stirring up a taxonomy of insights
As we audited our evals, we became experts in how users analyze data in Amplitude. We defined an “insight” as a single meaningful data-driven observation that deepens understanding of a product, users, or processes and enables better product decisions.
To further explain our system’s inputs and outputs, we created taxonomies of the types of questions users asked and insights we expected to produce:
- Question Types: anomaly explanations, cohort comparisons, release impact analysis, experiment effect sizing, trends and seasonality, attribution and driver analysis, bot detection, and data‑quality checks
- Insight Types: release‑driven hypothesis, experiment‑driven hypothesis, segment‑driven hypothesis, seasonal pattern, metric definition/UX artifact mismatch, suspected bot traffic, suspected data issue, and “no strong signal” with next‑best probes
We labeled each eval to explain the representation across these categories in our stone soup. We learned what types of questions and insights were highly represented in our eval set (like questions about anomalies), while others were less common (like insights about bot detection, a rarer analytics subroutine).
As we iterated, we needed to start measuring its performance on our evals.
🥄 Measuring success on evals
To determine how good our system was, we defined success measures.
We highlighted a set of expected insights per eval. Then, we used an LLM judge to determine if our system identified the expected insights (True Positives). The LLM judge also detected when our system identified additional insights outside of the expected set (False Positives). Those metrics helped us calculate:
- Recall: the percent of expected insights that were detected by our system
- Precision: the percent of the insights detected by our system that were expected
We chose not to optimize for precision early on and prompted the system to generate a variety of hypotheses rather than aiming for narrow perfection. Then we observed our system’s reasoning capabilities as it aimed to capture true insights.
Our custom north star metric, Insightful Response Rate, measures the percentage of system responses containing at least one True Positive insight. If the system can, in a few minutes, find an expected insight that would otherwise take hours to find, we consider that a win for our end users!
Recently, our improvements to the system have driven the Insightful Response Rate on our evals to over 75%!
🍲 Soup for the whole village
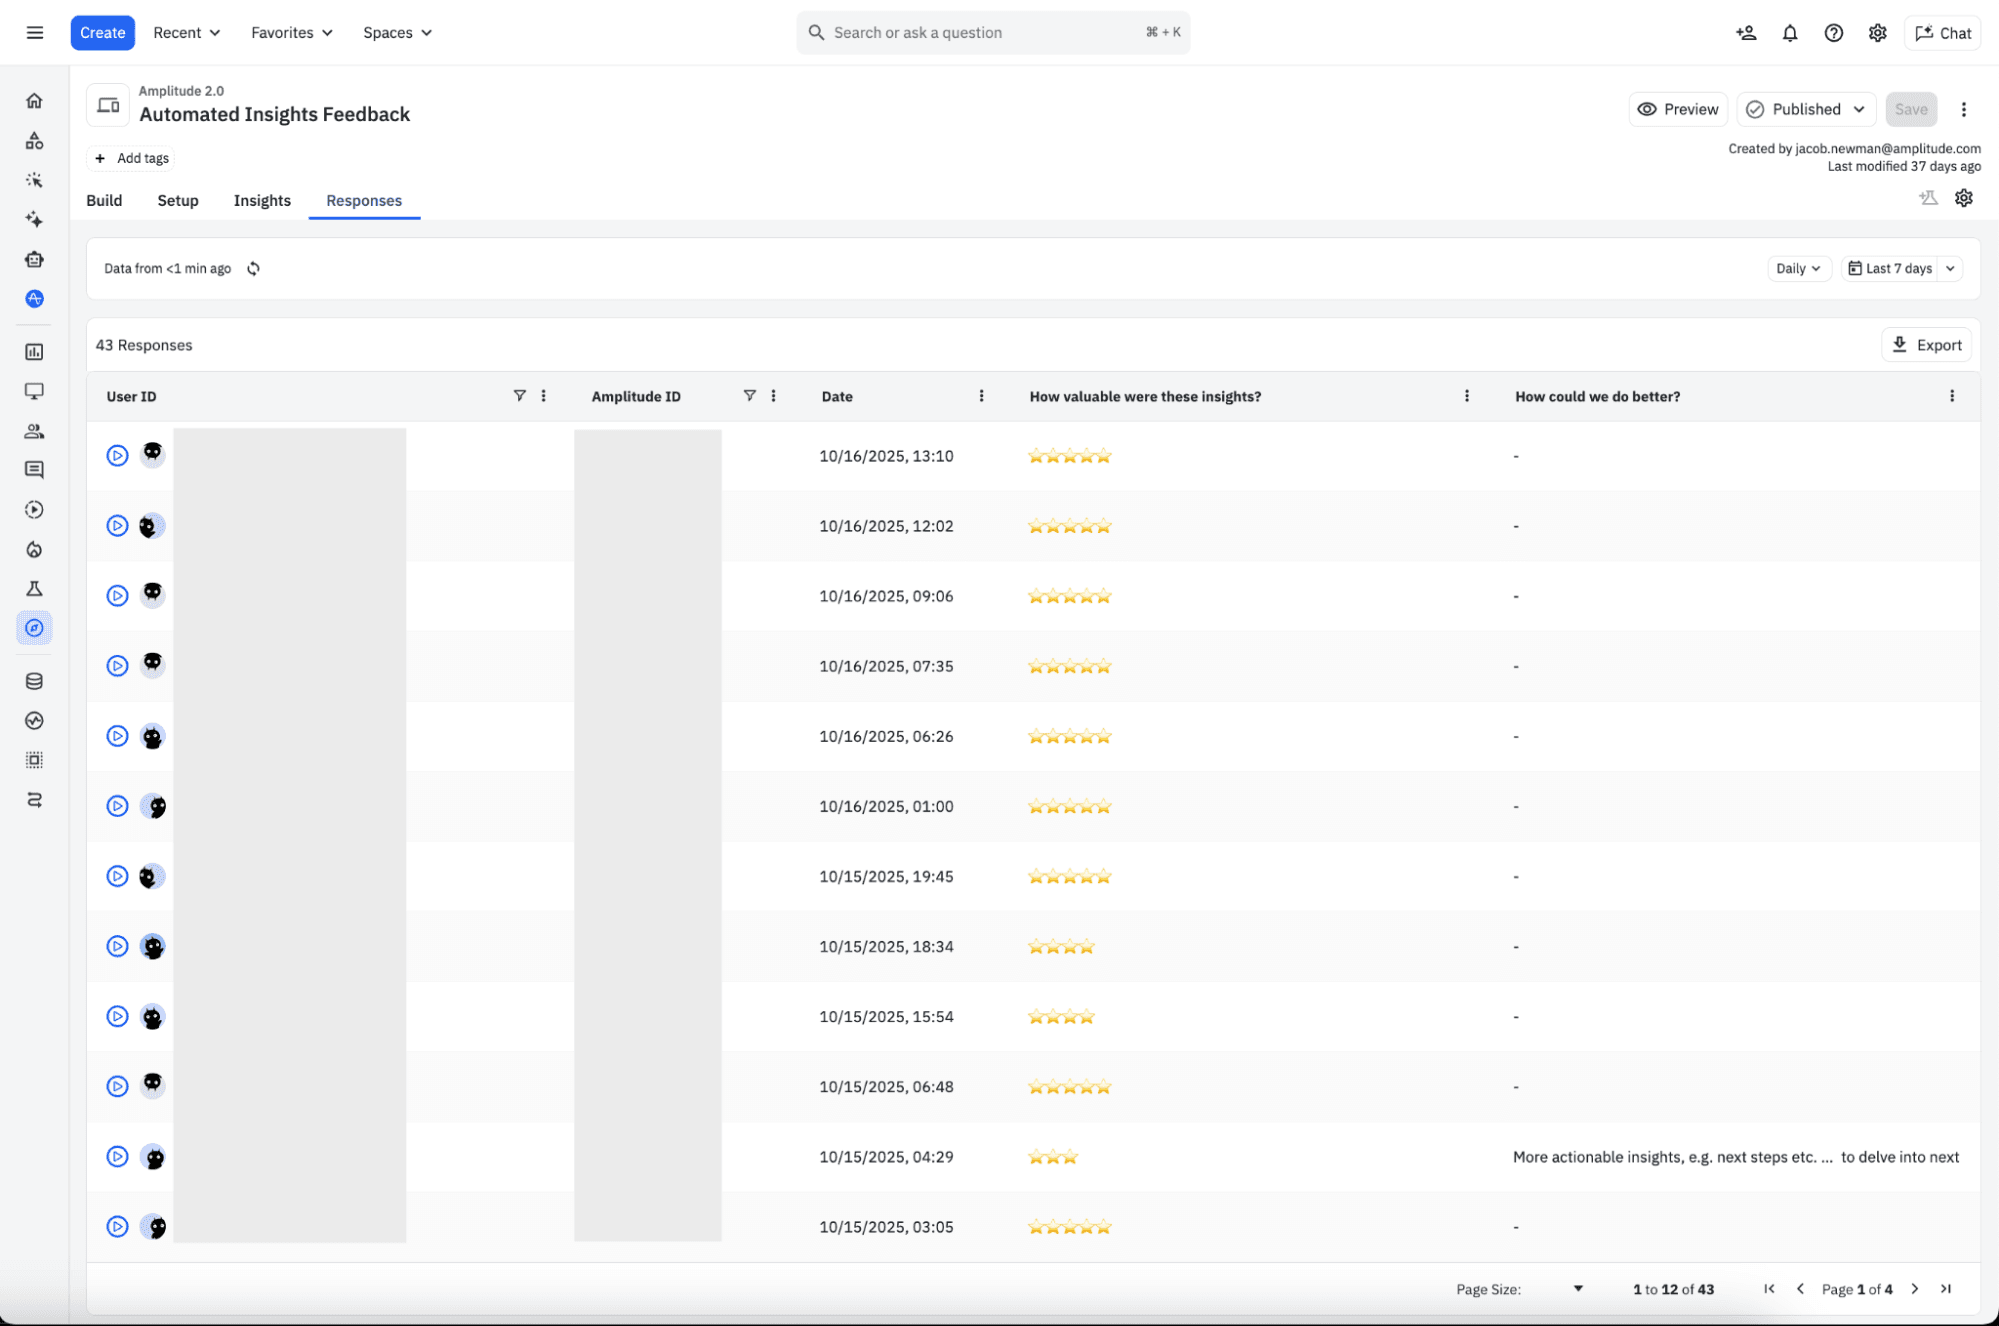
We shipped our experience to hand-raising customers to evaluate how good it actually was. In a few weeks, we had added more evals from Notebooks, built agentic tools to address most of the evals, and some Amplitude guides and surveys around our feature. The feedback was clear: users rated over 70% of responses as helpful (3+ stars), roughly matching our eval-based success measures.
We then rolled out to 25% of customers on our Growth and Plus plans! We monitored usage metrics and saw emerging power users returning to ask our system new questions every day! Other users who were dissatisfied told us areas of improvement, and we iterated based on that feedback.

A snapshot of the recent response ratings we received last week
Next, we doubled our rollout and embarked on two weeks of intense learning, fueled by daily customer calls. The more taste testers and ingredient contributors we involved, the better the soup got! Ultimately, the results spoke for themselves—we had a record number of 5-star reviews, a flurry of strong customer testimonials, and a conviction that our AI feature reliably accelerates analytics for our customers.
Finally, we rolled out our AI feature available to all Amplitude users last week. What began as a small idea grew into something far more powerful with our customers’ inputs—and our stone soup is still simmering. Now, anyone can ask Amplitude complex analytics questions and get insights in minutes!
This blog post contains descriptions of work and contributions from: Jacob Newman, Henry Arbolaez, Ram Soma, Curtis Liu, Alan Lee, Nirmal Utwani, and Tanuja Nadarajan.

Janaki Vivrekar
Software Engineer, Amplitude
Janaki Vivrekar is a Software Engineer at Amplitude where she builds tools for Amplitude users to collaborate and share insights. She is a UC Berkeley graduate with degrees in Computer Science, Applied Math, and Human-Computer Interaction, with a background in new media and education. When not at work, Janaki enjoys inventing vegan recipes and hand-drawing mandala art!
More from JanakiRecommended Reading

Amplitude Expands AI Visibility Tool
Feb 5, 2026
7 min read

How Ramp Network Turned Data Into 30% Higher Conversions
Feb 5, 2026
5 min read

Why Hackathons Are the Best Kept Secret to Drive GTM Innovation
Feb 4, 2026
6 min read

Meet the Ampliteers: Values Awards Winners, Q3 2025
Feb 4, 2026
10 min read

