B2B SaaS Dashboard

Elevate your B2B SaaS strategy with our focused dashboard. Track weekly sign-ups, user origins, and daily activity. Explore user roles and engagement metrics. Ideal teams in B2B SaaS looking to refine user acquisition, onboarding, and engagement.
About this template
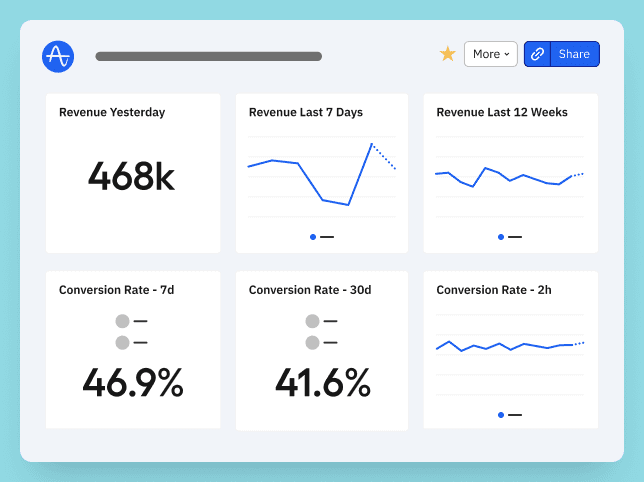
Amplitude's B2B SaaS dashboard offers a robust view of charts to help measure customer acquisition, user engagement, and event tracking within your product.
Customer Acquisition Charts
- How many businesses sign up per week?
- How many users sign up per week?
- Where are new sign ups coming from?
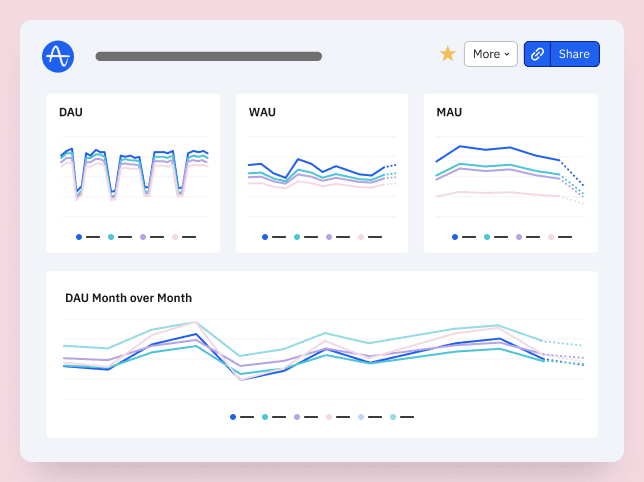
Basic Engagement Metrics Charts
- Daily Active Businesses
- Daily Active Users
- What is the distribution of teams or roles?
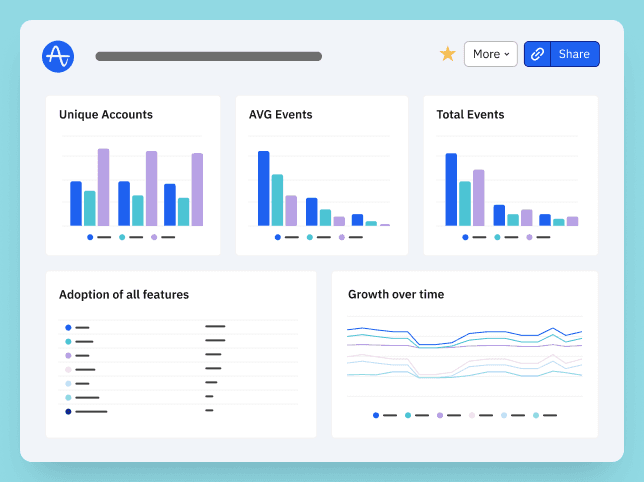
Key Engagement Events Charts
- How long does it take new users to join channel?
- What are the most popular paths users take after they join channel?
- How does performing "React with Emoji" correlate with user retention?
- What percent of daily active users perform "React with Emoji"?
- How frequent do users perform "React with Emoji"?
How this template works
About Amplitude
Recommended Integrations
- Hubspot - HubSpot is an all-in-one marketing tool that helps attract new leads and convert them into paying customers.
- Braze - Braze is a comprehensive customer engagement platform that powers relevant experiences between consumers and brands they love. Braze helps foster human connection through interactive conversations across channels
- AppsFlyer - AppsFlyer helps brands make good choices for their business and their customers with its advanced measurement, data analytics, deep linking, engagement, fraud protection, data clean room, and privacy-preserving technologies.
Frequently Asked Questions
Amplitude is a leading digital analytics platform that helps companies unlock the power of their products. Amplitude guides companies every step of the way as they capture data they can trust, uncover clear insights about customer behavior, and take faster action. When teams understand how people are using their products, they can deliver better product experiences that drive growth.
Yes, Amplitude is free to get started. Our Free plan includes 2 million events per month, out-of-the-box Analytics and templates, Session Replay, Web Experimentation, and more—all at no cost.
Related templates

Operating Partner @ OpenView | Growth Unhinged
Feature Monetization Dashboard by Kyle Poyar from OpenView

Co-founder @ Human37
Ecommerce Dashboard by Glenn Vanderlinden

FinTech Dashboard

Head of Data & Analytics

