How to Perform a SaaS Cohort Analysis to Reduce Churn
Perform a SaaS cohort analysis to learn how different groups of users and accounts behave in your platform and reduce customer churn.

Originally Published on July 29, 2022
SaaS cohort analysis involves segmenting users into groups based on shared behaviors or traits to answer business questions about how those users have interacted with, or will interact with, a SaaS product. SaaS companies are able to identify how specific user behaviors or characteristics lead to different outcomes.
Let’s say your SaaS product is a project management tool. SaaS cohort analysis would let you identify that:
- Users who activate push notification reminders in the first week are more likely to stay engaged with your software than those who don’t.
- Users who joined on a day with a high-profile marketing campaign launch are churning less than average.
- Users who join in January typically end their subscription after one month.
- SaaS companies provide software services to users through a subscription model. These services can include customer relationship management, expense management, project management, and more.
- SaaS cohort analysis gives you information about how different users or accounts interact with your SaaS platform.
- You’re able to use that information as a starting point to investigate why users churn.
- Once you’ve worked out why users churn, you can make adjustments to improve retention.
- Subscription-based SaaS companies can also use cohort analysis to identify which cohorts remain subscribers for the longest time, have higher customer lifetime value, and more.
What is SaaS cohort analysis?
Software as a Service (SaaS) companies provide software to users in the form of subscription applications. SaaS platforms can provide software services that help users with customer relationship management, expense management, project management, human resources, information security, and more.
In cohort analysis for SaaS, you separate end users into groups or segments to learn how their traits and behaviors affect business outcomes. SaaS companies can also conduct a cohort analysis on groups of customer accounts to see differences across the organizations that use their platform.
You might segment users by:
- The month they joined your SaaS platform
- The acquisition channel
- The behaviors they showed in your SaaS product (like enabling notifications, using the share feature, creating a new project management board, etc.)
If you treat all your customers as a single group, it’s difficult to draw actionable insights about why people churn. But if you group users by when they joined your app, for example, you’re able to analyze patterns across the customer lifecycle.
Cohort analysis helps you better understand the way users behave, which allows you to:
- Make product decisions that add value for users and keep them engaged.
- Spot pre-churn patterns and act to improve customer retention.
- Improve advertising and personalization.
- Understand seasonal differences in product usage.
Cohort analysis for subscription-based companies
Subscription-based SaaS companies (like Calm) can use subscription cohort analysis to identify which cohorts have high retention and remain subscribers for the longest time. Similarly, tiered subscription companies (for example, Canva or HubSpot) can identify which cohorts upgrade to more expensive plans and bring in the most revenue.
Subscription-based SaaS companies can conduct several analyses to understand why certain cohorts churn. Then they can work to improve retention rates.
Behavioral analysis
To conduct user behavioral analysis:
- Create behavioral cohorts by grouping users based on an action they take or don’t take within your SaaS platform. For example, segment users based on whether they’ve used a specific feature or not.
- Further narrow down your behavioral cohorts by separating users on actions they took within a specific time frame. For example, users who used a specific feature within the first week of subscribing to your platform.
- Analyze the different behavioral cohorts to see if the use of different features correlates with retention. For example, you might notice that users who sync your CRM to their Google contacts within the first week of using your platform have a higher retention rate than those who don’t.
Churn analysis
To conduct churn rate cohort analysis:
- First, define your cohorts (for example, the day users joined).
- Next, calculate the churn rate by looking at how many users who joined on a specific day returned on a later day. For example, what percentage of customers return on day five.
- Then, figure out if different factors affect churn. For example, you can group users by platform to see if different user experiences on different platforms contribute to churn.
- Once you have a hypothesis, A/B test product changes that could help confirm it using a tool like Amplitude Experiment.
Continue learning about churn analysis across industries and quarters in this video:
Revenue analysis
To conduct a revenue cohort analysis:
- Start by following the churn analysis steps and add the revenue each user contributes.
- From there, calculate revenue expansion and then compare revenue expansion across cohorts.
- Take notice of cohorts where revenue is expanding and explore why that might be.
- Then use experimentation to test your hypotheses.
How to implement SaaS cohort analysis findings
Once you’ve performed your SaaS cohort analysis, use the information you gathered to make product decisions that reduce churn.
To implement your findings:
- Identify “problem” cohorts that churn after a short time using one of the cohort analysis for SaaS methods above.
- Develop a hypothesis for what’s causing the problem. For example, perhaps people who don’t use your contacts sync feature within the first week don’t experience the full value of your SaaS software, so they churn quickly.
- Conduct A/B testing to check your hypothesis and better understand the problem cohorts. Be aware that this investigation will be complex because it’s often a combination of things that keep users engaged and retained.
- Based on the A/B test results, modify your software accordingly to address the problem area.
- Repeat the cohort analysis and hypothesis testing process to identify any additional problem areas and reduce churn.
SaaS cohort analysis: The key to increasing CLV
Customer lifetime value (CLV) tells you how much revenue a typical customer brings over the course of their relationship with your platform. For example, if customers pay a monthly subscription fee of $10 and typically churn after 12 months, your CLV is $120. You’ll also see this term abbreviated to lifetime value (LTV).
If you understand which types of users have high CLV, you can take action to attract similar users. You can also encourage others to take actions you’ve proven are correlated with high engagement and retention.
Because SaaS cohort analysis lets you see when customers (end users or customer accounts) churn, it means you can measure and track CLV. Cohort analysis also helps you increase CLV. You’re able to see, for example, which user cohorts lead to the most revenue and then craft your marketing campaigns to target those users or tailor your product decisions to better serve them.
With subscription cohort analysis, you also get indications of why people are churning, so you can fix those issues. Let’s say you notice there are high churn rates for users in your basic subscription plan. You could add more product features to that basic pricing plan to provide more value to those users and discourage them from churning.
Additionally, you can identify how behavioral metrics impact CLV so you can optimize your software. For example, if you notice that users who enable push notifications tend to stay engaged with your SaaS platform, you might experiment with encouraging all users to enable notifications during onboarding. You’ll want to run A/B tests to see if that product change causally increases engagement.
Understanding cohort analysis metrics
Besides CLV, the standard metrics for SaaS cohort analysis are customer retention or churn—how many customers return or leave in a given time period, respectively. If the churn rate is higher than average for a specific cohort, you know you need to focus your attention on that cohort.
You can also look into metrics that give you more information about how much revenue different cohorts bring in, such as average revenue per user (ARPU) and customer acquisition cost (CAC).
Top 3 types of cohort analysis
For your SaaS cohort analysis, you can choose which type of cohorts you separate your users into. The top three types of cohorts are acquisition cohorts, behavioral cohorts, and predictive cohorts.
Acquisition cohorts separate users based on:
- When then signed up
- How they signed up (their acquisition channel)
Behavioral cohorts separate users based on actions they take or don’t take, and actions they take within a specific time frame. For example:
- In a CRM platform: users who added X number of contacts or launched a marketing campaign in the last week
- In a project management platform: users who activated desktop notifications
Predictive cohorts separate users based on the likelihood that they’ll perform a specific action in the future.
Cohort analysis template
You typically conduct SaaS cohort analysis in a cohort table. On the table, you’ll see:
- A row for each cohort of users (e.g., joined July 6, joined July 15)
- Columns for each day, week, or month after the cohort was created (day zero is the day the users joined)
- Cells that usually show the churn rate or retention rate on each day
In the cohort table above, you can see the retention for users who joined on July 6 is only 6% by day five. That means 94% of users churned—a leaky bucket. Try exploring this data for free using Amplitude’s self-service demo, then navigate to this example cohort table.
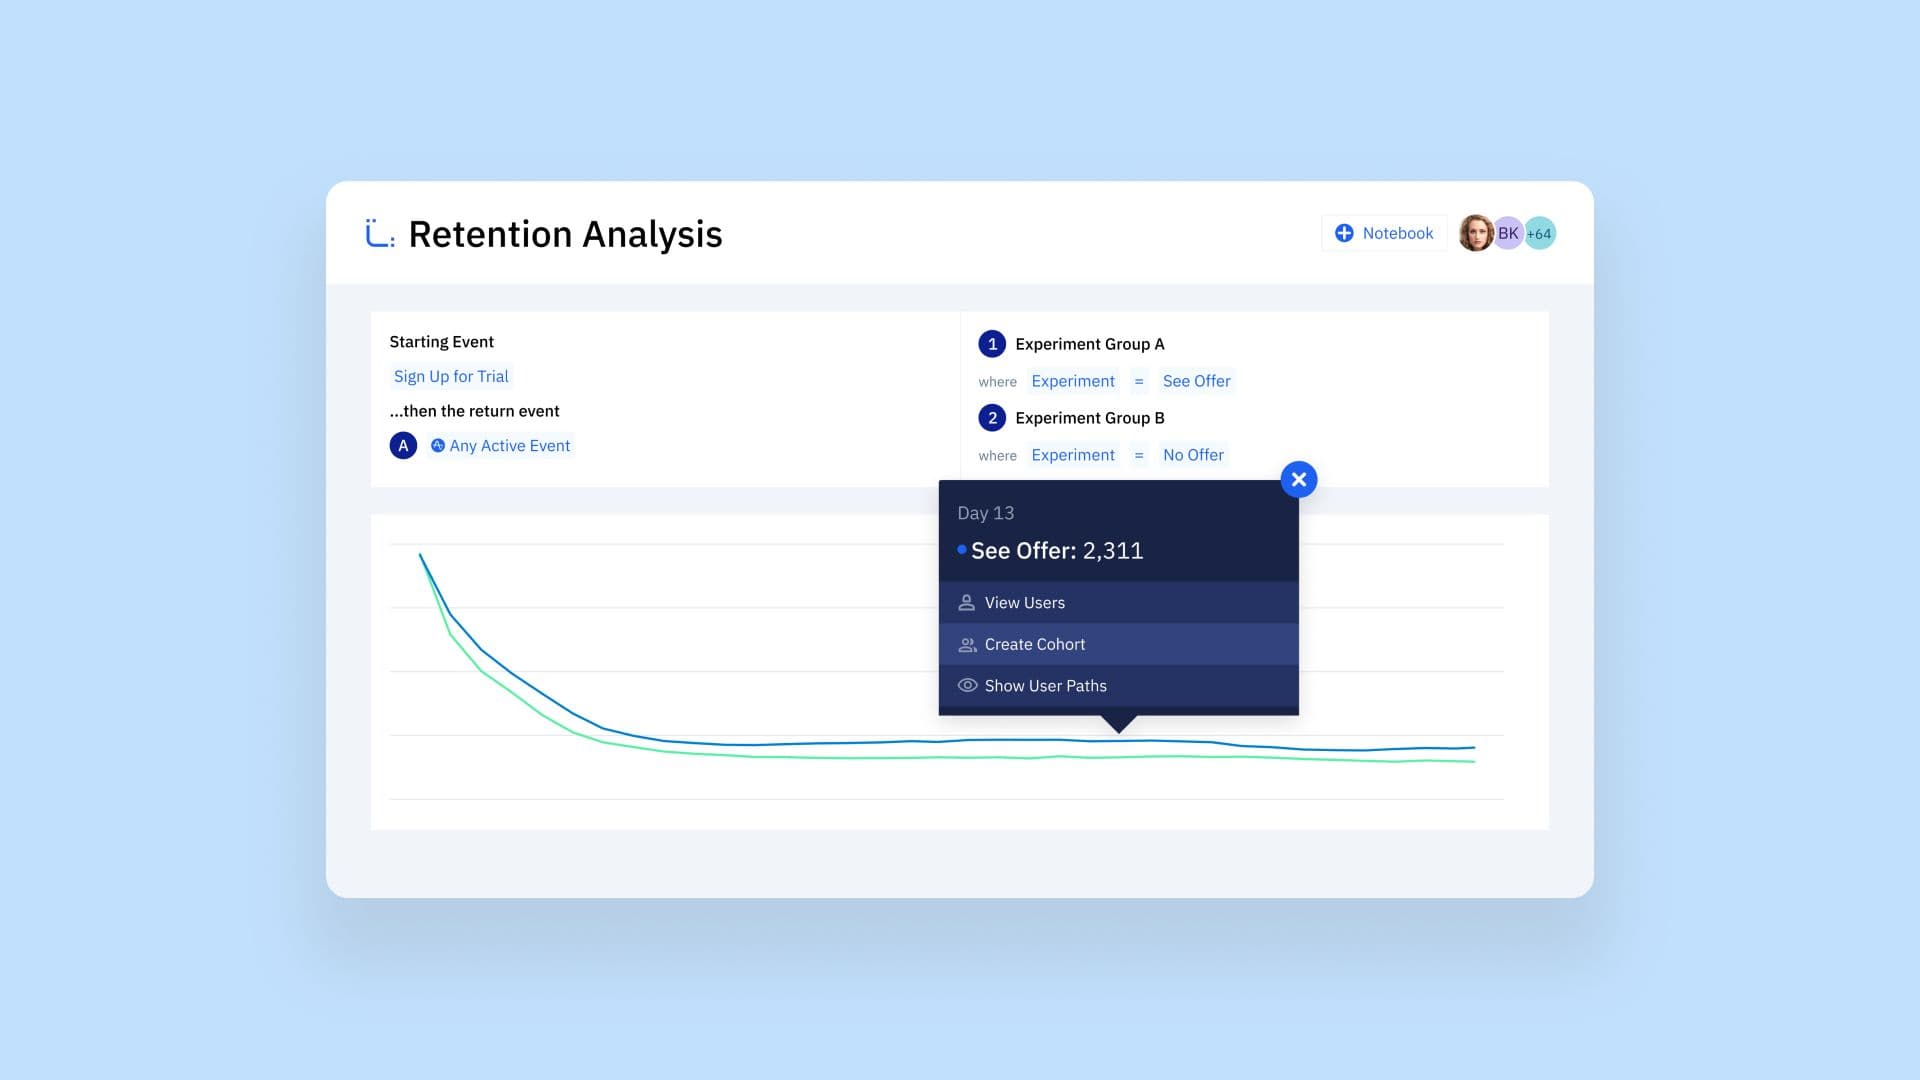
You can better visualize this cohort table by building a retention analysis curve.
Using Amplitude’s Retention Analysis chart, you can see an immediate problem—only about 10% of users remain after the first day. This could indicate your SaaS product has a complicated onboarding, missing call-to-action, technical issue, or something else. You can test your hypotheses through experimentation, then rectify the issues and reduce churn.
Ready to explore cohorts in your SaaS product and start improving retention today? Get started for free using Amplitude, or check out our Mastering Retention playbook to learn more.
References
- Cohort Analysis: Reduce Churn & Improve Retention. Amplitude
- Why cohort analysis beats all other approaches to calculating LTV. Lifetimely
- 8 SaaS metrics you should be monitoring. Webflow
- A beginner’s guide to cohort analysis: How to reduce churn and make better product decisions. Appcues


Carolyn Feibleman
Principal Product Manager, Amplitude
Carolyn Feibleman is a principal product manager at Amplitude, where she focuses on helping companies adopt digital analytics to build better products and experiences.
More from Carolyn


