E-commerce Dashboard
Boost your e-commerce strategy with our dashboard. Track customer visits, acquisition sources, and purchase conversion. Gain insights into user behavior and compare platform conversions. Identify trends and high-converting traffic sources. Ideal for teams in e-commerce looking to drive sales growth and enhance user experiences.

About this template
Amplitude's e-commerce dashboard offers a robust view of charts to help measure customer acquisition, customer experience, and overall top-line business metrics for your e-commerce business.
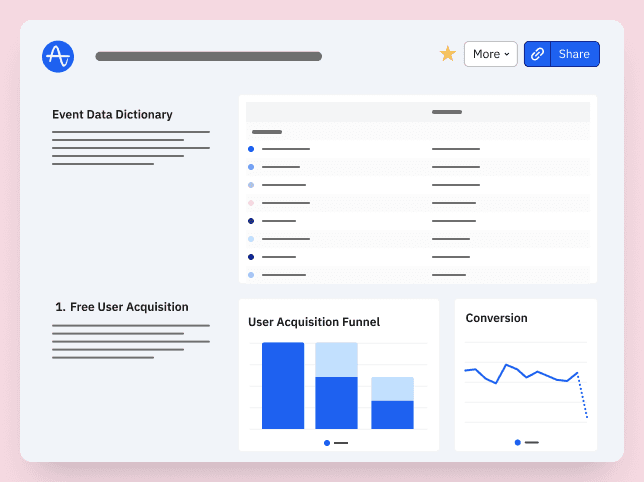
Customer Acquisition Charts
- How many unique customers have visited your shop in the last 30 days?
- How are customers finding your store?
Customer Experience Charts
- How many visitors end up making a purchase?
- How long does it take a visitor to make their first purchase?
- How does conversion compare between platforms?
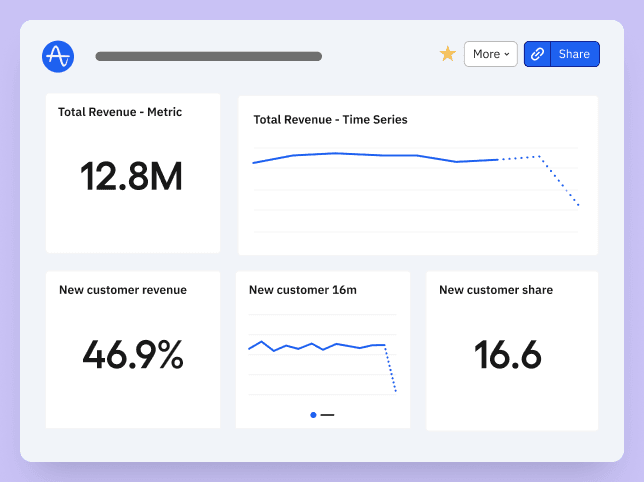
Top Line Business Metrics Charts
- How many purchases are made weekly?
- Where are your paying customers from?
- How many items did users view before purchase?
- Which traffic sources have the highest purchase conversion?
How this template works
About Amplitude
Frequently Asked Questions
Amplitude is a leading digital analytics platform that helps companies unlock the power of their products. Amplitude guides companies every step of the way as they capture data they can trust, uncover clear insights about customer behavior, and take faster action. When teams understand how people are using their products, they can deliver better product experiences that drive growth.
Yes, Amplitude is free to get started. Our Free plan includes 2 million events per month, out-of-the-box Analytics and templates, Session Replay, Web Experimentation, and more—all at no cost.
Related templates

Media Dashboard

Interim Product & Growth Executive, Board Member
Product-Led Growth Template Dashboard by Leah Tharin

Session Engagement Dashboard

Founder & Data Engineer @ Deepskydata


