Event flows: See the most popular paths in your app
You have your funnel set up. You can see exactly where your users are dropping off, but what are they doing instead?

Update: Event Flows is the new and improved Pathfinder! You can see it in action here.
You have your funnel set up. You can see exactly where your users are dropping off…but what are they doing instead? Are they getting stuck? Taking some other action that you should be paying more attention to? Exiting the app? You could try constructing funnel analysis for each of these alternate paths to find your answer, but that could take a lot of time and guesswork if there are many possibilities. This week, we’re happy to announce Event Flows, a feature that eliminates the uncertainty and tells you exactly what your users are doing, and how many of them are doing it.
Event flows show the most popular paths that users take within an app. You can choose to view either outgoing flows (events that happen after a selected event) or incoming flows (events that happen before a selected event). Flows are measured for events that happen within the same session — that is, if a user performs a series of actions and then closes or backgrounds the app, the actions that he/she takes the next time they open the app will not add on continuously to flows from the previous session. You can find Event Flows under the ‘Events’ tab and the ‘Flows’ sub-tab:
To see event flows, first pick a starting, or root, event. In the example below, we’ve selected [Amplitude] Start Session as the root event, which is the default event that is triggered when a user opens the app.
From the flow below, we can see that [Amplitude] Start Session was triggered 1,187 times. From there, you can see the 5 most common events that follow Start Session. The PROMPT event was the most common next event, occurring 37.57% of the time, followed by the OPEN event 31.93% of the time.
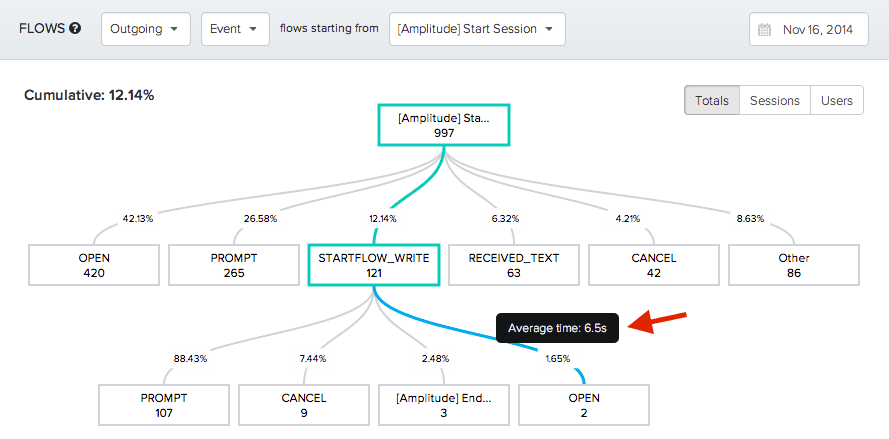
You can trace event flows for up to 5 levels. The percentage between each step shows the percentage between that step and the immediately previous step. The cumulative percentage in the top left corner shows the overall percentage for the highlighted path. You can also view the average time elapsed between 2 steps by hovering your cursor over the connecting line between 2 steps.
In addition to totals, you can view event flows by sessions and by users. A more detailed explanation can be found in our docs. Event Flows provides an overview of common paths that users take within your app. This can help you identify where users are getting stuck, discover new trends, and see where you can better optimize. We hope you enjoy using it! As always, we’re available at support@amplitude.com to answer questions you have about Event Flows, or anything else!

Alicia Shiu
Former Growth Product Manager, Amplitude
Alicia is a former Growth Product Manager at Amplitude, where she worked on projects and experiments spanning top of funnel, website optimization, and the new user experience. Prior to Amplitude, she worked on biomedical & neuroscience research (running very different experiments) at Stanford.
More from AliciaRecommended Reading

Lessons from consolidating our MCP server
Oct 6, 2026
10 min read

What AI engineers do in the age of agentic code
Oct 1, 2026
14 min read

An analysis of Jev: Faster and cheaper, but watch the accuracy
Sep 28, 2026
13 min read

Your agent isn’t broken. It’s guessing.
Sep 23, 2026
6 min read
Explore Related Content
9 Top Feature Flag Solutions for Modern Product Teams in 2026
Jan 27, 2026
Using behavioral analytics for growth with the Amplitude app on HubSpot
Jun 17, 2024
10 min read
Identity resolution: The secret to a 360-degree customer view
Feb 16, 2024
10 min read
Inside warehouse-native Amplitude: A technical deep dive
Jun 27, 2023
15 min read
5 Proven Strategies to Boost Customer Engagement
Jul 12, 2023
Designing High-Impact Experiments
May 13, 2024
9 direct-to-consumer marketing tactics to accelerate ecommerce growth
Feb 20, 2024
10 min read
Leveraging analytics to achieve product-market fit
Jul 20, 2023
10 min read