Should You Adjust Your Core Metrics Over Time?
Your customers' preferences are going to evolve so it only makes sense that your metrics evolve to keep pace.
Should the core metric you defined when you started building the product be the same 1, 3 or 10 years into its lifetime? On one hand, your product might change in the early phases, but its core purpose is probably going to remain consistent. And your users are still those same people who are attracted to that core value.
Or are you asking for trouble when you cling onto your early metrics for too long? Spoiler: it’s asking for trouble.
Tracking the same metrics indefinitely is a problem because it leads to missed opportunities for growth. As your product grows and your user base becomes more savvy, you have to dive deeper into the data and adjust your core metrics over time — it’s your best chance to learn more about users and build the best product.
Just because you started out tracking one specific metric, doesn’t mean you can’t eventually branch out to include others. Your customers’ preferences are going to evolve so it only makes sense that your metrics evolve to keep pace. Here’s how to manage the shift.
The lifecycle of core metrics explained
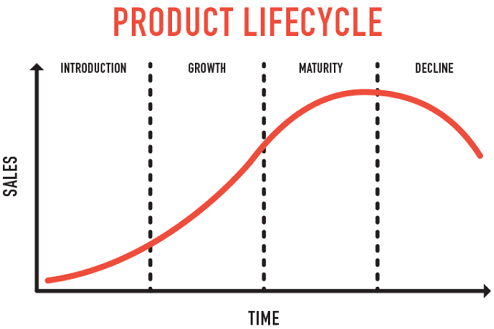
When it comes to tracking SaaS core metrics, what you track depends on where you are in the product lifecycle. Not only do sales increase over time but so does the user base and its corresponding data. There’s no way a startup can track the same metrics as a mature company. Based on the graph below, they’re in very different places. “Premature scaling,” defined as placing too much focus on one aspect—or metric—of the business without balancing anything else, is the number one reason why most startups fail. Source

The metrics you track need to line up with your location in the lifecycle. Startups don’t have access to reams of data so they have to start simple and track what they have — like the number of daily signups. As their user base grows and more data becomes available, metrics naturally shift to look at more specific information like user activity levels and user behaviors.
Metrics shift over time depending on the product lifecycle
The metrics you use depend on where you are in your product’s lifecycle. As your database grows, start with basic metrics and progress to more complex ones over time. You’ll gradually need to dive deeper as your data becomes deeper and wider to understand your users. You have to have the “right” data available to make complex metrics meaningful.
Introduction or startup phase
Once you’ve figured out product/market fit, your main focus is getting your product out in front of your target audience. In this phase, your role involves learning and listening to early user feedback. The main metric startups are equipped to track at this point is conversion rate. How many users who visited your site or downloaded your app ended up signing up or making a purchase? There won’t be a lot of data yet since you’re still refining your messaging and people are just discovering you.
But you can use what you have to get a sense of the types of users you’re attracting. Are they the target audience you’re after? Does early feedback confirm you’re effectively solving their problems? In addition to conversion rates, you can begin to pin down demographic user data. Use this time to learn about your users. For instance, where are they located and what are their demographics? User demographics will allow you to segment users and run experiments or beta test later on.
All of this information forms the base you’ll need to grow and will feed into higher levels of data analysis. In these early days, startups should track everything they can because chances are it’ll come in handy at some point.
Growth phase
Some companies are privileged to enjoy viral growth at this stage in the product lifecycle while others experience slower but steady growth. Either way, this phase is where you start to see profits as your product gains more upward momentum and user awareness. However, this is also the most difficult phase because it’ll make or break your product. Competitors are attracted to the market so unless you have a standout product, it won’t survive this stage.
Related reading: Why Going Viral is Overrated
At this point you’re receiving more user data and depending on your product type, the data you receive will give more insight into exactly who your users are. You’re more aware of their preferences and behaviors and can begin to make product adjustments based on this. Now you’re ready to calculate customer acquisition cost (CAC) and lifetime value (LTV). CAC refers to how much it costs you to acquire new customers and is calculated as follows:
Cost to produce your product ÷ no. of new customers you bring in = CAC
LTV is an estimate of the revenue you’ll receive from customers over the duration of their relationship with your product. There are a few different ways to calculate it but the simplest way is: [Source]

These are important to track at this point because if CAC begins to rise above LTV, something’s wrong. Ideally, the ratio between CAC and LTV should be 3:1. This means that the value of a customer should be three times the cost it takes to acquire them.
If CAC is higher than LTV, drop everything and focus on figuring out what’s causing the imbalance before moving forward. Not doing so could stall your other growth efforts.
Maturity phase
Products that reach maturity have succeeded in carving out a niche for themselves. However, new challenges arise at this point. Namely market saturation.
There are so many other competitors available that unless users know your product well, they’re going to move onto something else. That’s why measuring retention at this point becomes more important. Of the users you’ve attracted, how many have stayed loyal and continued to use your product? While it’s important to attract new customers, your success lies in your ability to keep users coming back. In addition to tracking retention, you have to track churn. Most companies calculate this based on monthly recurring revenue (MRR).
Of your MRR at the beginning of the month, what percentage of this was lost during the month. It’s important to note that if you also accept annual recurring revenue (ARR), divide this by twelve to get an accurate calculation of churn. By not including it you’ll likely underestimate churn, and speed towards decline faster than you expected.
Decline phase
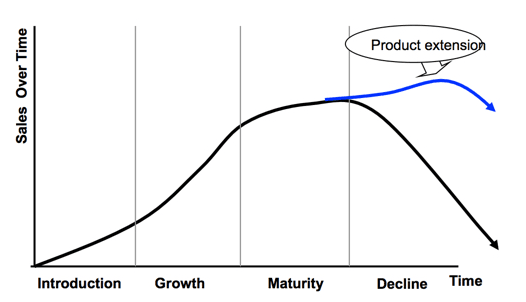
Don’t let the name fool you. Yes, products that reach this stage are no longer relevant to wide audiences because newer more efficient products have emerged and profits have started to drop. However, companies that research emerging opportunities can experience product extension and begin at the introductory stage again. So instead of sinking into obscurity, products are re-born. [Source]

A good metric to track when you’re in decline but contemplating product extension, is burn rate. At this point you’re probably spending more money than you’re making, so calculate what your losses are. Depending on how quickly you hemorrhage money, it’s a good indication of when to stop what you’re doing and look for new opportunities.
Related: User Retention Strategies Across All Stages [Slides]
What’s important to note about all of these stages is they act like a tiered system. Start tracking conversion rates again and gradually shift metrics as new data becomes available. Treat this as though you’re starting from scratch and gradually track more in-depth metrics as you get more information. You’ll have new users and new behaviors to track. This is a foundation and helps build the next level of the tier because you’re constantly adding new customers.
There’s no shame in shifting core metrics as you scale
It’s vitally important to know which stage of the product lifecycle you’re in to capture the most relevant information in each stage. Look at the data you collect in the early stage as a foundation for metrics to come later on.
The difference is, you’ll be able to manipulate it in more depth to glean insights that are relevant to each lifecycle stage. Also, don’t be afraid to go beyond standard metrics and track core product metrics that are the most relevant to your product.
If you have a health and diet tracking app, encourage users to enter as much information about their daily activity levels and diet as possible. The important metric for you might be to track how many users meet their goals when they commit to entering more data. Be flexible and figure out what customer success looks like to you. Once you have that, build unique metrics around that and track. Adjust these metrics as needed, because user preferences and behaviors are going to change over time.

Alicia Shiu
Former Growth Product Manager, Amplitude
Alicia is a former Growth Product Manager at Amplitude, where she worked on projects and experiments spanning top of funnel, website optimization, and the new user experience. Prior to Amplitude, she worked on biomedical & neuroscience research (running very different experiments) at Stanford.
More from Alicia


