The Foundation for Great Analytics is a Great Taxonomy
Establishing a solid foundation with a quality instrumentation is critical to maximizing the value you get out of your product analytics platform, and giving your team the confidence to make decisions independently.
Behind every great piece of user behavior analysis is a great event taxonomy – the collection of events and properties you use to define actions your users can take within your product. Think of the event taxonomy as the foundation for all future analysis you’ll do with your analytics platform. It’s crucial to get right. And from what we’ve learned working with thousands of customers, instrumenting and maintaining a clean and consistent taxonomy is also one of the most challenging steps to successfully leveraging a product analytics tool.
Instrumentation problems fall into three key areas of data clarity, integrity, and mutability. If event names are unclear and no one in your organization knows what your event data means, your team can’t build confidence in their ability to answer questions about their user behavior. If the wrong events are tracked or events keep changing, it becomes nearly impossible for your team to utilize your product analytics tool because end users are unsure whether or not they should trust the data.
Taxonomy is a new product we built to specifically address common instrumentation pain points around data clarity, integrity and mutability. It has helped product teams at OkCupid and Paypal create 100% confidence in the insights they generate using Amplitude. Read on to learn more about how Taxonomy solves these common problems.
Data Clarity
We’ve often observed that end users who aren’t involved in the instrumentation process have no idea what event data means. Even with the best naming conventions, it’s difficult to have the right context.
Related Article: Amplitude Launches Four New Product Offerings
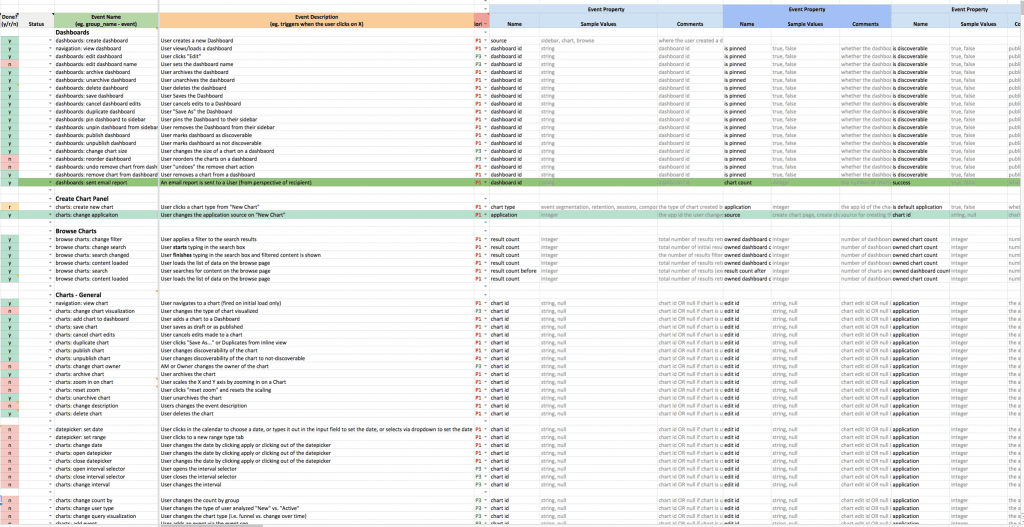
Traditionally, many teams maintain an external document like the one we used to maintain below, but this can quickly fall out of sync, may not be easily accessible, and is out of context when doing your own analysis.
How we previously documented our event data in Amplitude.
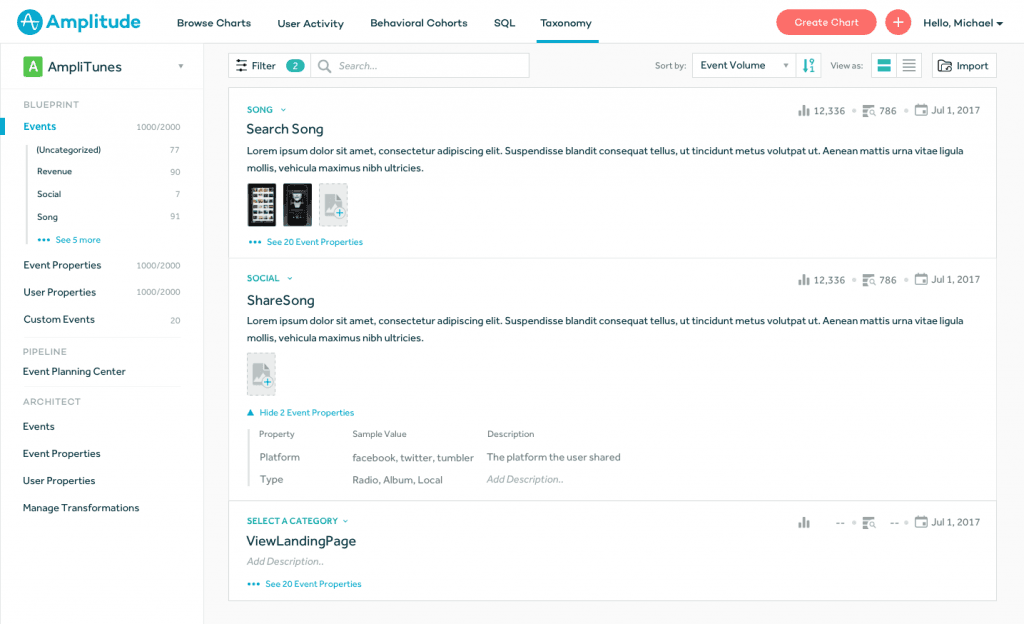
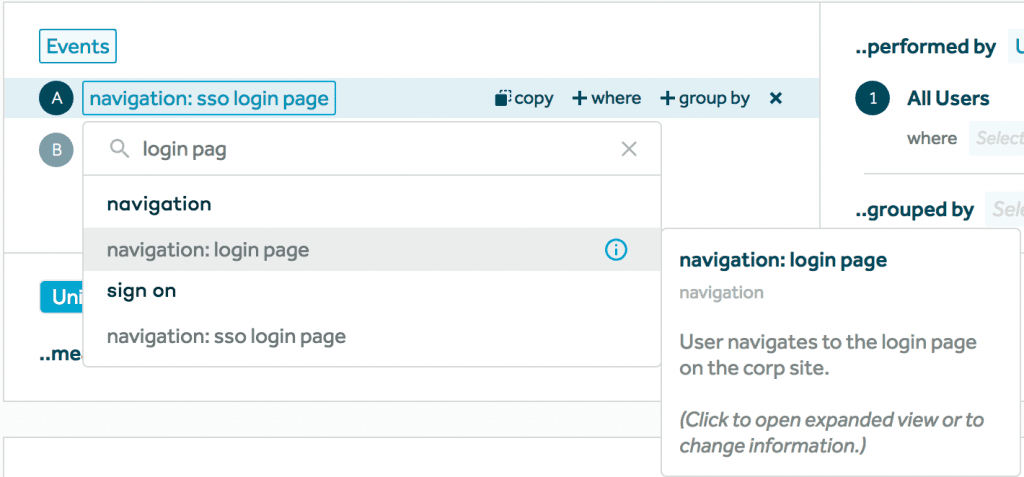
We built Blueprint to be a central source of truth for teams to maintain documentation about their instrumentation. With categories and descriptions for event types and properties, all team members are able to understand exactly what they are looking at. Built directly into Amplitude, anyone can view these details so no one is blocked on answering any question.
Blueprint in Amplitude
Tooltips in Amplitude charts.
Data Integrity
With multiple, sometimes hundreds of individuals contributing to the same shared resource, it can be incredibly difficult for instrumentation managers to maintain the integrity of their implementation and ensure that only the right data is being tracked. Previously, instrumentation managers were blind to any new data being instrumented, only finding out about mistakes, or bad data days, or even weeks after the fact.
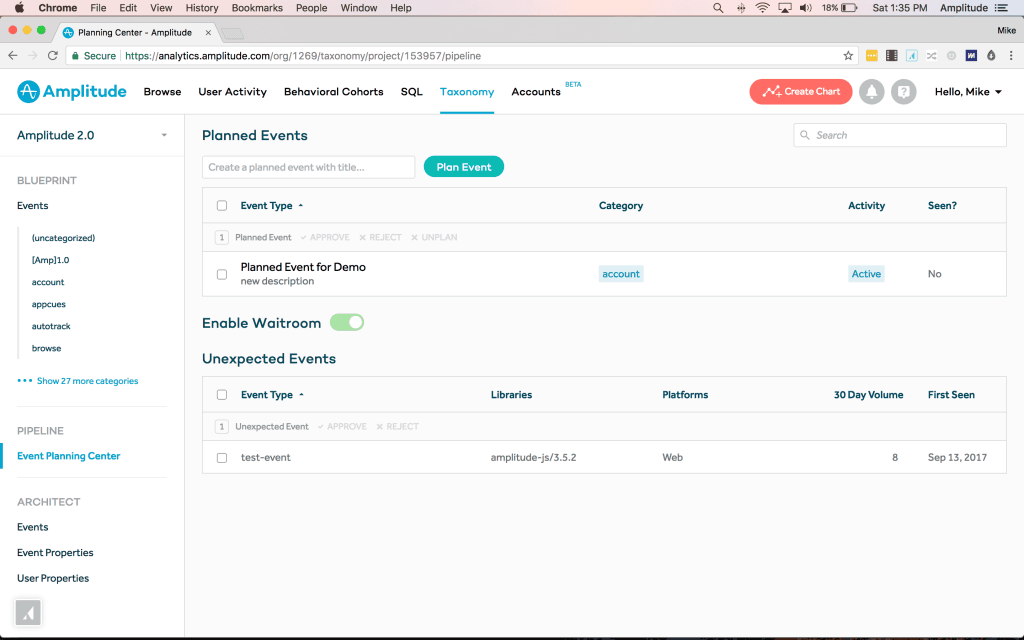
Pipeline is a powerful new way for instrumentation managers to take more control over the event data coming into Amplitude. Teams can plan their instrumentation, approve or reject and be notified of new events that Amplitude sees for the first time. Even on teams with multiple contributors to the same instrumentation, Pipeline allows owners and instrumentation managers the ability to recognize and capture differences in the data they expect to see, and are actually collecting.
Pipeline
Data Mutability
Mistakes in implementation happen. Tracking requirements change. Historically, when these things occurred, teams needed to prioritize engineering resources and deploy new code, wasting precious resources on avoidable problems. Worse, data discrepancies are created creating experiences like these:
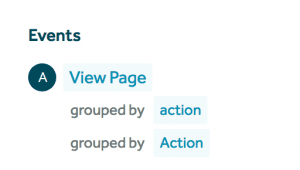
In this example, the way the event property “Action” was implemented was changed, and now there are discrepancies when looking at the data.
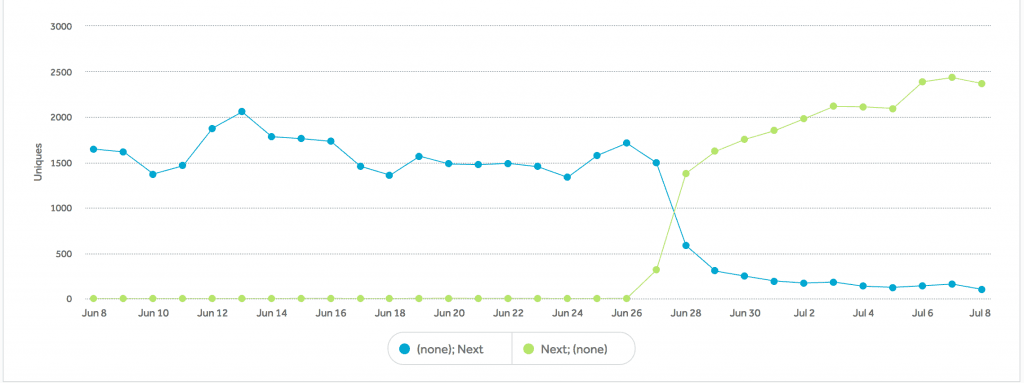
Architect allows teams to manipulate their event data to suit their needs. This empowers them to fix instrumentation mistakes, or change tracking requirements, all without deploying new code or prioritizing valuable engineering resources.

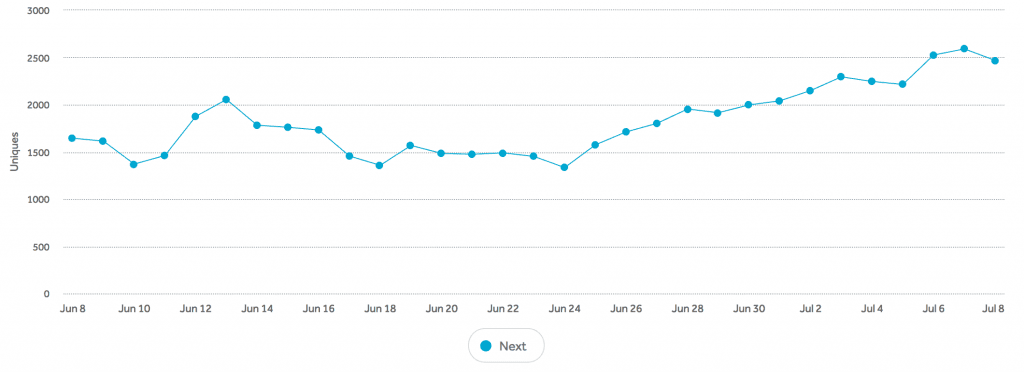
Capturing accurate data is the single most important factor in using product analytics to successfully build better products. Small mistakes can lead to messy setbacks, distrust in the data and incorrect conclusions. Establishing a solid foundation with a quality instrumentation is critical to maximizing the value you get out of your product analytics platform, and giving your team the confidence to make decisions independently.
Get in touch with us to learn more about how Taxonomy can help you master your product’s event taxonomy quickly and easily!
Curious to learn more instrumentation and event taxonomy best practices? Watch our deep-dive webinar for free here.

Mike Ottavi-Brannon
Former Principal Product Manager, Amplitude
Mike is a self-proclaimed amateur chef and former Principal Product Manager at Amplitude where he ran the Analytics product group.
More from Mike


