How COVID-19 Impacted Consumer Trends Across 5 Industries in 2020
See the original data that show how digital trends changed in streaming media, fintech, B2B, ecommerce and consumer tech in 2020.
It’s no surprise that 2020 profoundly changed our digital habits. Baby Boomers embraced online shopping. Zoom became an everyday part of life. App-based delivery soared as did streaming media at home.
Original data from Amplitude—the operating system for digital business—shows exactly when the pandemic set the course for new digital trends in fintech, B2B SaaS, ecommerce, streaming media, and consumer tech.
Almost every industry saw a surge of daily active users in March, when shelter-in-place orders went into effect around the world. As the year continued, some industries resumed pre-pandemic patterns, while others raised the floor for consistently higher levels of daily activity.
Ecommerce
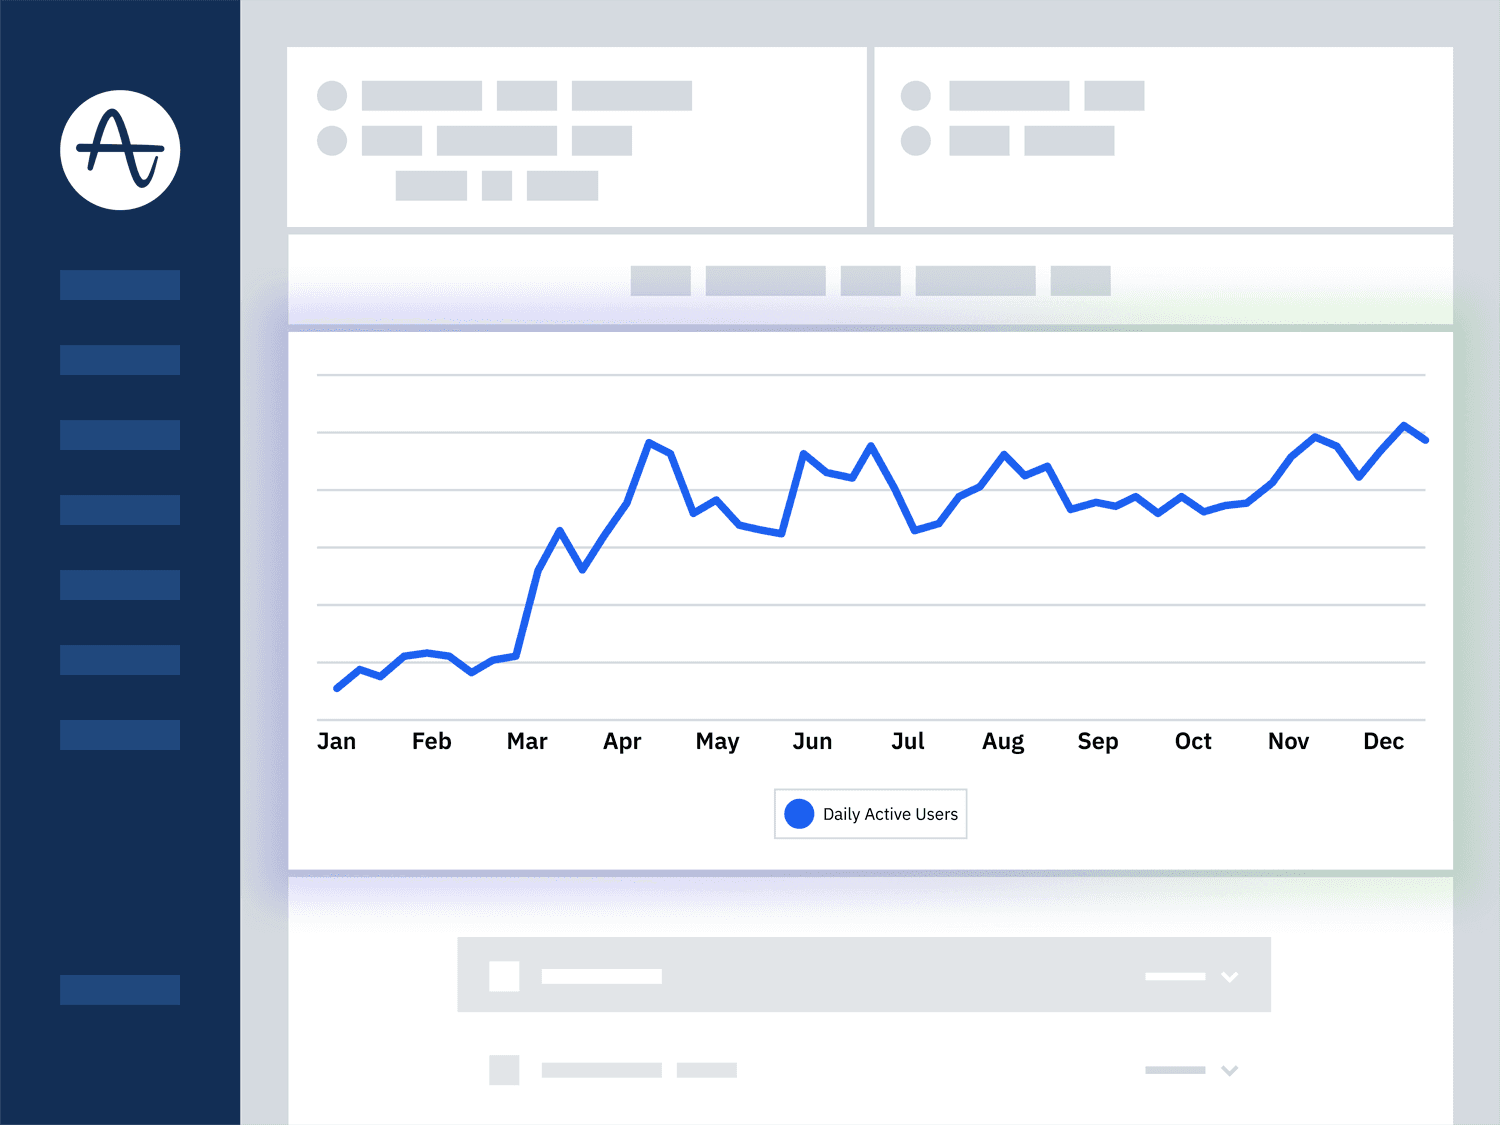
Daily Active Users of ecommerce apps, websites and digital products in 2020
Daily active users of ecommerce apps and websites surged in the second week of March 2020 and continued to rise throughout April. By May 2020, these peaks in usage had become the new norm, and this level of activity has sustained.
Compared to the pre-pandemic activity of January and February, this new baseline for ecommerce usage is 75% higher than the levels seen in January and February 2020. Our friends at Shopify, Shipt, and Imperfect foods have a lot to say about the impact this had on their businesses.
Streaming Media
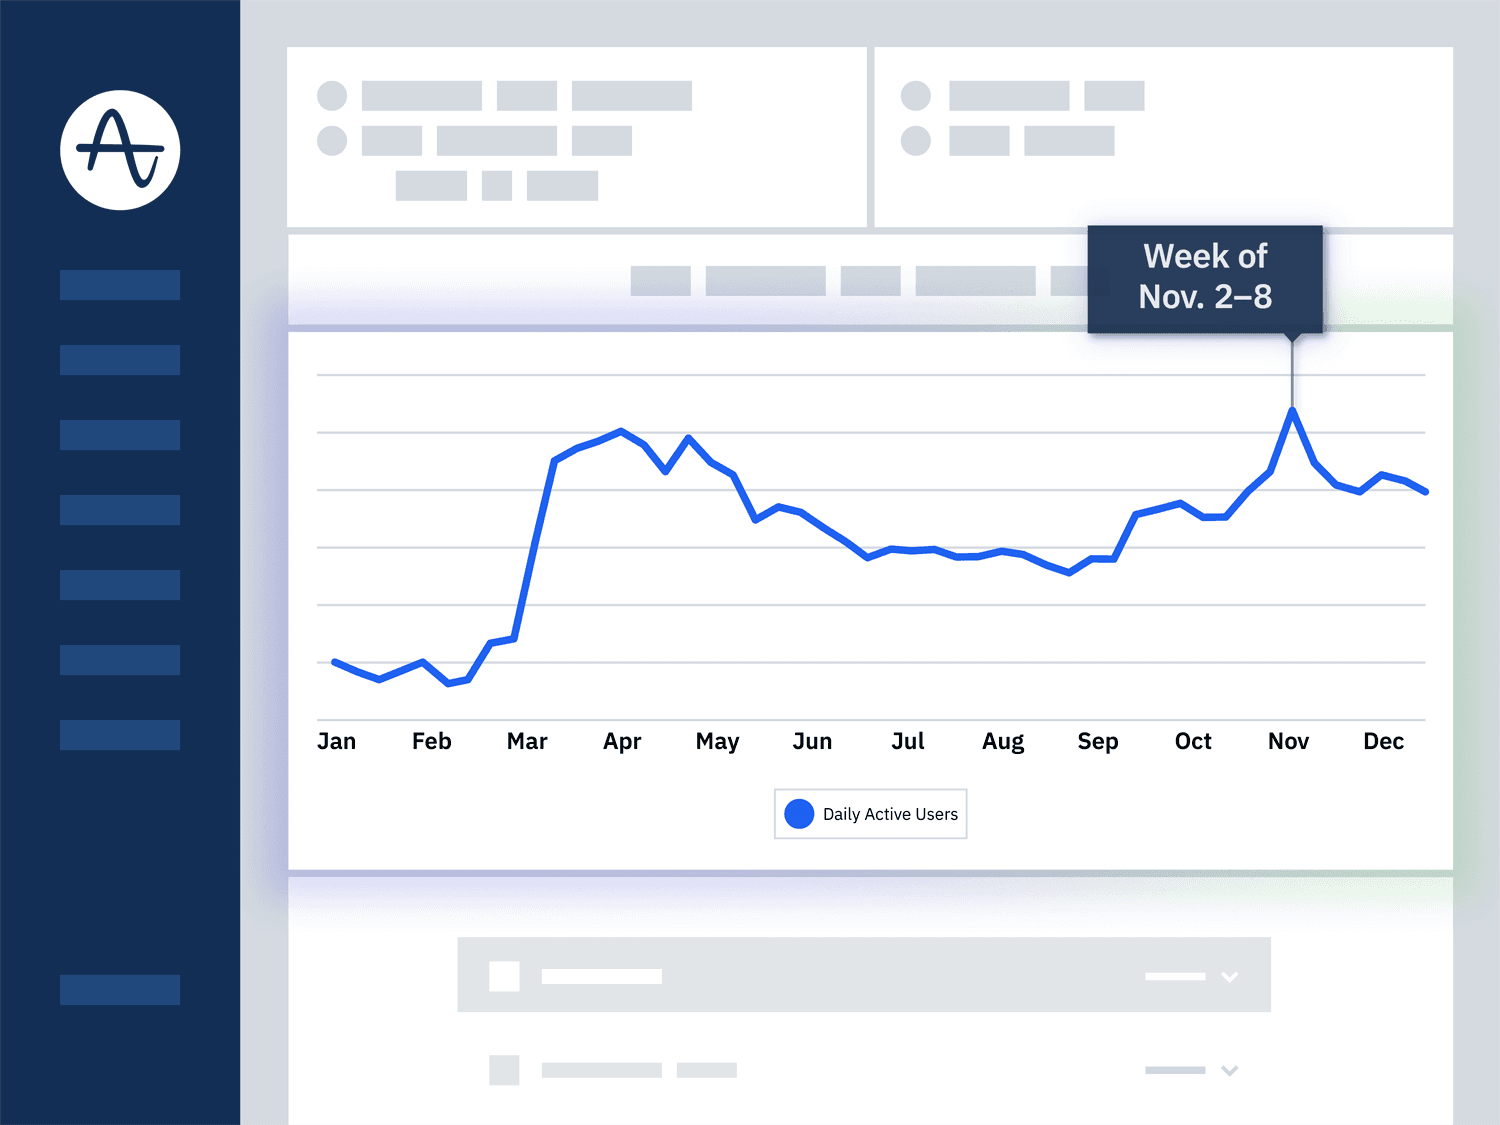
Daily Active Users of streaming media apps, websites and digital products in 2020
Similar to ecommerce, streaming media saw two immediate spikes in usage in March 2020: the first on the week of March 9th, and the second on the week of March 16th.
Media activity maintained its new highs throughout the spring, with a dip and plateau during the summer months. Even this activity, however, was far above the levels seen pre-pandemic.
Come fall, daily activity of streaming media reached spring levels once again, which suggests the summer might be seasonal behavior reflective of a larger trend: live sports viewership dropping during the pandemic.
Even so, 2020 still presented some surprises in media activity. The highest peak for daily active users of media apps and websites occurred during the week of November 2nd: the week the world was glued to the news, awaiting the results of the U.S. presidential election.
As streaming media booms, the need to understand this growing audience has become critical. Amplitude customer NBC Universal is among many media companies evolving quickly to turn user behavior data into actionable insights that their product teams can use to build more engaging experiences.
B2B SaaS
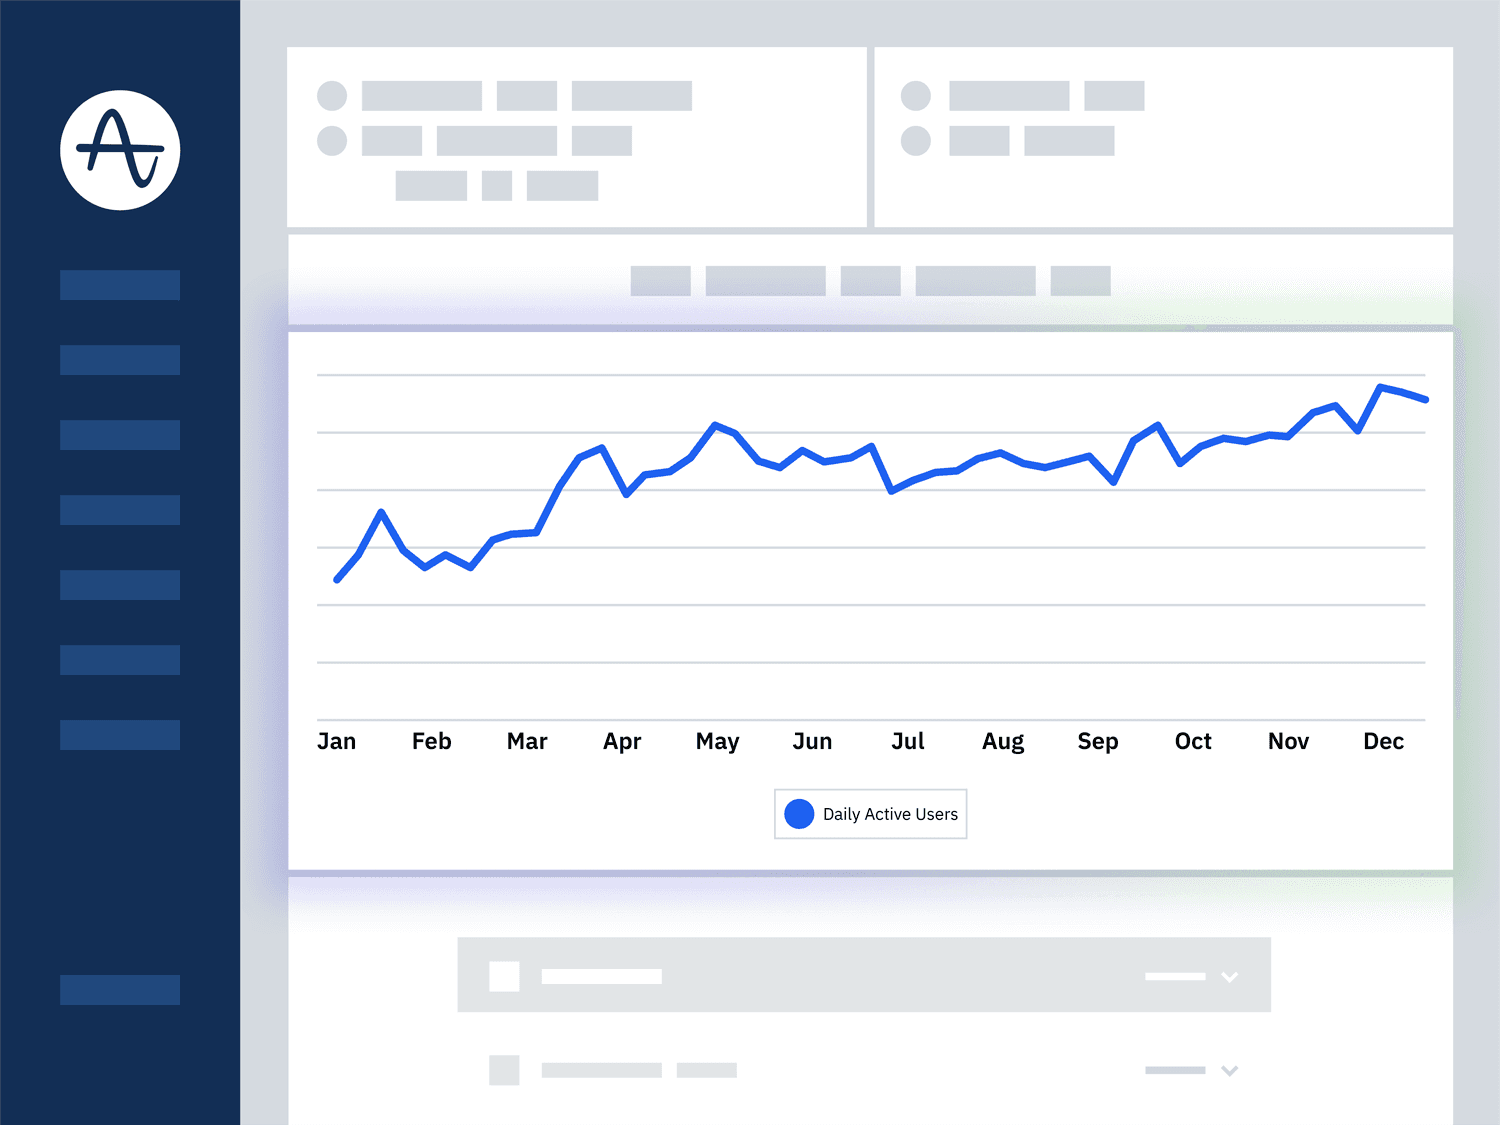
Daily Active Users of B2B apps, websites and digital products in 2020
B2B digital products experienced a noticeable uptick in late March 2020 followed by a two-week surge in April, setting a new base level for the rest of the year accompanied by a slow but steady climb.
The gains in daily activity on B2B products—substantial but less pronounced than gains seen in media and ecommerce—could be reflective of the fact that many businesses were already using B2B software in daily work, such as products by Amplitude customer HubSpot. As it became clear in April 2020 that remote work would not be a three-week state of affairs, businesses likely purchased more B2B products that led to the increase in daily active users.
Consumer Tech
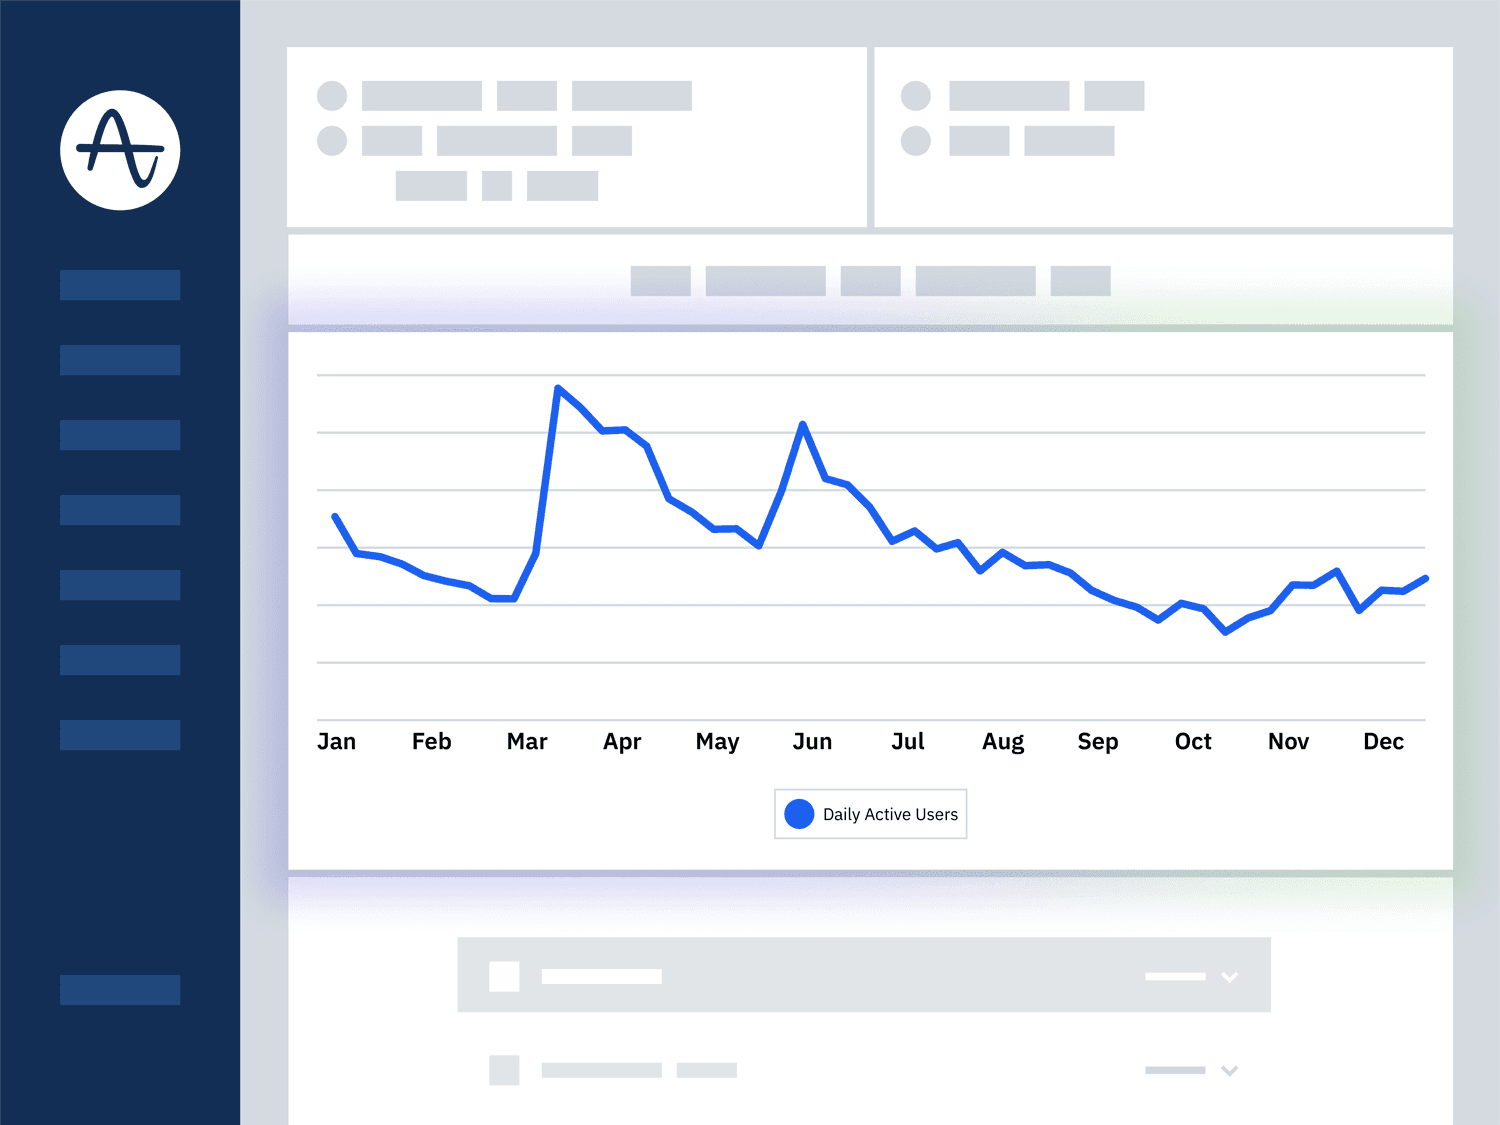
Daily Active Users of consumer tech apps, websites and digital products in 2020
Consumer tech—consisting of B2C products like mobile gaming apps, desktop apps and IOT devices—spiked in mid-March. While the industry maintained this spike throughout April, consumer tech usage returned to previous levels throughout most of May before spiking again in late May and early June. For consumer tech as a whole, the number of daily active users returned to pre-pandemic levels by summer 2020.
This spike-and-return pattern is slightly misleading; of the industries tracked in this report, consumer tech already had outsized numbers of daily active users. Indeed, its floor nearly matches ecommerce’s current ceiling. As Nick Aldershof, leader of OkCupid’s analytics team, said recently, their service makes 4 million connections every week, over 200 million a year, and 5 million introductions a day. Extrapolate that data out to the thousands of other popular consumer tech apps, and you’ll see what we mean.
The trend we see suggests that consumers increased their already high-levels of usage for these apps and then returned to normal fairly quickly.
Fintech
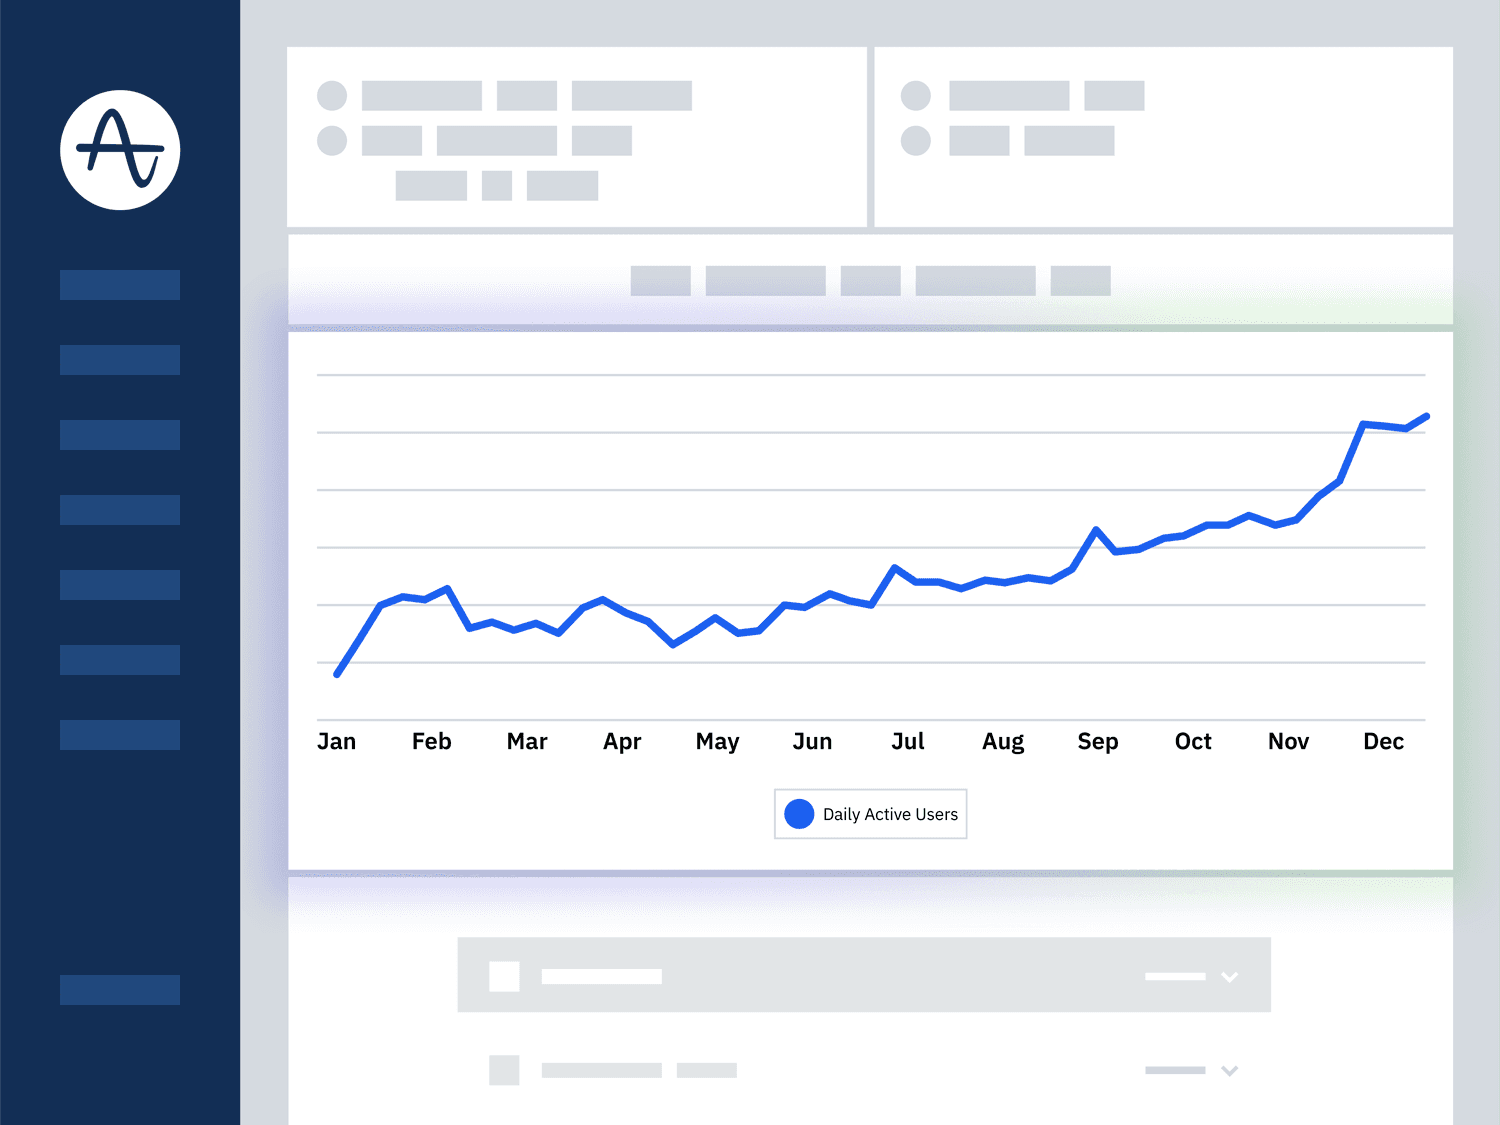
Daily Active Users of fintech apps, websites and digital products in 2020
While fintech usage increased throughout 2020, the digital trends in March present a different story than other industries: daily active users of fintech apps and websites actually decreased slightly in March following a steady rise in February.
By mid-summer, though, fintech usage picked up pace again. Come December, fintech activity had more than doubled compared to January levels. This pattern comes as a result of years of steady progress and innovation. Although finance and banking can often be seen as conservative and safe in regards to digital roadmaps, fintech product teams have stepped up to meet the changing habits and needs of consumers who demand more personalized, thoughtful experiences online — and can now more easily switch to competitors when those needs aren’t met.
Amplitude customer SoFi, for example, is helping meet these challenges by enabling self-service data across their team. You can learn more on how they accomplished this by reading the story of SoFi’s Principal Product Owner, Phillip Lee.
Getting ready for 2021
No matter what industry you’re in, thriving in a digitally transformed landscape requires an understanding of product-led growth and how to keep your digital customers coming back over time. Product-led businesses are more than 5.5x more likely to see >25% revenue growth year over year.
That’s why we organized AmpliTour — the first stop on your journey to product-led growth. Attend one 90-minute session, and you just might become an analytics rockstar. Join one of our live sessions, coming soon to a Zoom near you.

Mallory Busch
Former Senior Content Marketing Manager, Amplitude
Mallory Busch formerly ran the Amplitude blog, frequently named a best blog for product managers. She also created AmpliTour, the live workshop for beginners to product analytics and 6 Clicks, the Amplitude video series. She produced the Flywheels Playbook, wrote The Product Report 2021 and produced The Product Report 2022. A former developer and journalist, Mallory's written work and coding projects have been published by TIME, Chicago Tribune, and The Texas Tribune. She graduated from Northwestern University.
More from Mallory


