Q3 Product Release Highlights—New Features Help Teams Get More From Their Data
See how new releases in Amplitude help teams make better decisions, run better experiments, and more. Updates include Data Tables, real-time syncs, free event streaming, and more.

Amplitude gives teams actionable, self-service insights into their entire customer journey. We’re obsessed with helping our customers get more from their data.
That’s why the Amplitude product team released 30+ features this quarter that help digital teams run higher-impact experiments, make better decisions with their data, and deliver more targeted user experiences.
We also improved our product experience so teams can work more efficiently at every step.
Here are the highlights.
New in Amplitude Analytics
Analytics is the #1 product analytics solution that enables any team with fast, self-service insights into customer behavior. New releases make it even easier to source these insights and bring them into cross-functional conversations.
Make better decisions with Data Tables
Data Tables let customers perform multi-metric, multi-dimensional analyses in a single view.
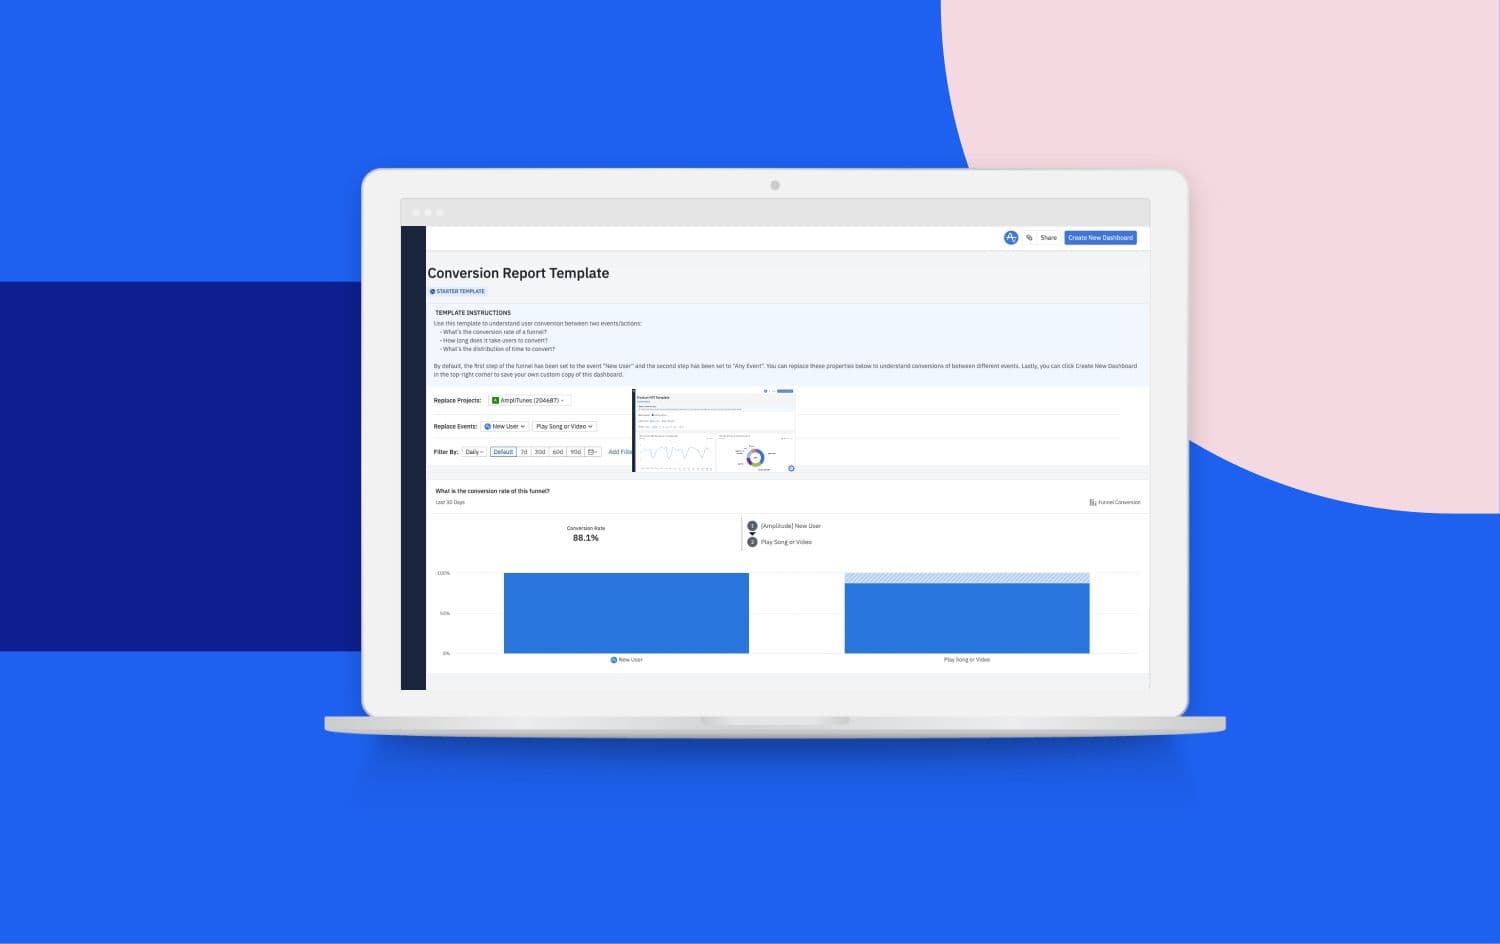
Use Starter Templates to answer important questions–fast
With out-of-the-box Starter Template dashboards that customers can customize and save, answering essential product questions has never been easier.
Learn more about Starter Templates.
Collaborate better with new integrations
EU Data Center availability coming soon.
Integrations with Slack and Miro make it easy for customers to bring key metrics to the collaboration tools they use every day.
Learn more about Slack Dashboard notifications and the Miro integration.
Other releases in Analytics include:
- Timezone customization for charts and dashboards
- Customizable data bucketing options in event frequency charts
- Improved user stream experience
New in Amplitude Audiences
We introduced Audiences as an expanded version of the product formerly known as Recommend. As the new name suggests, Audiences provides powerful audience discovery, segmentation, and activation to help customers better target their users with personalized content and experiences.
Target users more effectively with new cohort enhancements
In Q3, we launched two improvements to cohorts in Audiences: distinct day cohorts and nested cohorts.
- With distinct day cohorts, customers can create audiences defined by the number of distinct days a user has performed a behavior.
- With nested cohorts, customers can define a new audience by referencing and making changes to an existing cohort.
Use real-time syncs to build dynamic campaigns
Available to paid Audiences customers.
With real-time syncs, cohorts are updated and synced every minute to support in-the-moment engagement campaigns.
Learn more about real-time syncs and how to set them up.
New in Amplitude Data
Data provides teams with the foundational infrastructure to manage data across their stack. New releases make Data capabilities more accessible, provide more visibility and control, and more.
Access event streaming with any Amplitude plan
Now all Amplitude customers can stream up to 10M events per month for free. That means customers, globally, on any free or paid plan have the power to create real-time targeted experiences for their users.
Learn more about available and upcoming event streaming destinations.
Connect Amplitude to your data warehouse without added cost
Customers on Amplitude Starter and Scholarship plans can now access all destination connections to data warehouses and storage providers (including Amazon S3, Snowflake, Redshift, and more) at no cost. Send enriched data from Amplitude to your data warehouses to unlock more value from your existing data.
Learn more about setting up your Data Warehouse.
Onboard data sets easily with Guided Configuration
The new Guided Configuration option makes it easier than ever to onboard data sets and manage import configurations to Amplitude. After connecting their Cloud Storage bucket in the Sources section of Amplitude, customers can map or transform data to the Amplitude model specification.
Learn more about Guided Configuration.
Filter tracking plan data right within Amplitude
Customers can now drill down into tracking plan table data in their account without having to download a CSV file.
Plus, with the new Slack integration, Data customers can choose to be notified when someone comments on their tracking plan or makes updates to the plan.
Learn more about Slack integration in Data.
Other releases in Data include:
- The ability for customers to control how long their organization-level data is retained on the Amplitude platform
- Source improvements that help customers surface and fix issues in tracking plans
New in Amplitude Experiment
Amplitude Experiment is a best-in-class product experimentation solution that integrates product analytics and data into every step of the process. We released updates in Q3 that improve customers’ ability to run high-impact experiments and easily verify the results.
All Experiment updates are available to paid customers. EU Data Center availability coming soon.
New Monitor Tab helps keep experiments on track
- With guardrail warnings, customers see a pop-up message when they’re about to change the configuration of an experiment that could impact the validity of their results.
- Customers can easily identify sample ratio mismatch (SRM) in an experiment with warnings for SRM detection.
- With evaluation notifications, customers get an email when their test reaches statistical significance
Learn more about the new Monitor Tab.
Open Experiment charts in Analytics
Every chart in Experiment now shows a button to “Open in Analytics”. When customers open an Experiment chart in Analytics, they can add it to Notebooks, Dashboards, or anywhere else they monitor and communicate with their team.
Save overhead with local evaluation
New local evaluation saves customers the overhead of making added network requests and gives them a boost in performance over running evaluation on a remote server.
Learn more about local evaluation.
Prevent SRM in experiments with Diagnostic Run-Time Charts
Access the underlying data powering your experiment outcomes with Diagnostic Run-Time charts. These charts help detect and prevent Sample Ratio Mismatch (SRM), which can invalidate test results.
Learn more about diagnostic run-time charts.
Other releases in Experiment include:
- Improvements to the Experiment home page, including new details about recent tests and the ability to customize what data is shown
- Improvements to the experiment completion experience, such as adjustments to button copy and the ability to easily roll back a decision made in error
- New duration estimates show how much longer an experiment needs to run to achieve statistical significance
Get monthly product updates in your inbox
Don’t wait until the end of next quarter to learn about what’s new in Amplitude. Subscribe to product updates in the Community and get an email when we post the monthly release roundup.
Not yet an Amplitude customer? Now is a great time to get started for free.

Nate Franklin
Former Director, Product Marketing, Amplitude
Nate Franklin is a former director of product marketing at Amplitude. As a former product manager and self-declared product nerd, he's often asking, "ok, so what is our goal?"
More from Nate


