Q1 Product Release Highlights—Get the Most out of Amplitude
See how new product releases can help your team get the most out of Amplitude. Updates include chart controls, Space permissions, formula metrics, and more.

Amplitude gives your team trusted data and actionable insights they need to unlock the power of your products. We released dozens of updates this quarter that support them in answering important product questions and getting the most out of Amplitude.
Here are the highlights.
Analytics highlights
- Preview our new redesigned chart controls built to help your team uncover product insights faster
- Funnels updates unlock new insights into your conversion drivers
- Team Spaces permissions keep collaboration hassle-free
- Rich-text editing built into Notebooks gives your team more ways to format and share stories
- Our new Grid library lets your team edit dashboards faster
Experiment highlights
Help your team do the work that matters, faster
Amplitude Analytics empowers your team with trusted product data about how your customers engage, when they convert, and why they return.
New features in the digital analytics platform make it easier for anyone on your team to get started and provide a better user experience along the way.
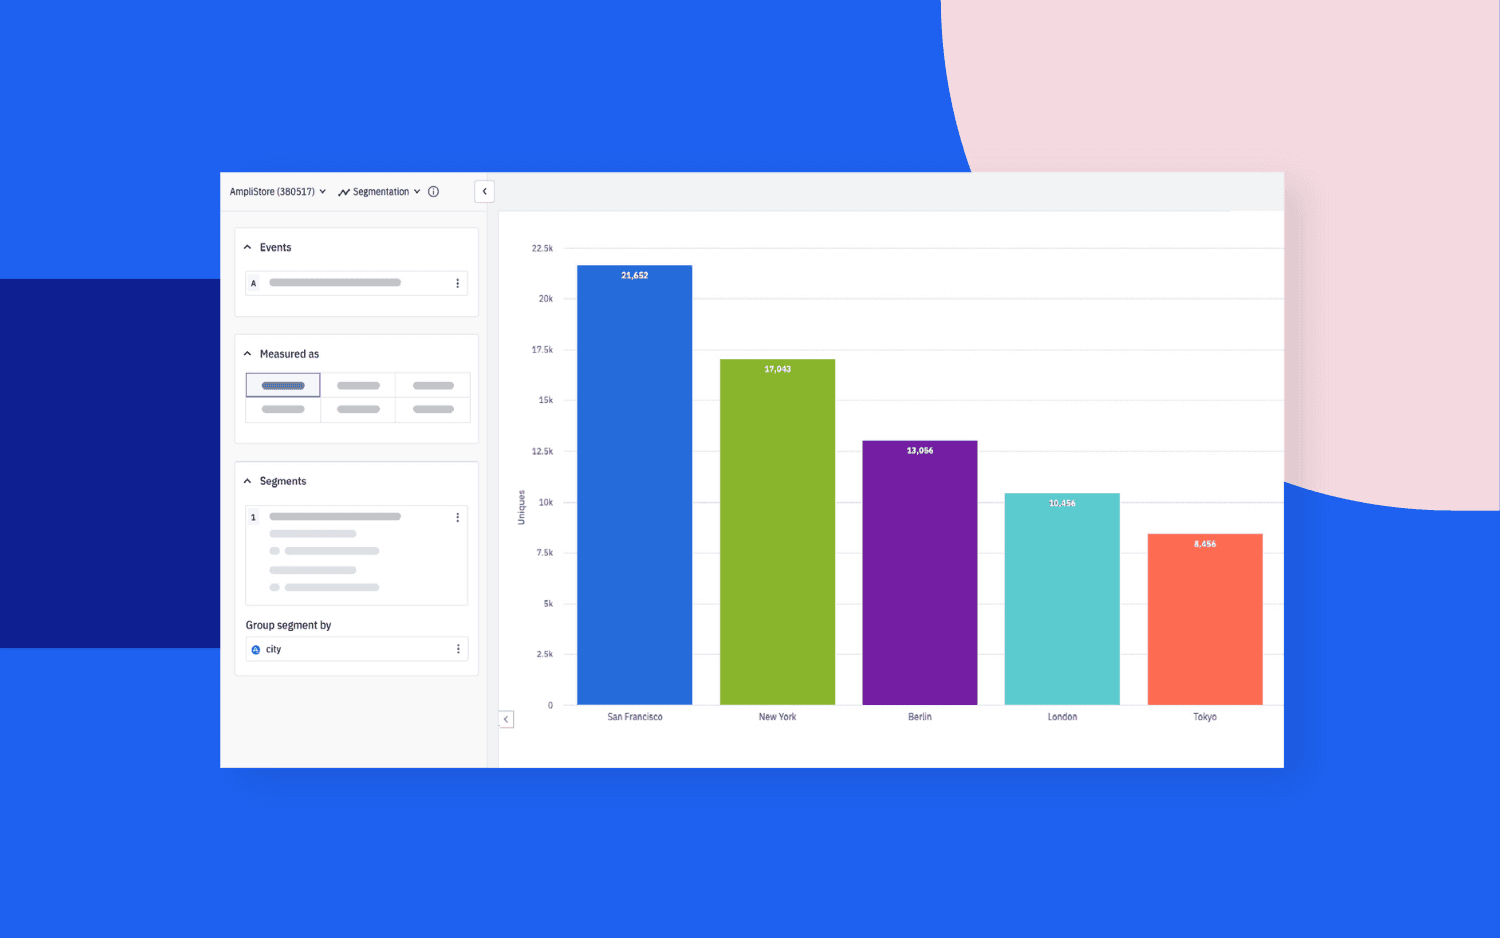
Go from zero to insights faster with our new chart controls
Our most-used experience keeps getting better. We’re redesigning the chart creation flow to make analysis easier for new and experienced users alike. Here’s what’s coming:
- Updated chart control layout: The new view puts controls side-by-side with the chart visual. As your team changes the controls, they’ll see updates to the chart in real time, making it easier for them to learn and explore data. For new users, we’re simplifying the chart creation process with a streamlined top-down structure, surfacing advanced controls only when needed.
- Reusable analysis blocks: Rather than starting analysis from scratch. Your team will have access to standardized analysis objects that anyone in your organization can reuse. With our Object Management Center, your team can designate metrics, custom events, segments, and cohorts as “official” and easily remove clutter so everyone knows they’re safe to use.
- Improved drop-down experience: We’re removing the guesswork from chart creation by making it possible to search not only event titles, but descriptions and categories too. What’s more, we’re adding consistent and valuable new metadata so users can make informed decisions. More to come soon!
The new chart control experience will be available to preview starting in April for the following charts:
- Event Segmentation
- Funnels
- Pathfinder
- Data Tables
- Retention
- User Composition
- Sessions
Note: Starting in April, users can opt into the early beta preview by clicking “Try our New Look” at the top right corner of any chart listed above. We’re continuing to make improvements to the overall experience and welcome your feedback!
Learn more about our new chart controls.
Better understand your conversion drivers with updated funnel charts
We’ve updated our funnel analysis experience to give your team better user conversion insights. New releases make it possible for your team to:
- Compare multiple events at each step of the funnel to understand relative conversion
- Mark a funnel step as optional to better understand conversion impact
- Define custom events for a step in the funnel directly in line without creating a completely new event
- Calculate the total revenue attributed to a conversion
- Apply a conversion window of 90+ days to help businesses with longer funnels get quality insights
We’re continuing to invest in funnel chart improvements. Keep your eyes out for more exciting updates!
Learn more about the Conversions Funnel chart.
Collaborate more confidently with Space edit access
We released Space edit access to make collaboration easy across objects such as charts, dashboards, Notebooks, and cohorts. For organizations that work together in Analytics, this update keeps access issues from causing delays in situations like:
- Increasing object ownership to new teams or individuals
- Providing an existing team with access to multiple objects
- Maintaining edit access to objects owned by former team members
Your team can now determine who views, adds, or edits objects so access issues do not slow you down. They’ll also see new disclosure badges on content when moving charts into a Space.
Enjoy a better working experience with Dashboard and Notebook improvements
By popular request, we also released two updates that make creating and customizing analysis a better experience for your teams:
- Rich text editing: This new toolbar in Notebooks expands your formatting options and offers familiar keyboard shortcuts and markdown inputs.
- Grid library: The updated dashboard grid system includes draggable resizing, clear drop points, and a more intuitive UI to make meaningful edits in fewer clicks.
Scale your experimentation program to drive innovation and ROI
Amplitude Experiment lets you run tests and implement features using the same high-quality data you use for analytics. If you already use this powerful tool, the next step is to scale your experimentation program.
Data-driven organizations can innovate more quickly and confidently by increasing the number of tests they run. More high-quality tests lead to more insights to help your business grow.
New features and capabilities in Experiment expand your team’s ability to test and learn while making sure your data is clean and reliable.
Better manage multiple tests with new Experiment Groups
We’ve released two new Experiment Groups that make it possible to run several tests at once without compromising the results or your customer experience:
- Mutual exclusion groups: Avoid exposing your customers to competing experiments. With mutual exclusion groups, your team can designate specific experiments to never share user traffic.
- Holdout groups: Designate a group of users to never engage with experiments. A global holdout group allows teams running several tests with relatively low traffic to properly analyze their effects against the holdout group to use as a baseline.
Learn more about mutual exclusion groups and holdout groups.
Build flexible experiments with custom Formula Metrics
This update unlocks your team’s ability to innovate more quickly by running experiments on formula-based metrics. They can use standard operations like add, subtract, multiply, and divide to build more complex metrics natively in Experiment.
Learn more about formula metrics.
Follow experimentation best practices with data quality checklist
An experimentation program can’t be effective if test results are untrustworthy. Teams who don’t use best practices for setting up and running tests may make bad decisions that lead to worse business outcomes.
We’ve taken great care to build Experiment on test design best practices. The new data quality checklist takes this a step further by scanning new tests for issues with experiment design, implementation, instrumentation, and statistical integrity. Your team is notified in the platform if there are issues that could degrade their results.
Learn more about the data quality checklist.
Get on the product growth fast track
Help your team use these features to surface trusted, clear, actionable data insights. Share the following resources:
- Charts in Analytics
- Amplitude Spaces
- Conversion Funnel charts
- Event Segmentation charts
- Mutual Exclusion groups
Encourage your team to subscribe to Product Updates in our Community. They’ll get monthly updates that keep them up-to-speed with all the new goodness in Amplitude.

Nikhil Gangaraju
Director, Product Marketing, Amplitude
Nikhil is a product marketer at Amplitude focusing on Amplitude Analytics and works with teams to advance our mission to help companies build better products.
More from Nikhil


