8 Timeless Analytics Resources
Here are eight of these timeless resources to study, bookmark, and look at over and over again.
Analytics is a field that’s moving really fast. New developments are constantly being made, and there’s a ton of places to look for information about how to best track and analyze user behavior. As with any field, though, analytics has its own “best practices,” and it’s a good practice to go back and review these from time to time. These can be found in articles, presentations, and videos that break out of their specific time and place and become touchstones of the field. They dig through the surface and tackle deeper, more vital questions about data and user behavior analytics. Because of that, they matter just as much now as they did when they were first published. Here are eight of these timeless resources to study, bookmark, and look at over and over again. [Tweet “8 timeless #analytics resources to study, bookmark, and look at over and over again.”]
1. Microsoft’s Experimentation Platform Blog
The Microsoft Experimentation Platform was started by Ronny Kohavi, Amazon’s former director of data mining and personalization, back in 2006. Microsoft’s analytics team used the site to publish the results of the experiments they were running on large data-sets. Many of the analytics ideas you hear being brought up as if they were new today originated in papers like “Trustworthy Online Controlled Experiments: Five Puzzling Outcomes Explained,“ and “Practical Guide to Controlled Experiments on the Web: Listen to Your Customers not to the HiPPO,” HiPPO being short for the Highest Paid Person’s Opinion.
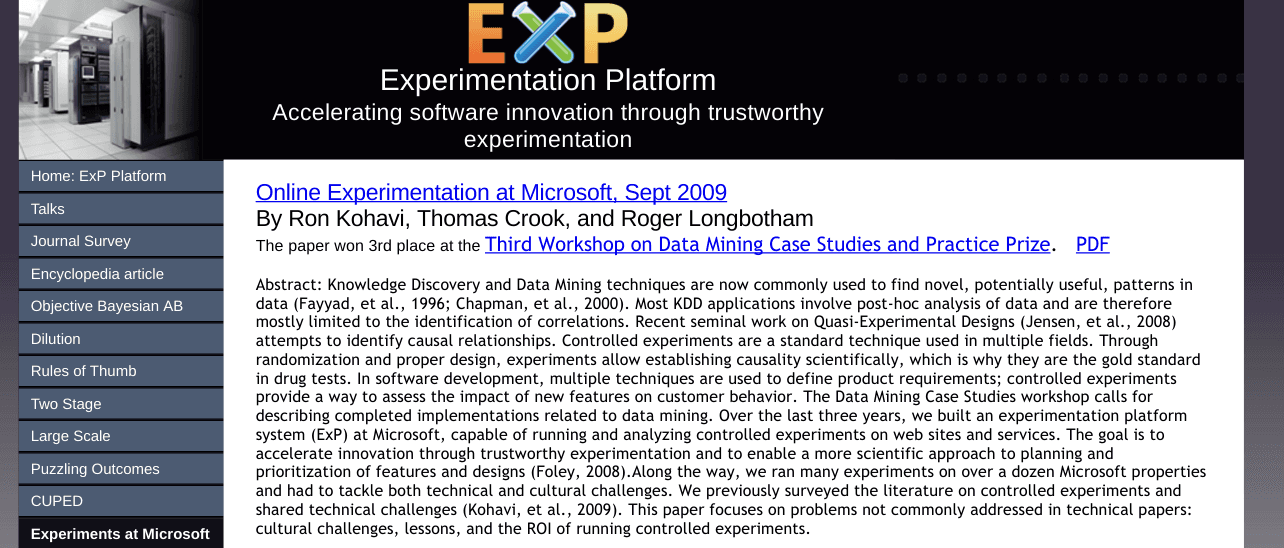
Eric Ries, founder of Lean Startup, called that guide “the best paper he’d read on split testing.” What Kohavi and his team created over the years was the most impressive and comprehensive repository of analytics experiments on the web. Kohavi, who received his Ph.D. in Machine Learning from Stanford in 1995, used the techniques he writes about to turn Amazon and Bing into web giants. He’s been doing this for a long time, and it shows.
2. Andrew Chen’s Blog
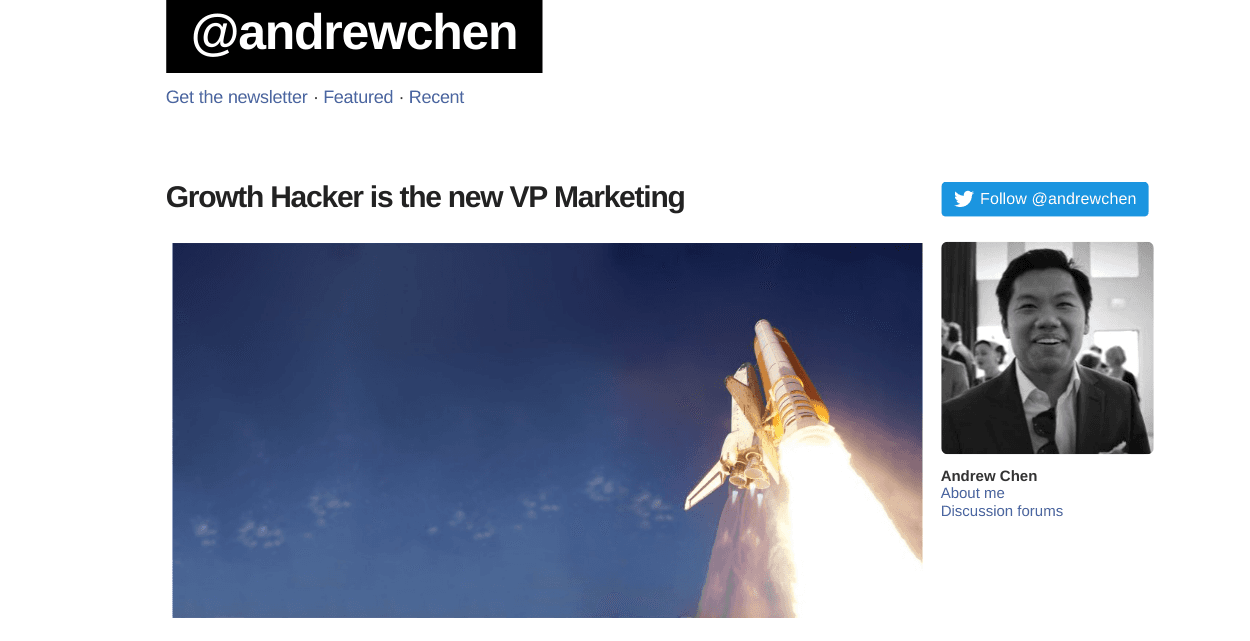
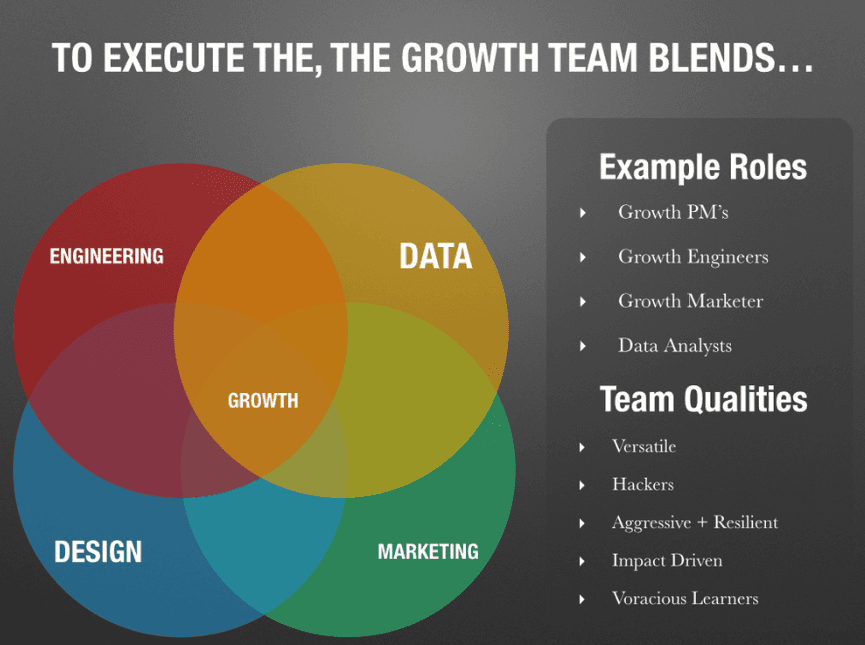
Andrew Chen’s blog has been one of the best sources for information on using analytics to grow and retain an audience for years. Eric Ries called it “one of the best entrepreneurship blogs of all time.” During the decade he’s been writing his blog, he’s been an advisor to companies like Dropbox, ZenPayroll, AngelList and Product Hunt. Most recently, he’s been working on the Growth team at Uber. He’s a serious growth pro and it shows—he was also one of the very first people to understand and see the rise of the “growth hacker” as a serious startup position:
Posts like “5 steps towards building a metrics-driven business” and “omg I’m just a startup, I can’t do those fancy analytics!” contain high-level, strategic teachings with a practical, actionable bent. These posts are pored over and studied by first-time entrepreneurs and seasoned VC-operators alike. The list of featured essays and eBooks is a great place to start getting familiar with his content.
3. “The Only Metric That Matters”
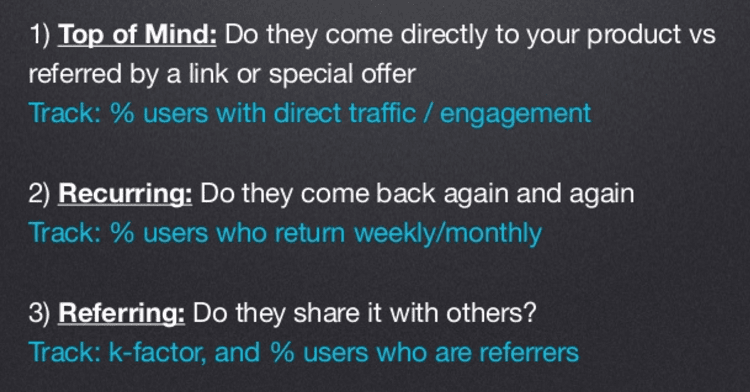
In 2012, Josh Elman wrote a post that has spread across the internet more than just about any blog post about analytics. In “The only metric that matters,” Elman dug into the question of how we decide what to track. His answer, drawn from his experience working at Twitter, Facebook, LinkedIn and other companies, was that we should really be looking for just one metric. It’s an insight that’s lost on all those companies who say things like “We have 10M uniques with 30M page views per month.” That doesn’t really tell you anything.
“How many people are really using your product?” is the question Elman says your metrics should aim to answer. Real usage is about specific behaviors, and you should have your core product value figured out to the point where you can distill that usage into one specific pattern of action. Then, you take the customers who behave the way you want (those that give you the strongest business) and work on creating more customers like them:
(Source: Slideshare) This is the fundamental point that you should keep in mind every time you set out to learn something from your data. Using certain metrics just because they’re the ones you’re familiar with or because they let you draw a good-looking graph is not going to help you out. Digging into patterns of actual usage in your app will because it will get you insights that you can actually use to _change _behaviors _for the better. _
4. Dave McClure’s Startup Metrics For Pirates
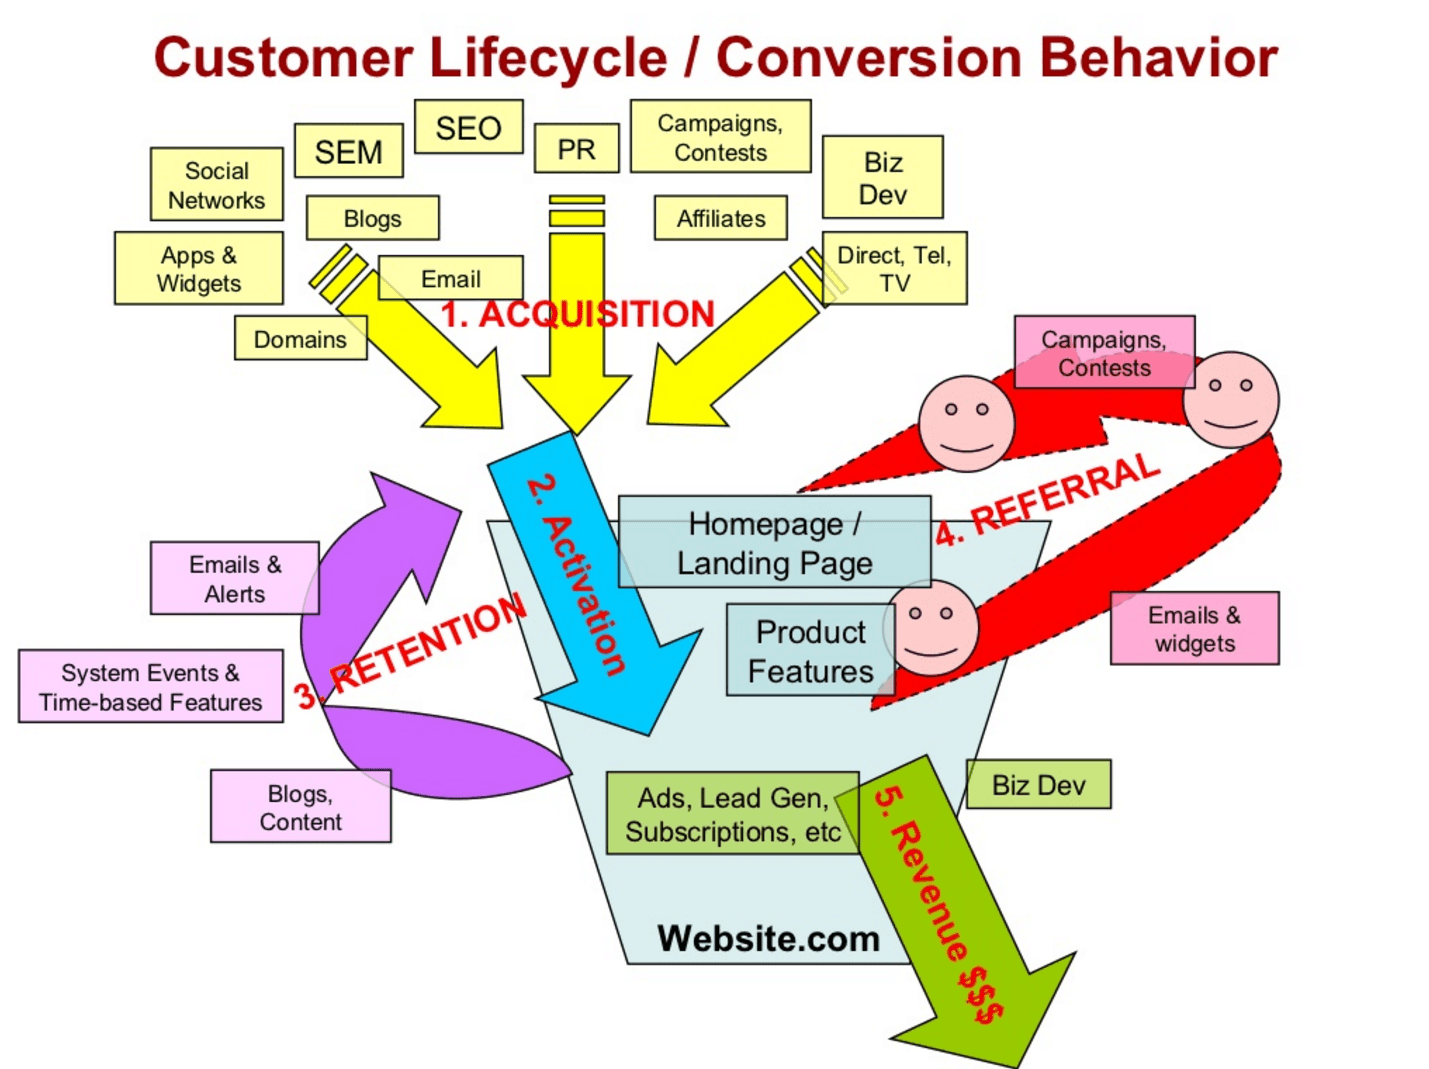
After leaving his marketing job at PayPal, Dave McClure became an angel investor and started furiously advising young startups in the art of customer acquisition. His Startup Metrics for Pirates presentation at the Seattle Ignite conference in 2007 was designed to cure startups of their misconceptions about distribution and growth, and today it’s the stuff of legend. Much of it is also just as relevant now. McClure pioneered a simple yet powerful approach to segmenting your analytics, and most startups would be served by copying from his book a bit more. The crucial insight from McClure’s model is that every piece of data you collect needs to be actionable. You won’t get much out of “pirate metrics,” or any kind of metrics for that matter, if the data you’re collecting only tells you _if _you’re doing well or not. You need the _why, _because that’s the only way you’re ever going to be able to use that data to get better.
5. Chamath Palihapitiya’s Startup School Growth Talk
Before Chamath Palihapitiya was a leading venture capitalist and part-owner of the Golden State Warriors, he worked at Facebook. As the lead of the first Growth team, Palihapitiya put Facebook on the road to a billion users through a rigorous, data-driven process of testing and experimentation. His 2013 talk for Sam Altman’s Startup School, annotated here, was about how he did it. Along the way, he blows up many of the destructive and counter-productive practices so prevalent in Silicon Valley. He takes special aim at the “optimizers,” people who focus with insane rigor on optimizing low-level metrics, like page views and downloads, that don’t do anything to create sustainable user value and aren’t actionable. The essential growth metric Facebook used was getting new users to seven friends in ten days. They chose this metric because:
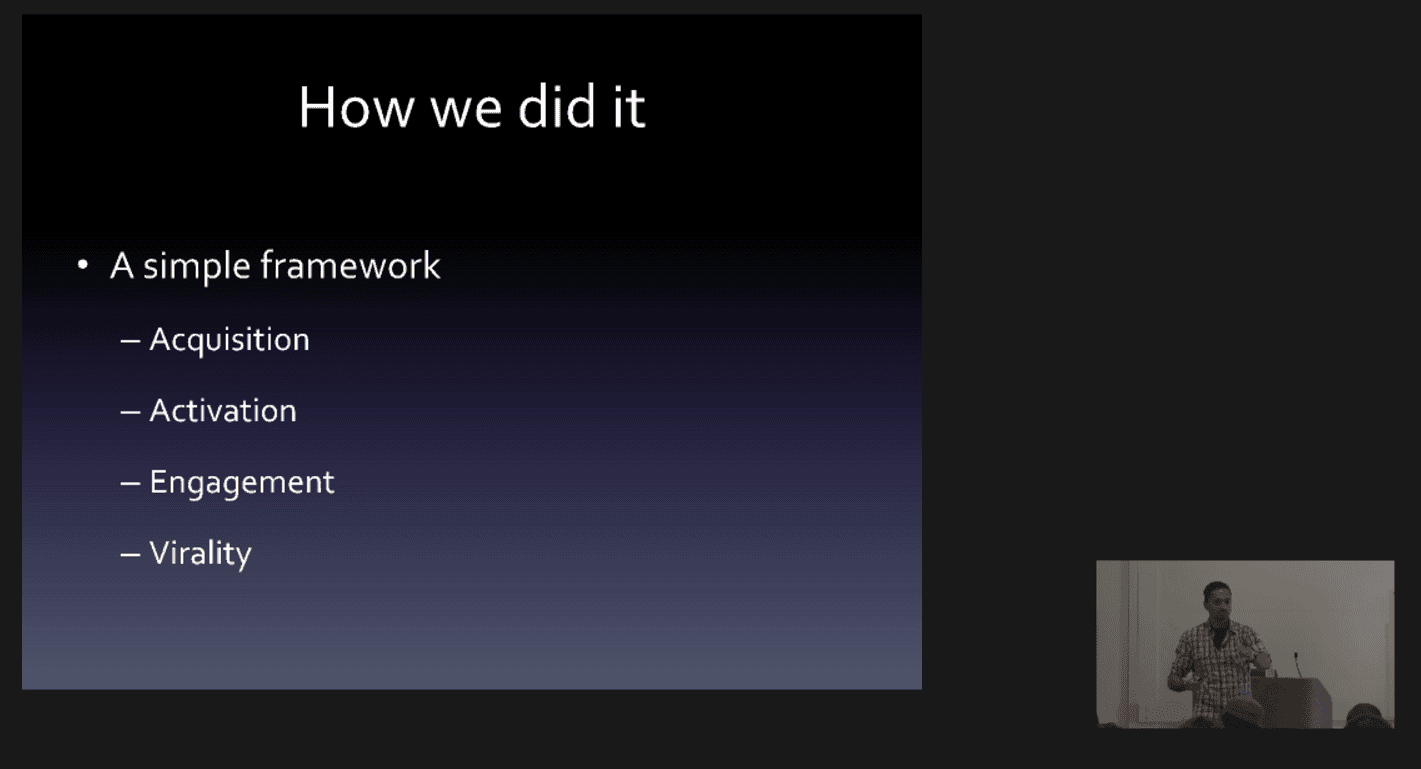
- They’d run the numbers and seen that users who did that stuck around much longer with Facebook and were therefore getting more value out of the product.
- They could directly affect how quickly and how often users got from zero to seven friends in ten days—it was an actionable insight_._
Once they knew that getting users to seven friends in ten days created sustainable growth, doing more of that became the guiding principle of product development at Facebook. The rest is history. The crux of Chamath and Facebook’s story is really that analytics need to work hand-in-hand with an elegant understanding of how your users behave and what they really want from your product. Without that, you can’t possibly know whether or not your actions are actually going to help your business in the long-term. Chamath’s presentation is an invaluable guide for instituting this kind of thinking at your company because it cuts through so much of the fluff around startup data that can be tempting and easy to believe.
6. Netflix’s Culture Slides
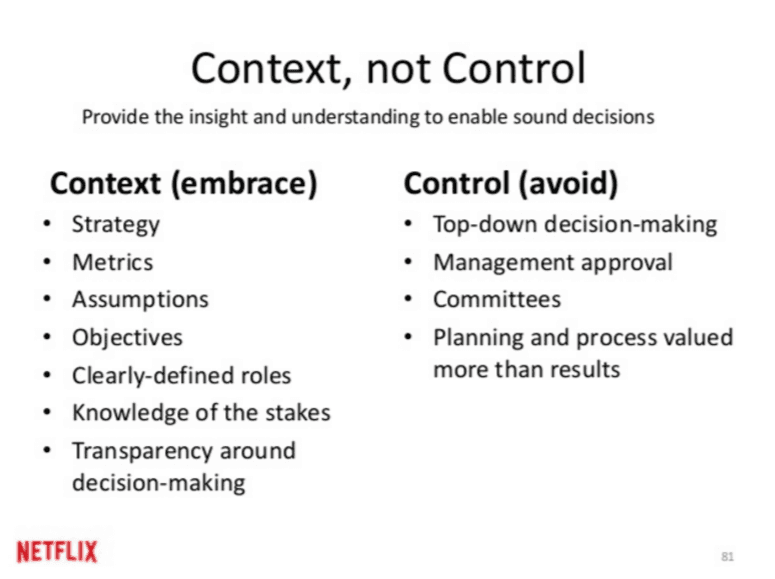
In a series of 124 slides that have become legendary in the tech world, Netflix sought to explain the way their unique culture worked. It’s mostly referenced when talking about building a culture of excellence and discipline at startups, but Netflix being a highly data-driven organization, it also serves as a blueprint for building a data-driven culture. The above slide contains one of the fundamental pieces of the Netflix culture: “Context, not Control.” Knowing how deeply Netflix believes in flexibility and information transparency makes it easier to understand how they’ve become such a juggernaut of data-driven innovation. Making data accessible rather than compartmentalizing it in a “data science” department can make a huge difference on how quickly your business is able to improve. It’s not just because you remove red tape from decision-making, but because you quickly instill a culture of looking into data for answers that disseminates all through the organization. That’s just one slide—there’s 123 more, and collectively they are the best introduction to culture-building that any startup could hope to read.
7. Annielytics
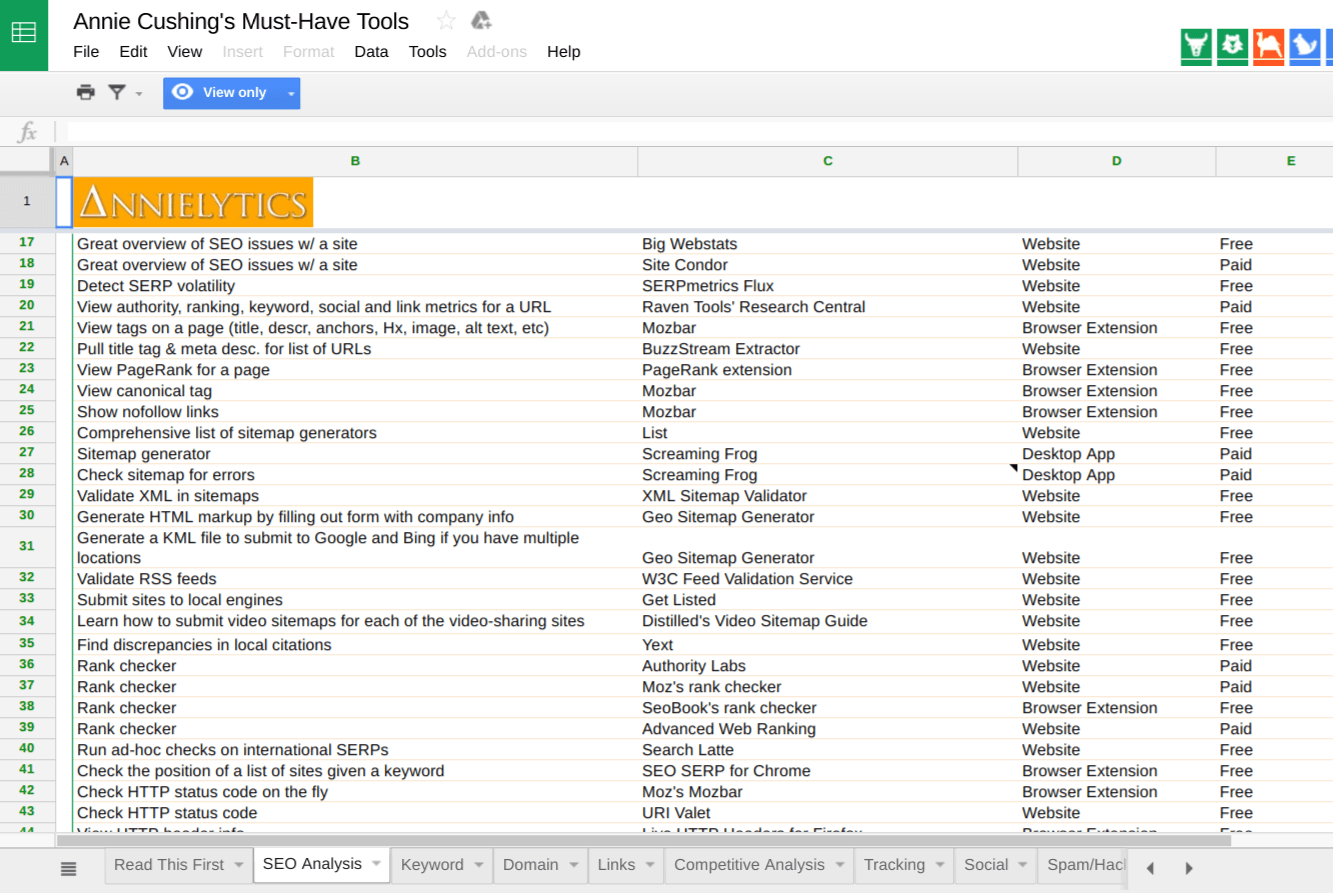
Annie Cushing’s blog Annielytics is one of those hidden gems of the analytics world. Rand Fishkin from Moz recorded this appreciative video testimonial purely of his own volition and because the team at Moz had gotten so much use out of her work. She’s given talks alongside members of the Google Analytics team, who have tweeted in support of her work. The real meat of the Annielytics blog is the tools that she’s put together for marketers looking to get more out of their data. Her DIY Site Audit Template is a whopping 156 pages with 167 different checkpoints and more than a hundred images. Some of her tools cost money, but many are free, and their use cases span a very wide range.
8. Brian Balfour’s Coelevate
The legendary growth marketer Brian Balfour’s blog Coelevate is an incredible resource for learning about what makes startups grow. The former VP of Growth at HubSpot, Brian is a 4-time co-founder and advisor to many other startups. He specializes in helping companies that have achieved product-market fit but haven’t really started growing fast, and he does so in a scientific, systematic way. Everything is quantifiable for Brian Balfour. Most of his posts are about building a data-driven growth team inside your own organization. They’re pointed, practical, and driven by process: Whether you need growth metrics to track, structure for your experiments, or higher-level frameworks, it’s a good bet that you can begin and end your search on Balfour’s blog.
**This is by no means a comprehensive list. **
We’d love to know what analytics resources you find yourself going back to again and again. Leave a comment here or share this article, and tell us what videos and blog posts and whitepapers you think are _essential _to understanding the nuances of user behavior, growth, and data tracking!

Archana Madhavan
Senior Learning Experience Designer, Amplitude
Archana is a Senior Learning Experience Designer on the Customer Education team at Amplitude. She develops educational content and courses to help Amplitude users better analyze their customer data to build better products.
More from Archana
