Make Your Pirate Metrics Actionable
Applying actionable metrics to the Pirate model ties into that fundamental bond between you and your customer.
When Dave McClure first introduced the idea of Pirate Metrics, it shook the startup world to its core.
Though you now probably know him as the brain behind 500 Startups, McClure got his start investing after doing a three-year stint as Director of Marketing at PayPal—pre-IPO. Their legendary $1.5 billion sale to eBay in 2002, just a year after the dot com bust, inspired a whole new generation of founders to get in the game. So when McClure proposed in 2007 that companies radically change the way they looked at their metrics, those same founders listened.
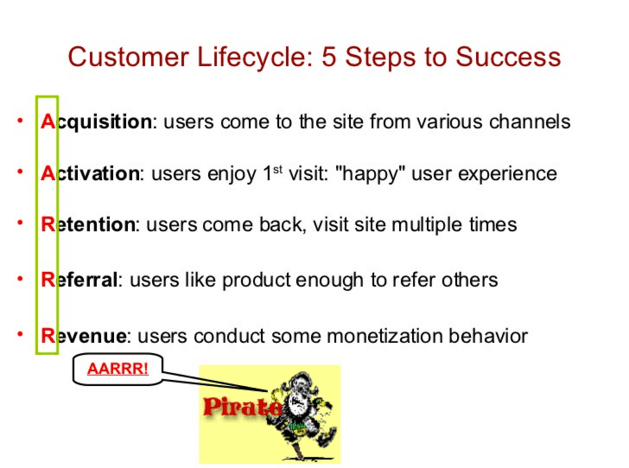
McClure got people past vanity—how many people are looking at my page?—and into thinking about the whole customer lifecycle, the most efficient way to break it down, and how each part could be improved. It was a sea of change in the way founders thought about their businesses.
Now eight years have passed. Pirate Metrics is the standard, go-to model for new founders who want to understand how their business is doing. And the same mistakes are being made again.
Investors say they want exponential, continual growth. Founders want to show them that in their slide decks. They fixate on an image—an image of success, of growth, of long-term returns—when they should be looking at metrics that tell them something useful.
McClure’s point was that metrics are more than reflections: when used correctly, they can help turn an under-performing app into something great, simply by focusing on the customer experience at five key points. For each step in his model, there are commonly-used vanity metrics that will mask urgent issues in your app, provide pointless data, and generally lead you astray. There are also actionable metrics: these will show you what’s going wrong, help you understand why, and point out what you need to do to improve.
Actionable metrics require surgical precision when it comes to measuring phenomena. Vanity metrics are easy to use, and they’re for the lazy. The kind you choose to use will decide whether you’re going to be a pirate or just a landlubber. Let’s figure out what’s what.
1. Acquisition—Compare Your Results From Across Channels
Let’s say you’ve launched your app and you’re ready to do some promotion for it. You pay for campaigns on a couple different social networks. You reach out to the press with well-written pitches and you read articles about how to improve your chances of getting featured in the App Store. Why are you doing all this? Downloads, of course—the more people that download your app, the better off it’ll be!
The problem is that downloads is one of the most unreliable vanity metrics out there. Downloading an app is a super low friction, no commitment transaction. As even the Kardashians discovered, hype is not enough to sustain the success of something as easy to delete as an iPhone app.
When you look at your acquisition metrics, you need to be looking at which ones provide you with the best return on your investment. If you just look at your downloads, you might refer to a graph like this to explain the success of an expensive early-summer promotional push:
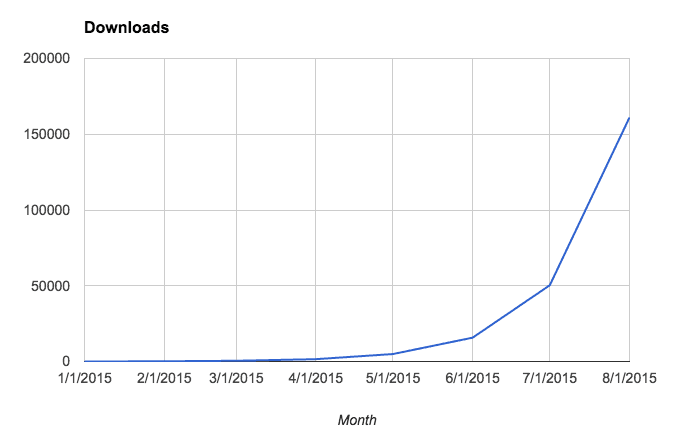
You won’t, however, have any context in which to understand how you’re actually doing or whether you’re in serious danger of running out of money. Nor do you have any clue whether those people who download your app are actually trying it out.
Some founders gesture towards the concept of actionable metrics by comparing their download counts across different marketing channels. But this is not helpful either. Even if you find that one channel gets you 2x the downloads of another, you have no way of knowing that those extra people are actually using your app.
To improve your acquisition efforts, you need to combine this cross-channel approach with a focus on users who actually try your app out.
The Actionable Metric: Conversion Rate from Download to Sign-up
If you track users from the moment they see your app to the moment they sign up, then separate those results out by marketing channel, you will know precisely how well you’re marketing. Anyone can download an app, but it takes someone who’s legitimately interested in it to sign in, and those are the people you want to keep tabs on.
To do so, set up a 2-step funnel from the first screen of your app to sign-in and compare your conversion percentages:
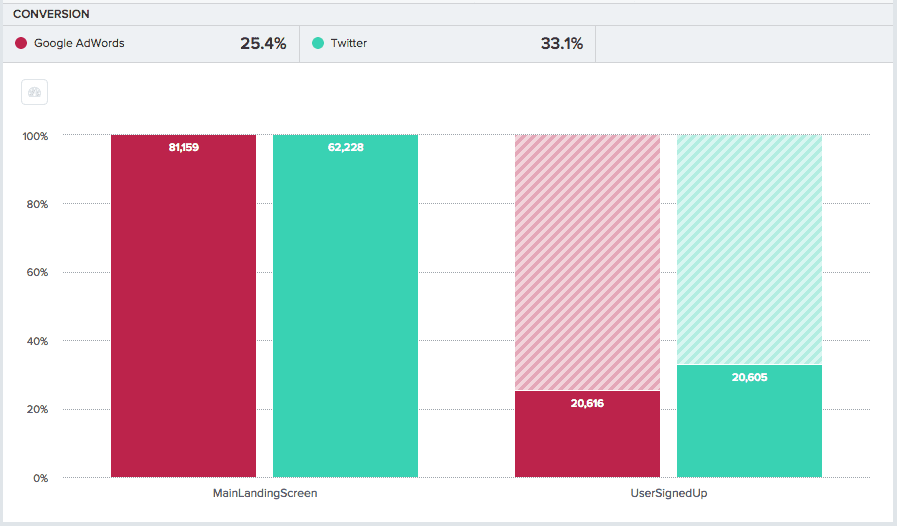
You can see that you have a problem. 67% of your Twitter-referred users and 75% of your Google-referred users are not signing up after downloading your app. But there’s both good news and bad news here.
If you were just tracking downloads or app opens, you would see that over 80,000 people got to your main landing page from just a month’s advertising on AdWords. That’s a big, impressive number, but it’s actually misleading. This is the bad news: the vast majority of those users aren’t even giving your app a try. The money you spent was 75% wasted.
The good news: you had significantly better results advertising on Twitter: you converted more downloads into signed up users than you did with Google even though Google brought you almost 20,000 more potential users.
Now you have work to do:
- Iterate rapidly and often on your landing page to improve your overall conversion rate. There are no formulas for success. As McClure says, “Do LOTS of landing page tests & A/B tests — make lots of dumb guesses and iterate QUICK.”
- Check your conversion rates constantly. Get them up. Take a break once you start to see diminishing returns.
- Re-double your marketing efforts on the channel where you’re seeing the best performance: the largest volume of conversions for the lowest cost.
This doesn’t mean you should cut your AdWords spending entirely and focus entirely on Twitter. There are diminishing returns on advertising too, and you might not get the same results spending $20,000 a month as you did $5,000. But if you make small changes and keep an eye on your conversion percentages, you can nudge your app in the right direction without risking too much.
That means bringing as many people as you possibly can into your actual app. That’s what all of your efforts in the acquisition stage are about—yes, logins and signups are not actually going to help you make your app better, but they’re still an important marketing metric. Used correctly, they set you up to lead the largest possible number of users into activation.
2. Activation—Fix Your Funnel For A Quicker Aha! Moment
When it comes to boasting about vanity activation metrics, McDonald’s is king. The slumping company has been boasting for years of their “billions served,” but exactly what or whom they’ve been counting has always been ambiguous—burger patties? People? And how does that metric correlate with long-term McDonald’s customer activation?

Metrics like “songs played,” “messages sent,” and “billions served” are cumulative values: they may convince people of your app’s popularity, but they’re useless for understanding actual usage patterns.
The reason is outliers. Power users who are on your app way more than the average person will drive your cumulative measurements up sky-high. “Billions served,” yes, but what about all the people who want burgers made with fewer, fresher ingredients? That’s the kind of problem—and opportunity—that you don’t get anywhere near when you boast of huge vanity measurements like this. That’s why you need to stop looking at your data in a cumulative way and start looking into the customer experience on a granular, individual basis. You need to understand:
- How many users aren’t being activated properly
- Where specifically those users are getting lost
- What steps you need to take to fix it
The Actionable Metric: Conversion Funnels and Split Testing
The journey from sign up to activation is a perilous one. Lose a user there, and they’re probably not coming back. That’s why the best way to fix your activation woes is to create a funnel that encompasses each step in that journey, track conversion rates between each step, and dive in where you see users dropping out. Say you’ve built a community-based app that revolves around user comments. Once people start contributing to the discussion, they tend to stick around, but some of them clearly never get to that point, and they churn. To understand why they’re not getting activated and how to fix it, create a funnel. Narrow your conversion window down to a single day: when it comes to mobile apps, you need to get users to those Aha! moments as fast as possible, and that means thinking in terms of days, not weeks or months. Here, you will track how people are progressing along to posting comments, from the moment they sign up to the moment they join a community:
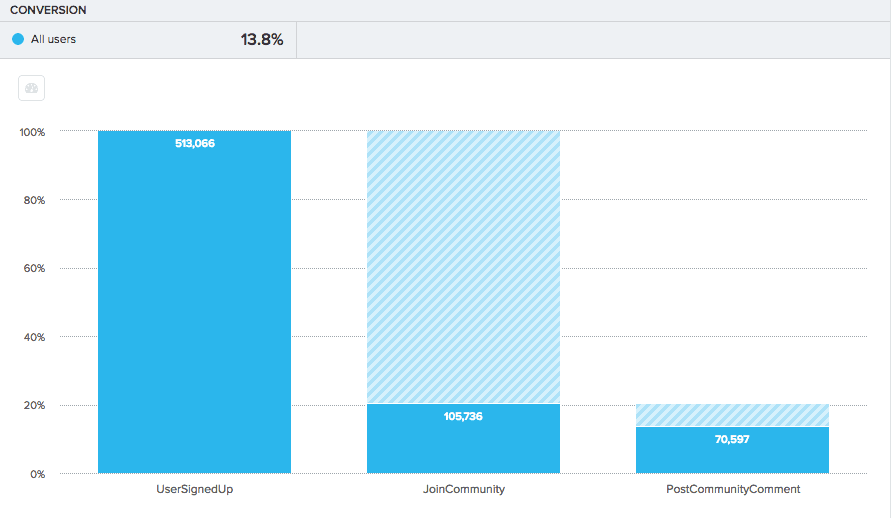
Two facts are clear immediately:
- 80% of your users do not join communities at all.
- 93% of the users that do join communities go on to post a comment—they’re activated.
Once users join communities, you’re good. Almost all of them post at least one comment and are retained long-term in great numbers.
The problem is that a ton of users are just not joining communities at all. This is one of those phenomena that’s hard to see until you look specifically at this kind of data, and it sucks—while you were looking at all those happily-retained commenters, you didn’t see the 80% of people who never made it to that point at all.
The bright side is that this failure presents a gigantic opportunity for you. The fact that there is an 80% drop off between signing up and joining a community means that you have a ton of room to improve that number. And since you know that joining a community is related to user retention and happiness, what you really have is basically a clear, data-driven pathway to turning your product into something really great—and that’s way more valuable than a vanity metric that might just make you feel good.
To fix this, build new versions of your onboarding flow and split test them to see how they work. Don’t be afraid of making things more complicated if it helps new users get to the core value of your product faster. Twitter did this; they found that urging users to complete their profiles and follow accounts gave context to the service and introduced people to its value faster.
Friction isn’t always bad. If it gets your users engaged, then it’s productive. Embrace it, but use your metrics to make smart decisions as to where to introduce it. Split test your different possibilities, take the winning formula, and split test that even more until you have a rock-solid onboarding flow that gets users to their Aha! moments at lightning speed.
Pretty soon, your usage will start going up, you’ll start getting excited, and everything will be amazing up until the moment you remember the c-word: churn.
3. Retention—Use Behavioral Cohorts To Identify Retaining Features
Churn is public enemy #1 in the world of mobile apps. Without strong activation and retention, churn will cut your user base down to size and could, in the long haul, cause it to totally implode. The most popular way to measure retention is DAU or MAU—daily active users or monthly active users. Measuring how many users are active on your app everyday sounds like it should work. But there are a few problems:
- It’s too easy to game or inflate these numbers even if your intentions are good. Defining “active” is difficult and businesses generally choose the definition that gets them the biggest DAU.
- If you’re growing, the amount of new user registrations you’re getting will distort your numbers and prevent you from seeing how many of those users are actually coming back.
- Even if the previous two don’t apply, most simple definitions of “active user” won’t get you to a point where you can identify ways to work with and improve your retention.
Let’s say you run a new social music app. You get Kimoji-esque hype through a connection at TechCrunch and your DAU suddenly explodes:
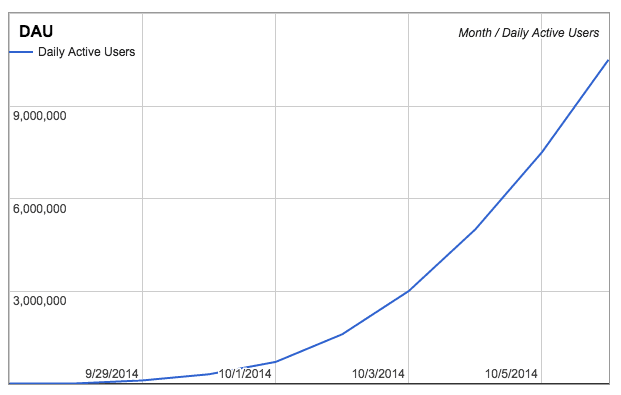
Awesome, right? But then check out what could happen when you incorporate the number of actual _song plays people did in your app:
While your skyrocketing download count seems like proof that you’ve succeeded, your sign ups tell a different story. While your download rates are still increasing, your number of signups is actually decreasing. On the one hand you have success—people are downloading your app—and on the other hand you have explicit evidence that something is going very wrong. Without intervention, you’ll end up here:
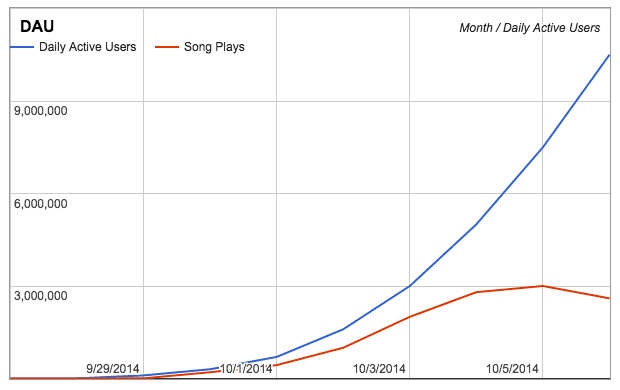
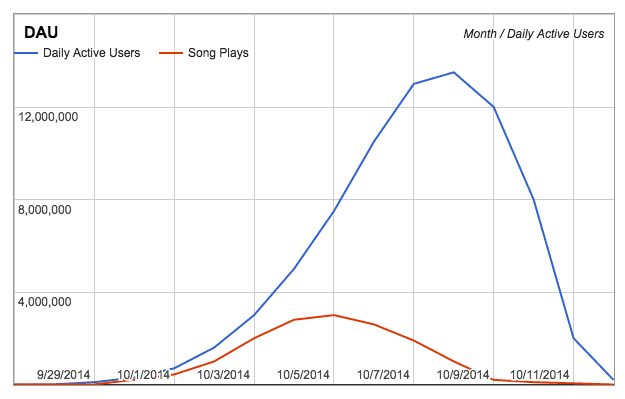
A rising DAU makes founders happy, a falling DAU makes founders sad, but neither one has much to do with what’s actually working with your app and what’s not. It’s your actual activity that you need to look at. Like a coal mine canary, it has the potential to save your app from disaster—if you pay attention.
The Actionable Metric: Behavioral Cohort Analysis
To really start building retention into your app, you need to analyze user behavior. There are some users who get hooked and open your app every hour on the hour, while other people download it, never see the value, and trash it. To get more of the former group and less of the latter, you have to learn from your power users.
The question—what gets users hooked?—can’t be answered with a gut feeling or a preconceived notion. Zynga, Facebook and LinkedIn did not make their apps sticky with gut feelings; they made their apps sticky with rigorous analysis and experimentation.
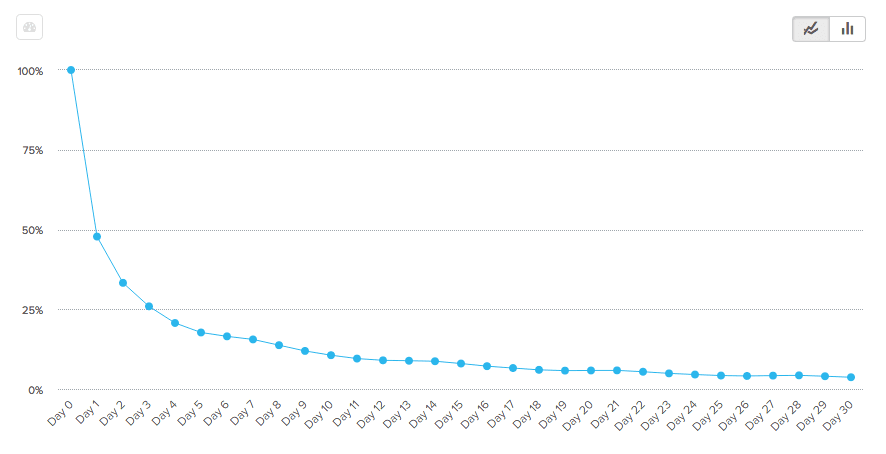
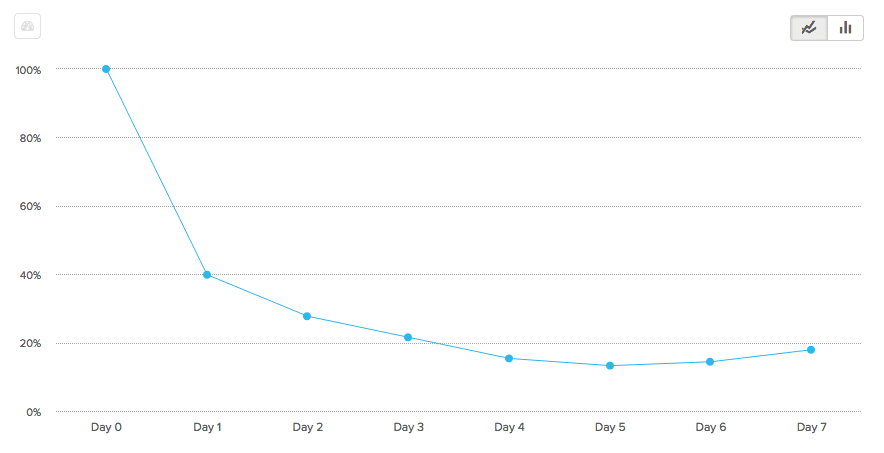
Here’s what your starting retention graph may look like—it takes all the users who signed up on Day 0 and measures how many of them came back on each successive day for a month:
Here’s your Day 7 retention (over a week):
And finally Day 1 retention—how many users came back a day after first using your app:
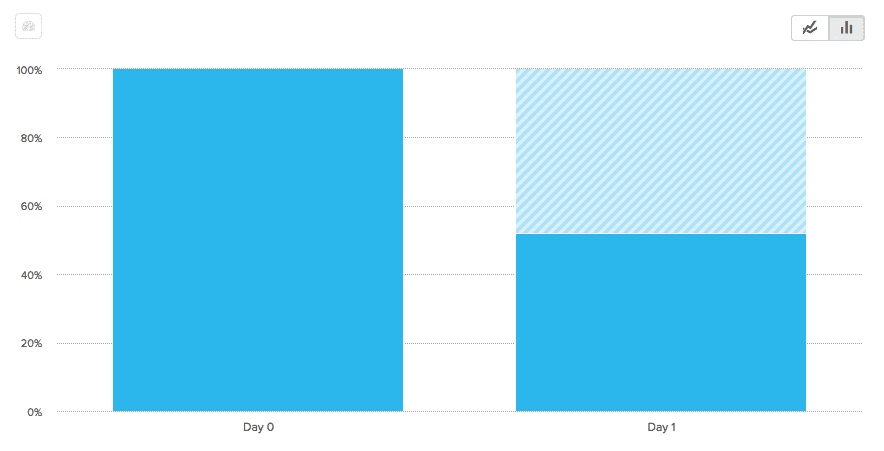
You’ll notice that it is the Day 1 retention graph that gives the most striking representation of the problem. Just about half of users use your app once and don’t come back. Before you start worrying about 30 or 90 day retention numbers, re-engagement, and smile graphs, you need to figure out how to get people back for Day 1.
There’s no formula. You just have to experiment with different possibilities for behavioral cohorts. In this case, you see happens when you compare overall new users to users who joined a community during their first day using the app:
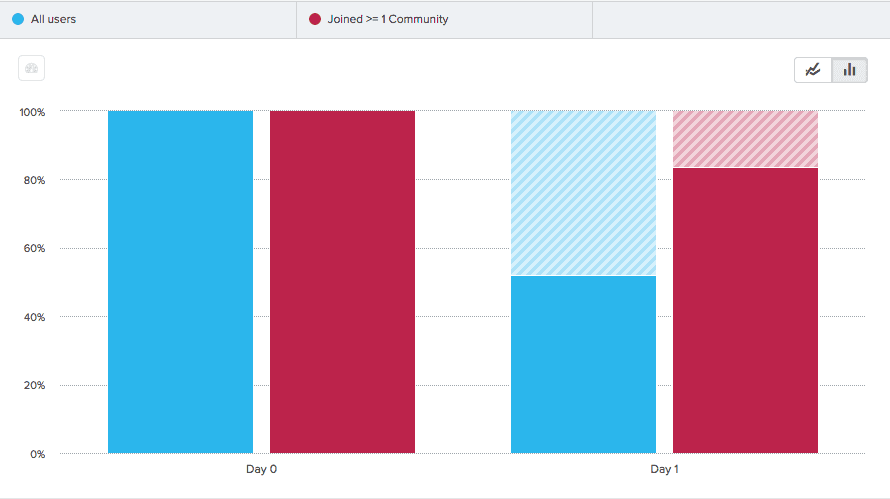
That’s a 30% jump in your Day 1 retention numbers—huge. You might be thinking well, that’s nice, but what if all those users are just dropping off on Day 2 now, or Day 3?
The thing about mobile apps is that consumers churn through them fast. So fast, in fact, that 70% of the average mobile app’s users are lost after just one day. The top 10 apps lose only about 30% in the same span. About three days after installation, though, the retention rates even out: mobile app metrics show that all apps will lose their users at about the same rate. What makes the difference, then, is how well you retain users immediately after installation. If you can hook them fast, you’ll keep them for a while. Here are the 7-day results for your app when users who joined communities are factored in:
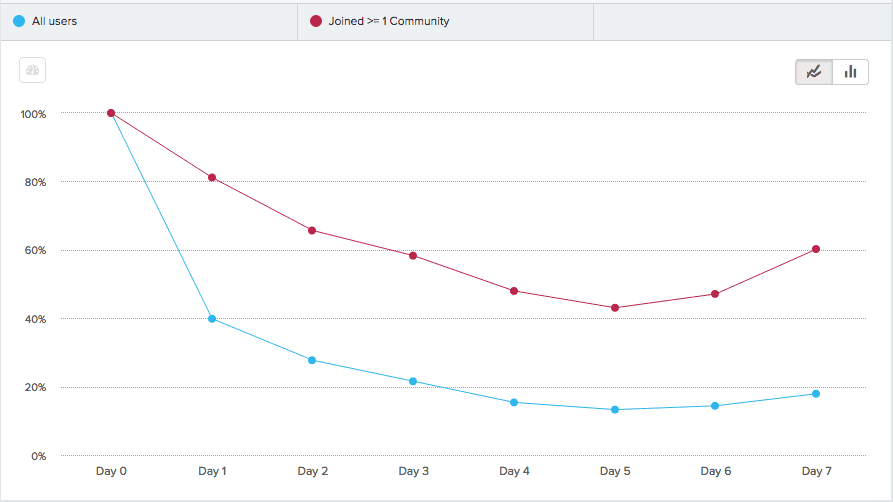
That’s 60% retention (users who joined communities) on Day 7 as opposed to 17% (all users), which is a great improvement. You can see that from Day 1 to Day 5, both groups lose users at about the same rate. What really matters is how many you can retain in the transition to Day 1 itself. Then, finally, look at your 30-day trends to get a wider perspective:
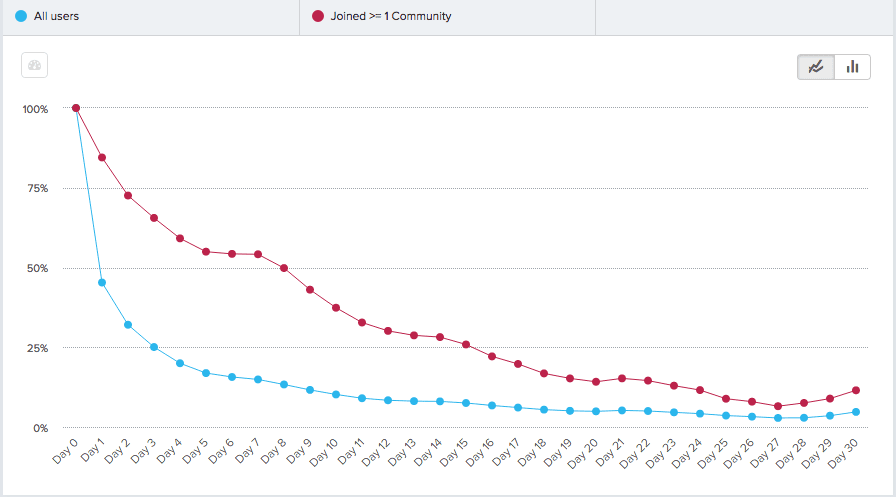
On Day 30, that’s 11.5% retention for those who joined communities and 4.7% for those who didn’t. That may not look significant, but even a small bump in your retention percentage can have an outsized effect on revenue if you, for instance, sell subscriptions.
More importantly, you’ve identified one factor in retention and you can now start to find more. One way you could do it would be by setting “join community” as your new start action, which means tracking users not from when they sign up but from when they join a community. This is what you’d be shooting for if you were redesigning your onboarding flow to bring more community aspects to your users early on.
Then, you can see how other factors might boost retention more: for instance, by comparing users who added songs to three or more playlists with overall users, each being measured from the point where they joined a community.
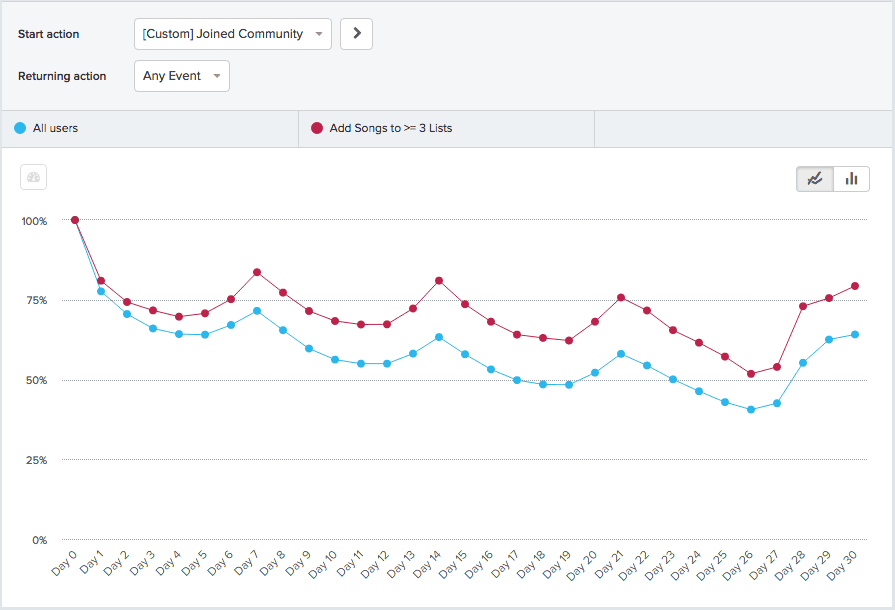
Now that’s top 10 app status.
After you use behavioral cohorts to figure out the kinds of behaviors that keep people coming back to your app, it’s up to you (or your product team) to devise a way to get those behaviors upfront in the user experience. Blow a user’s mind early on, and they’ll have a hard time letting go.
4. Referral—Optimize Your K-Factor Results
K-factor is the dominant metric when it comes to analyzing the success of a referral program. Your k, or viral coefficient, is equal to the average number of referral invites sent out per customer i multiplied by the conversion rate c.
What most people talk about achieving is a k>1, or true viral growth, where each new customer you get refers multiple others who also sign up. It’s the closest you can get to rocket fuel without working at SpaceX:
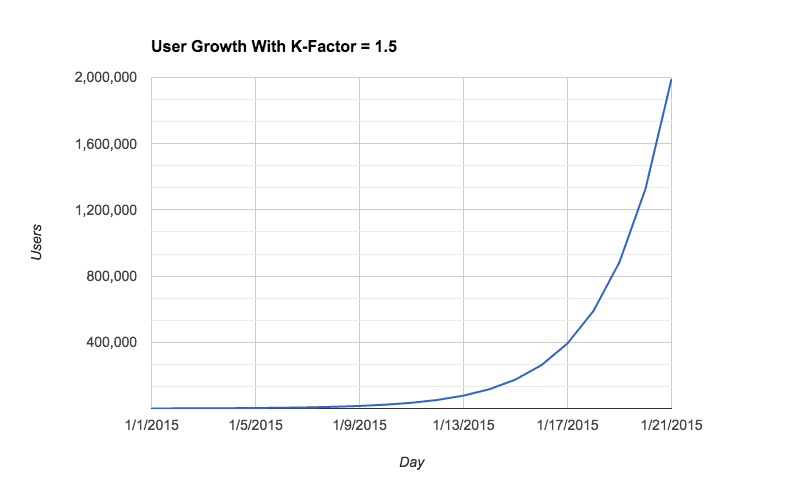
That’s exponential growth—the stuff unicorns are made of—and it’s incredibly rare. So rare, in fact, that according to Rapportive founder Rahul Vohra, very few companies hit k>1 ever, even temporarily—not even Dropbox.
What about k=1 or k<1? Vohra says that there may be more to get excited about there than you think. Because of what he calls the “amplification factor,” even minor improvements to a k<1 have outsized effects on your growth and your bottom line. A k=0.25 may not sound very cool, but in real life, it’s very powerful, constantly amplifying the acquisition that you’re getting from all your different channels.
Then there’s the fact that referred customers appear to just be better, with higher likelihoods of retention, further referral, and increased lifetime value. So if you have a k<1, don’t neglect your referral program just because your app isn’t seeing true viral growth. Tend it right, remove points of friction, and you’ll drive sustainable growth continuously.
The Actionable Metric: The Referral Funnel
Against conventional wisdom, here’s the breakdown according to Vohra: k of 0.15 to 0.25 is good, 0.4 is great, and 0.7 is outstanding. Improving your k by even 0.10 can net you hundreds of thousands of users over the course of a year. To do that, you need to look at every step of your referral funnel and see what you could do to improve either your c or i: conversion rate or invites sent out per customer.
First, check out what kind of traffic you’re getting to your referral page and how much of it is actually participating in the program. Here, you’re looking at three steps and seeing how often they’re all completed within a 30-day window: 1) user signup, 2) their arrival on the main referral landing page, and 3) their sending out of a referral link.
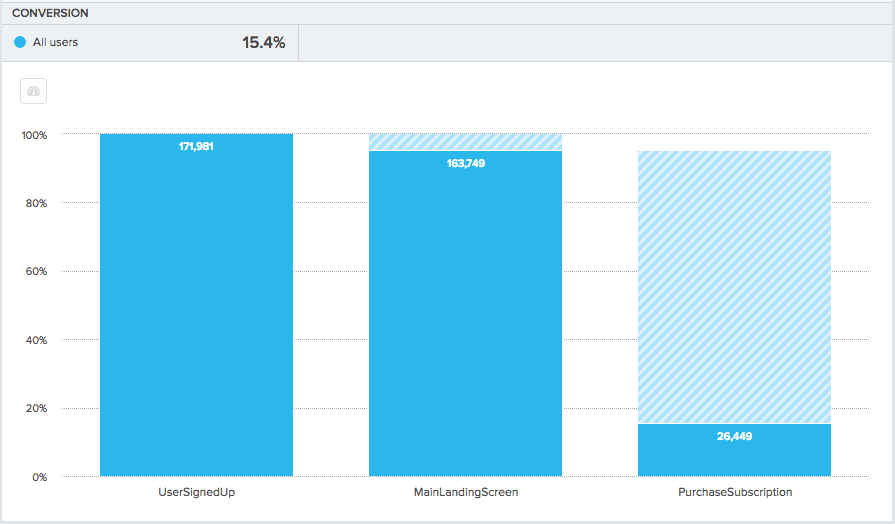
95% of users are seeing your referral page within the month they sign up, which is good. Only 15%, however, are going through with sending even one invite. This is not a bad amount—average, really—but it does indicate room to improve.
One powerful way to boost your referral numbers involves behavioral cohorting. You’ve seen how cohorts can be used to understand acquisition or retention, but by looking at what users do the most referring, you can also have a powerful level for improving your referral program. First, you’ll want to set up a generic cohort alongside a cohort representing those users who refer, say, three or more users.
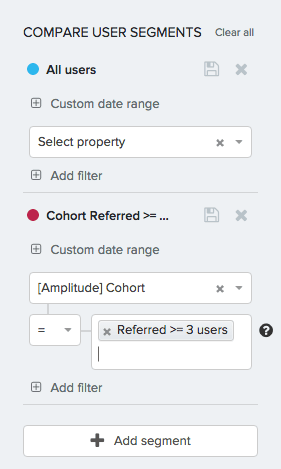
Then, you can do some experimenting and determine activities which your high-referrers are particularly fond of. It makes sense that your high-referrers would be particularly active on the community, so check out how often they come back to post comments:
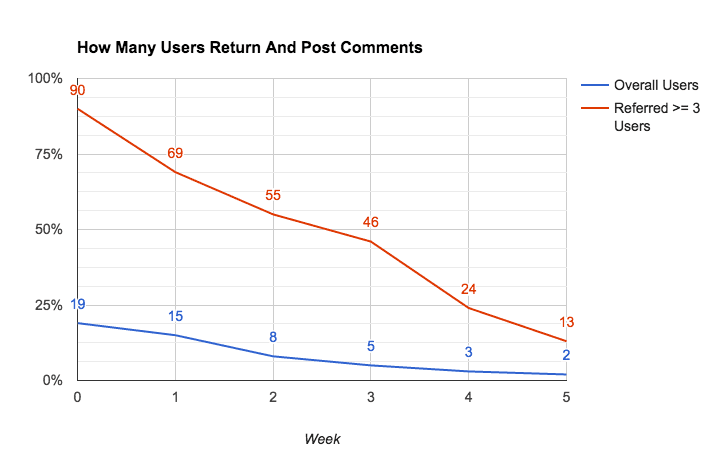
As you can see, the users that refer 3 or more of their friends do a lot more posting on the community section of your app.
With knowledge like this, you can start to make educated changes to your referral program. For instance, you could “sticky” an announcement of a special reward for those who refer their friends in your community section, specifically targeting the users most likely to take part in it. You could take the users who do the most posting and export a list of them into your email marketing tool, and then you could send messages specifically asking them for referrals.
But just remember that you’re almost always going to be dealing with correlation rather than causation. It’s highly rare that you’ll discover a strict 1:1 ratio of cause and effect in your data; instead, take what you glean from your metrics as a foundation for further experimentation. Make changes based on what you learn, but be prepared to change things back, or change things further, if you don’t get the results you want.
Little by little, if you stay focused on optimizing your funnel and chip away at your K-factor, you’ll build something really cool— a reliable, industrious referral program that will grow your business non-stop.
5. Revenue—ROI Is All That Matters
Some startups think that they don’t need to think about revenue at all. They prefer the Field of Dreams method: “Build it and they will come.” And that’s fine, if you’re at helm of a groundbreaking pre-unicorn company like Google circa 1998 or Facebook circa 2004.
But you’re probably not, and either way, times have changed. Raising a Series A is now about 4x harder than it was just five years ago. Investors want to see that you have a business behind what you’re doing, and they want to see that that business can work. You should want that too. Walking into a VC meeting confident that you have that part figured out gives you awesome leverage when it comes to negotiating terms.
Just don’t let an up-and-to-the-right graph fool you into thinking you necessarily_ have it_ figured out. Let’s say you’re Zirtual. You’ve got 400 employees, you’re growing rapidly, and you’ve got a $11,000,000 run rate. That’s almost $1,000,000 in monthly gross revenue, an impressive number:
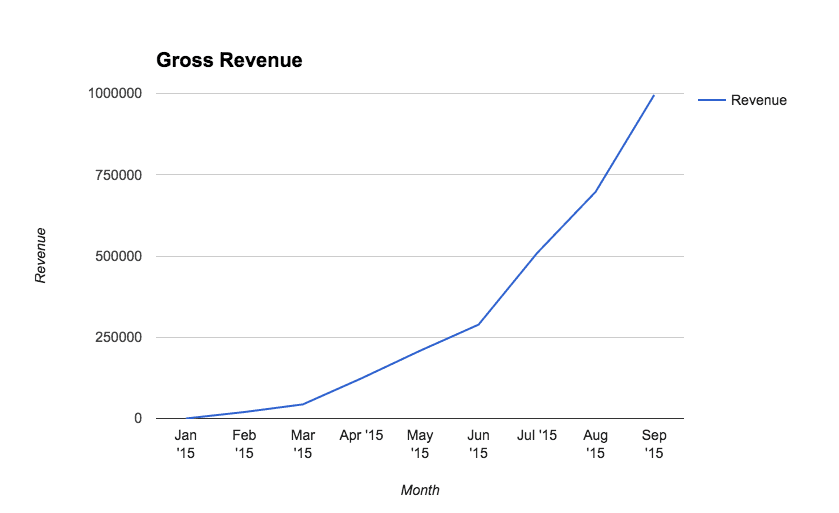
You can almost taste the champagne at the end of that curve. Unfortunately, that’s not all to the story, because even $1,000,000 in monthly gross revenue just doesn’t shake out when you have, say, 400 full-time employees. Though Zirtual’s assistants only got paid about $2,000 a month, the various overhead costs involved in employing workers can put the real monthly cost of even $12/hour employee up over $4,000.
With 400 employees, that’s $1,600,000 a month in costs. As Maren Kate Donovan said shortly after Zirtual’s collapse, “the numbers were just completely f###ed.”
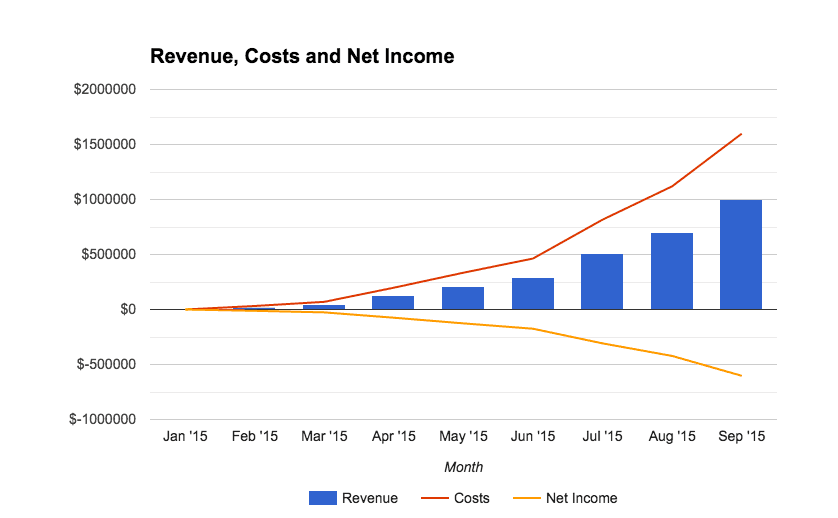
That’s the same set of revenue numbers, just with costs and net income factored in. This might be an extreme example, but there’s really no downside to cultivating a healthy wariness to graphs that tell you exactly what you want to hear.
To understand if you’re actually building a sustainable business, you need to look deeper than your gross revenue and figure out if your unit economics actually make sense by analyzing the value you’re getting from your users against the costs you’re incurring to acquire them.
The Actionable Metric: CAC and LTV
Where plain “revenue” metrics mask problems, you’re going to delve into the root of your business and find out exactly how you’re doing where it matters: how much does it cost for you to acquire customers, and how much is each one worth to you. This helps you avoid:
- Marketing your app to those who don’t give you the kind of value you want
- Spending too much (or not enough) on your marketing and acquisition
First, you’ll want to look at your purchase rates from the last month and compare them across your three channels to understand your different costs of customer acquisition, or CAC:
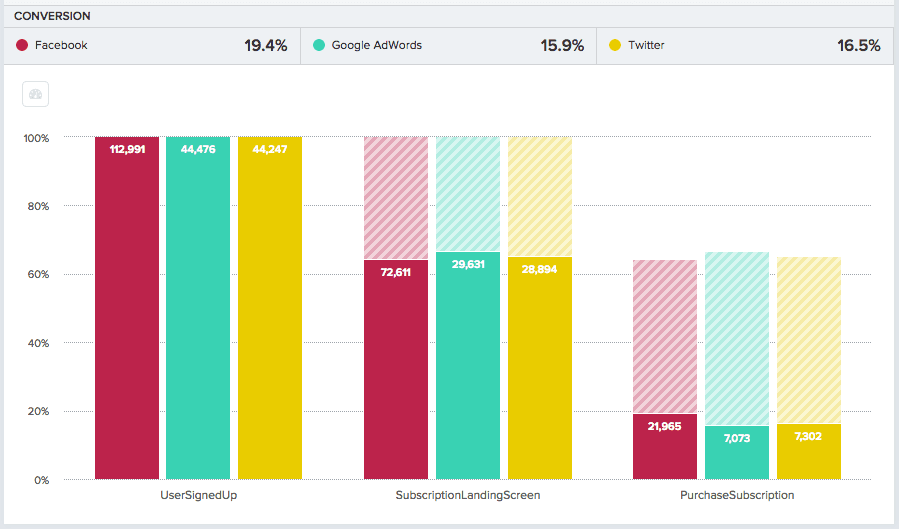
Say you spent the same amount—$12,500—on each one of these three acquisition channels. SaaS revenue metrics provider ProfitWell suggests you calculate your acquisition costs by dividing that number (your total marketing spend per channel) by the number of customers you acquire:

Here’s what you get from those calculations:
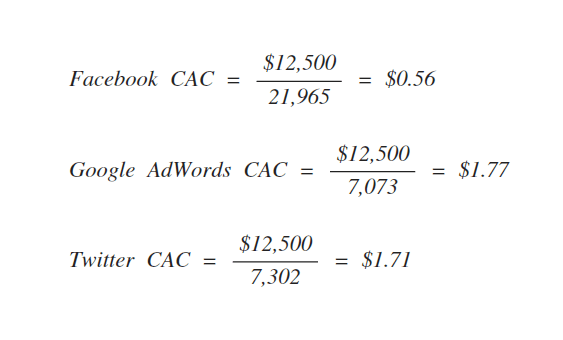
Next, you calculate the lifetime value of those customers. This number represents your monthly gross revenue per user divided by the percentage of users that churn monthly. ProfitWell boils it down like this (MRR means monthly recurring revenue, or gross revenue per month):

Assuming an industry average first month churn of about 90% of users, we get:
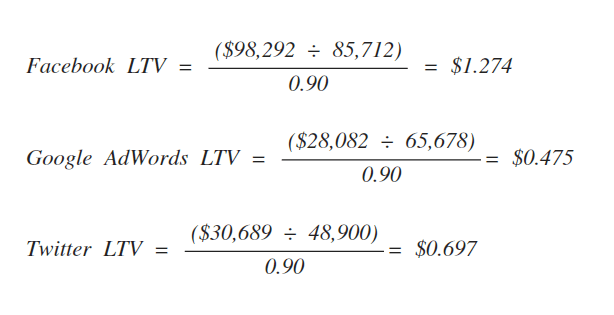
Finally, you’re going to compare your LTV and your CAC to get your LTV/CAC ratio. Simple:
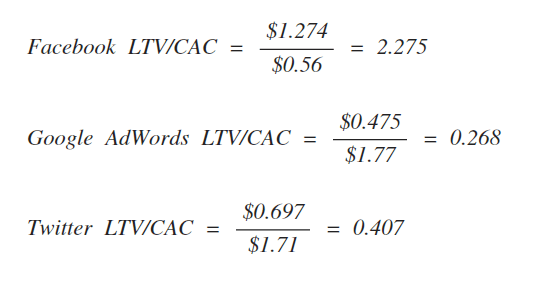
A ratio of one or greater is good; a ratio below that is not sustainable. As you grow, you will lose money on more and more customers until you’ve been bled dry, whereas a ratio of 2.275 like Facebook’s will set you up for long-term success. But that doesn’t mean you should be satisfied: ProfitWell recommends optimizing toward approximately a 3:1 ratio, depending on tradeoffs you make due to market strategy or your personal product roadmap.
There are companies out there that are revolutionizing industries and so can ignore this advice—Uber, Amazon—but for the vast majority, it’s indisputable: either you have a business model that works or you don’t.
Bring Your Metrics Into The Real World
Samuel Hulick, the UX expert and brain behind the one-person consultancy UserOnboard, criticizes the way that most companies use their data—and specifically, Pirate Metrics.
“While names like ‘Activation’ and ‘Revenue’ are easy ways for a company to describe the current status of any of its customers,” he says, “no part of becoming a customer ‘feels’ like any of the stages as they’re named. For example, this: would never happen.” The problem Hulick is identifying—that Pirate Metrics keep you distanced from your customer’s true needs—is really only a problem if you’re measuring things like DAU, downloads, or registrations.

When you pay attention to vanity metrics, you see what you want to see. And because all your attention is focused on faulty barometers of success, you not only avoid seeing the things you could improve, you lose touch completely with your customers and their experience.
Applying actionable metrics to the Pirate model does not just mean better numbers to look at. They’re totally different numbers. They’re numbers that tie into that fundamental bond between you and your customer. They’re numbers that track how people are getting to your app, what makes them leave and what makes them stay, what gets them hooked—what’s wonderful about your app, in other words, and what’s not.
They’re numbers that will get you one step closer to the #1 thing that Dave McClure looks for in companies he wants to invest in: a deep understanding of your customer. If you have that, then the potential in front of you is infinite.
Comments
Alan.Shen: so, signup is not activated , Aha!moment is ?

Archana Madhavan
Senior Learning Experience Designer, Amplitude
Archana is a Senior Learning Experience Designer on the Customer Education team at Amplitude. She develops educational content and courses to help Amplitude users better analyze their customer data to build better products.
More from Archana


