Release Notes: April 2017
Here's what's new in Amplitude as of April 2017.
We’re excited to announce new features and improvements since our last product update in March 2017. This month, we are releasing these improvements and updates to our product analytics product…
- New Features
- Cohort Comparison
- Ingestion Filters
- UI/UX Improvements
- Dashboard count on charts
- Improved “Browse Charts” search
- Multi-select in Settings
- Feature Improvements
- Funnels
- Behavioral Cohorts
- User Composition
- In-product support added
- Integrations
- mParticle integration update
- Resources
- Product Analytics Playbook: Mastering Retention
- Webinar Series
1) New Features
Cohort Comparison
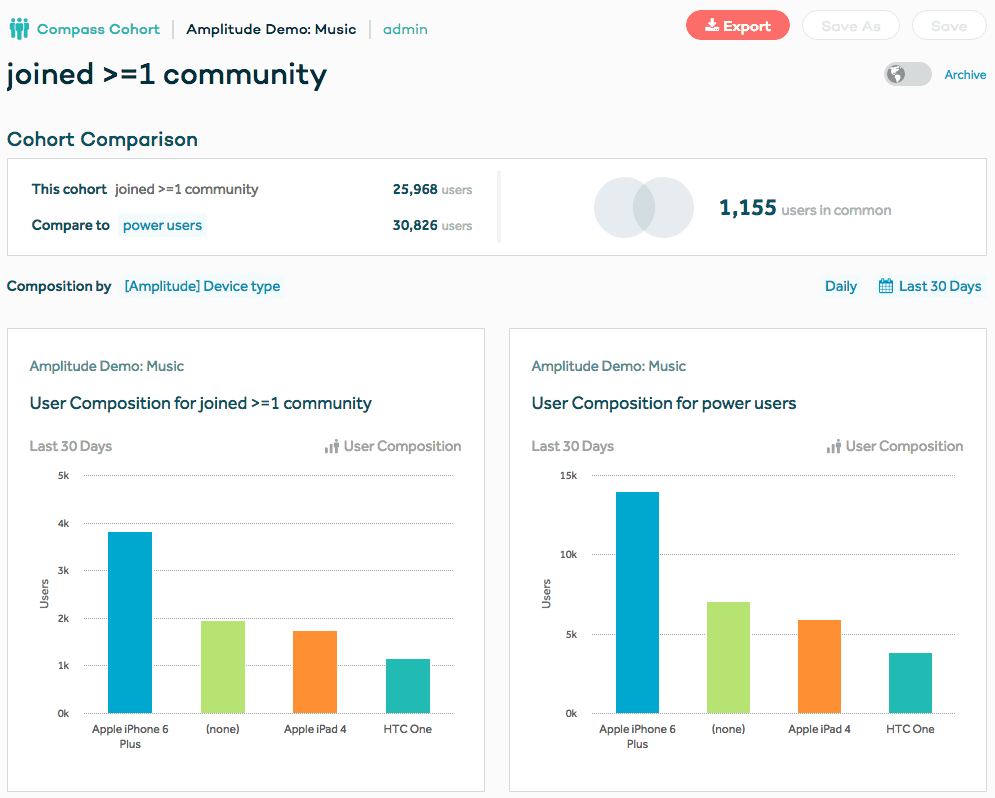
(Enterprise Only) When you create a cohort, our newly launched Cohort Comparison feature automatically characterizes and compares this cohort to all Active Users for the last 30 days. You can then choose a pre-existing cohort to compare it with, look at overlap between 2 cohorts, choose user properties for side-by-side composition, compare actives, retention, average events, and more!
Ingestion Filters
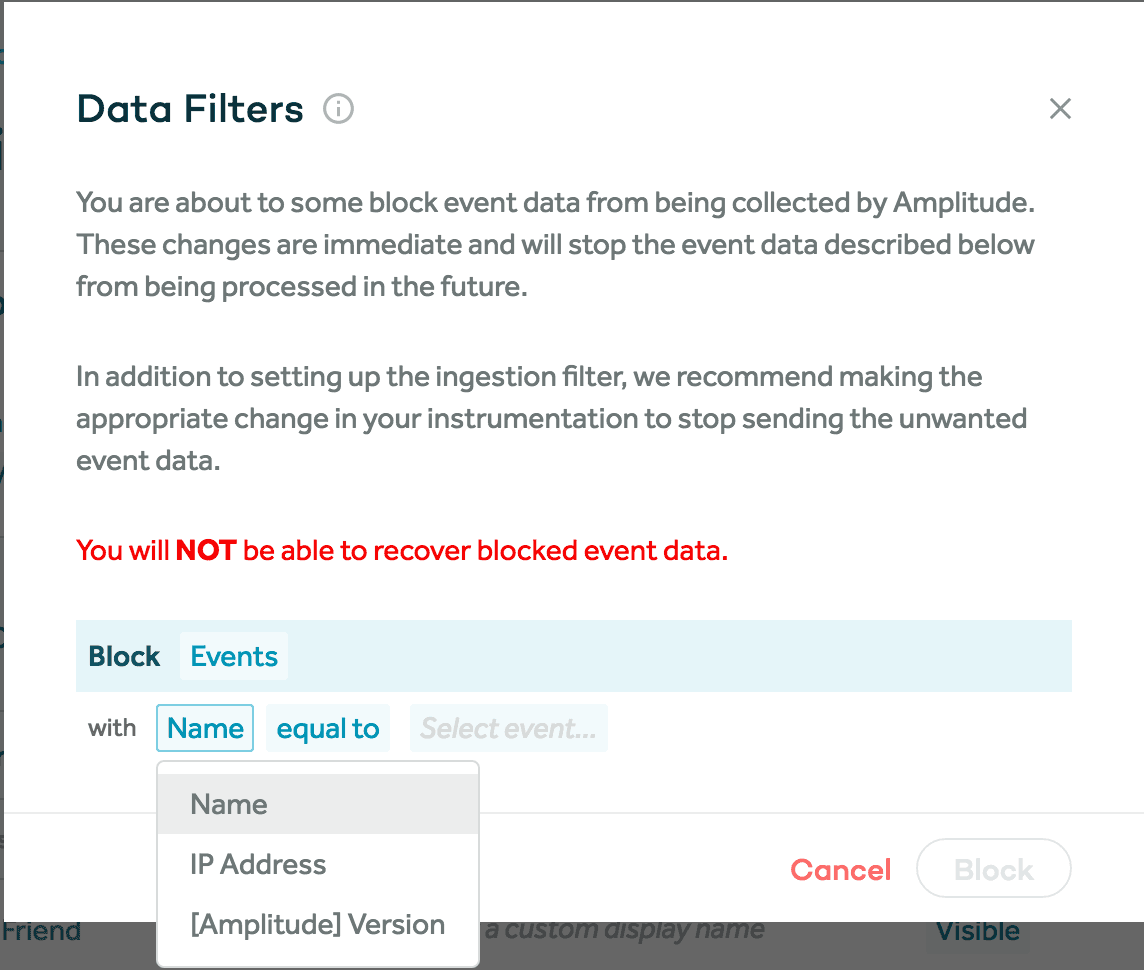
Organization admins and managers now have the ability to block event types, event properties, and user properties during data processing using data filters that can be set up in each project’s settings page. Please be sure to thoroughly read the documentation as blocked data cannot be recovered. Instructions on how to block certain types of data can be found here.
2) UI/UX Improvements
Dashboard count on charts
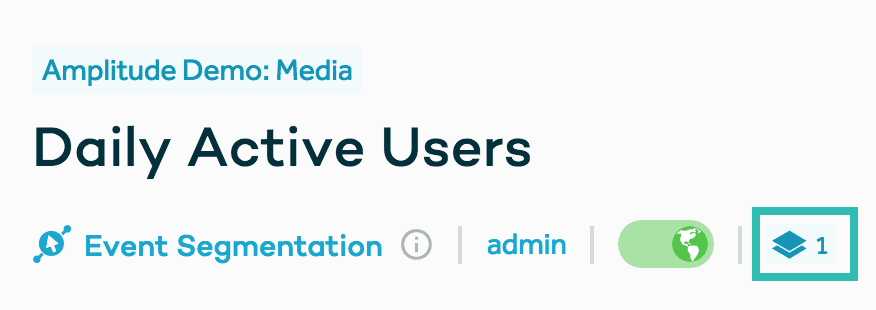
When you go to a saved chart, you will see a counter of the number of discoverable or your own unlisted dashboards containing that chart. If you click on the icon, you will get a dropdown menu that allows you to view any of those dashboards.
Improved browse charts search
The search bar allows you to filter through charts and dashboards based on title, author, project, chart type, and more. Read more about our updated search functionality here.

Multi-select in Settings
You are now able to bulk edit the activity and visibility of your events in the settings page of your project.

3) Feature Improvements
Funnels: New User Funnel Update
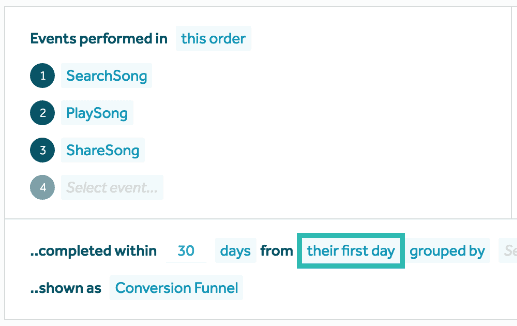
You can now choose to define a new user funnel as looking at new users who have performed the first step of the funnel at any point in the time period selected or looking at users who enter the funnel on the day they were new. Read more about it here.
Funnels: Session-Based Funnels
By leveraging the “holding constant” feature in our Funnel Analysis chart, you can create session-based funnels by holding constant ‘[Amplitude] Session ID’. This will restrict the funnel so that all events in the funnel must be performed in the same session. Read more about it here.

Behavioral Cohorts: Group-Level Cohorts
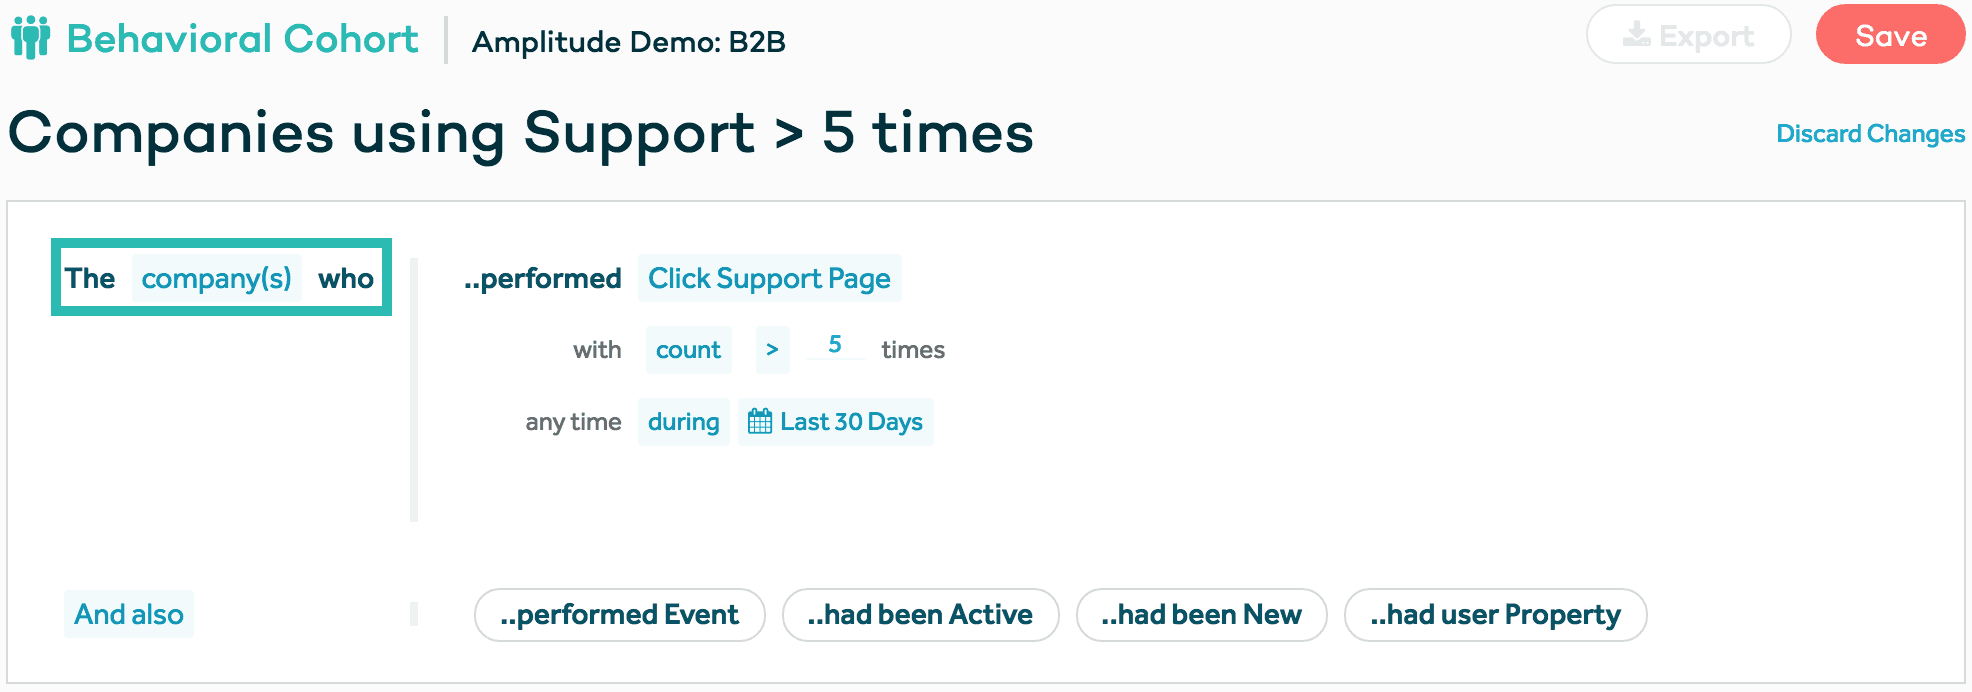
(Enterprise Only) You are now able to create group cohorts. To create a group-level cohort, select the group name you are interested in the left side of the definition. Find more information about creating group cohorts here.
Behavioral Cohorts: View Groups in Microscope
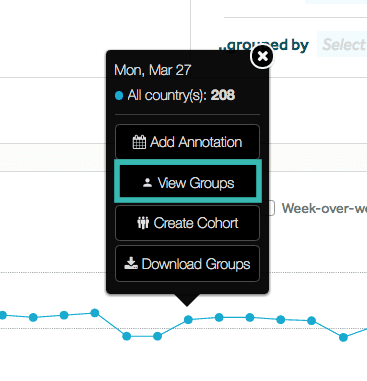
(Enterprise Only) If you are using account-level reporting in a chart, you can now view the groups that make up a data point through Microscope in the “View Groups” option. This will bring up a list of groups contained in that data point and clicking on any of the group names will take you to a list of users in the User Activity tab that are in that group. Find more information about viewing groups in Microscope here.
User Composition: Account-Level Reporting
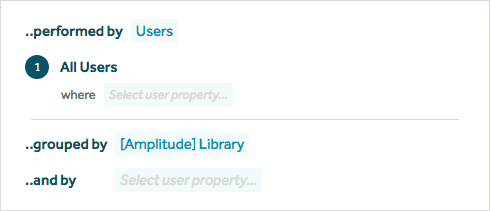
(Enterprise Only) Previously, you were unable to view our User Composition chart type by groups. Now, you can do account-level reporting on a user property too by selecting any group you have instrumented in the right module. Find information on how to set up account-level reporting here.

4) Help Widget
There is now an in-product help widget located in the top right corner. You can use this widget to search for Help Center articles or submit a support ticket without having to navigate away from Amplitude.

5) Integrations
mParticle Integration update
For customers sending us data via mParticle, there will be an upcoming change to make the ‘[Amplitude] Library’ user property value display ‘mParticle’ for any event sent from mParticle moving forward. This user property value is currently set to ‘http/1.0’ so the change will make it clearer as to how events are being sent to Amplitude.
6) Resources
Product Analytics Playbook: Mastering Retention
In February, we released the Product Analytics Playbook, Volume 1: Mastering Retention. This first volume provides a thorough 155-page guide on how to use data to make better product decisions and improve user retention. You can download the full volume online.
Webinar Series
Since January, we’ve been hosting a weekly webinar series on the Amplitude platform. During the webinar, you can ask questions via a chat box! Some previous webinars include an Amplitude Platform Training for New Users and a Deeper Dive in Retention & Stickiness. You can find and register for our next webinars here.
Sign Up for the Amplitude Blog Newsletter
Get a roundup of articles about building better products delivered to your inbox once a week.

Jessica Chiu
Director, Global Technical Support, Amplitude
Jessica Chiu leads the corporate Solutions Architect team at Amplitude. Her team helps lead customers through Amplitude implementations to get up and running quickly and successfully.
More from Jessica


