Behavioral Cohorts: Find Your Most Engaged Users
To really understand how users are interacting with your app, you need to go beyond grouping users based on their characteristics.
Segmenting your users based on properties like country, age, and app version can give you a lot of information about how these different characteristics may influence engagement with your app. However, to really understand how users are interacting with your app, you need to go beyond grouping users based on their characteristics, and start grouping them based on what they do.
When figuring out who your power users are — the ones who keep coming back to your app day after day — you need to know what they do in your app, not just who they are. The most famous example is Facebook’s discovery that adding 7 friends in 10 days was the leading indicator for an engaged user. Now everyone wants to find their own “magic metric”: that threshold they need to get their users across so that they become loyal, retained users.
We previously went over how to find your own magic metric using some surprisingly simple statistics, and now we’re going to dig into the tool that makes it all possible: behavioral cohorting. Cohorts allow you to create and save groups of users based on their behavior and/or properties. You can then view each cohort as a segment in any of our graphs (ex. funnels, retention, etc.). Cohorts reside in their own tab on the dashboard and are available in our Enterprise level plans.

Defining a behavioral cohort
You can define a cohort based on user actions and/or user properties:
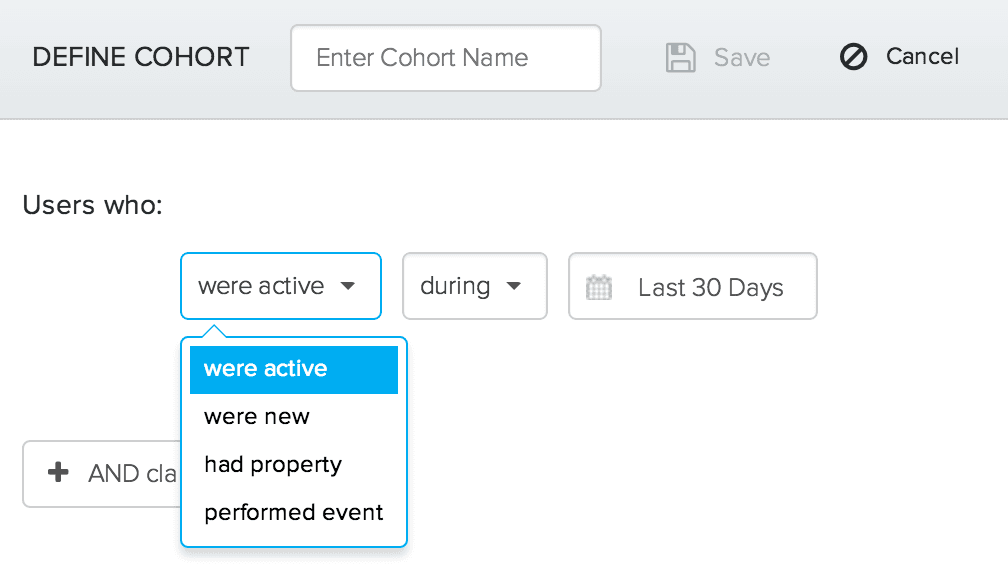
Let’s say that we’re in charge of growth and user engagement for a text-by-voice app, and we want to figure out which actions are the best predictors of engagement and retention. One pretty obvious hypothesis is that users who send more texts soon after getting the app will uncover the app’s value quickly and stay engaged. With the cohorting tool, we can easily define a cohort made up of users who sent more than 10 texts within their first 7 days of using the app:
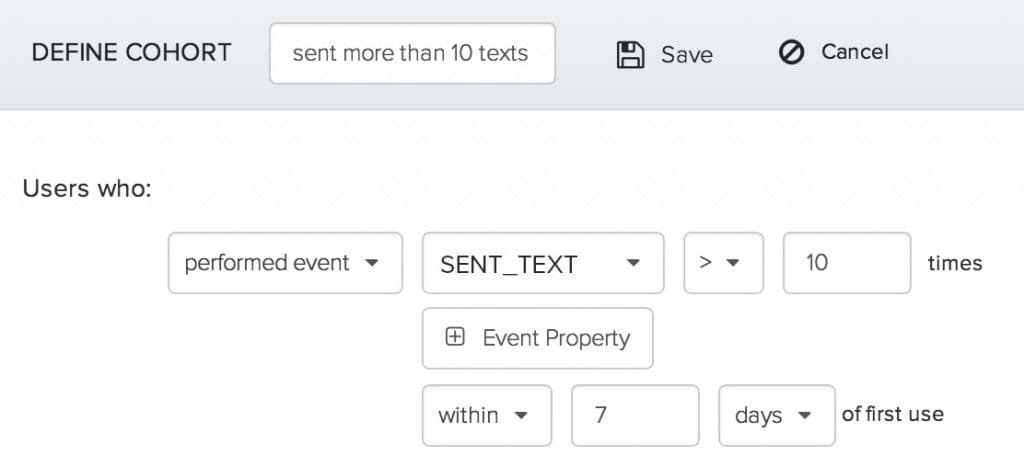
See cohort details
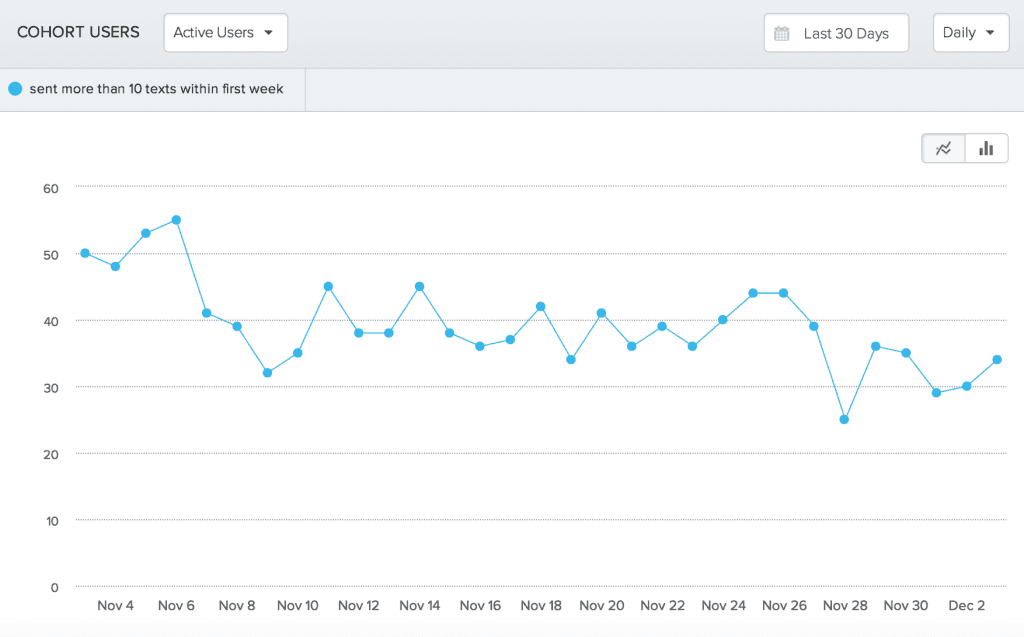
Now that you’ve defined a cohort, you can view cohort details as well as save the cohort for later use. The cohort details dashboard shows a graph of active users in your chosen cohort over a given timeframe:
In addition, the right sidebar shows the number of users in your cohort and the last time the cohort was computed, as well as a sample list of users:
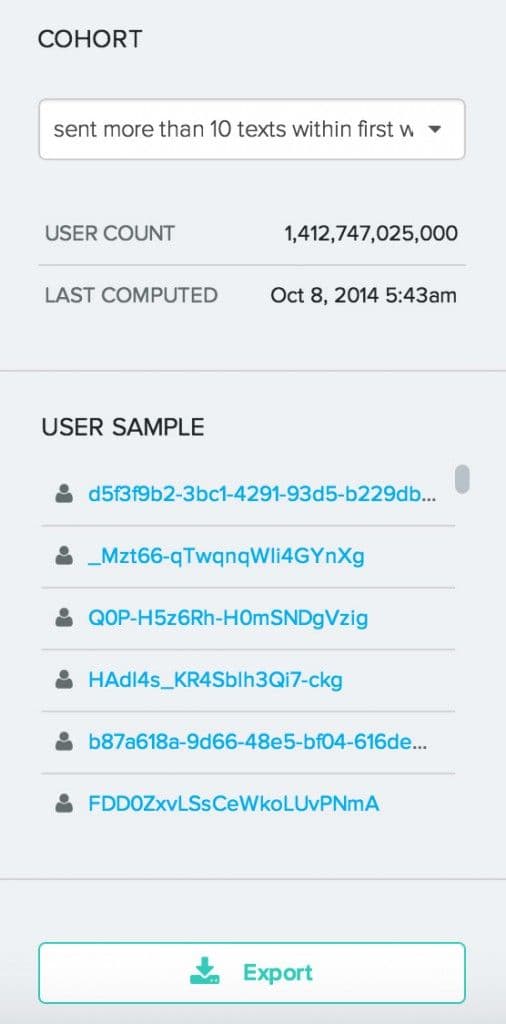
User sample list and individual user histories
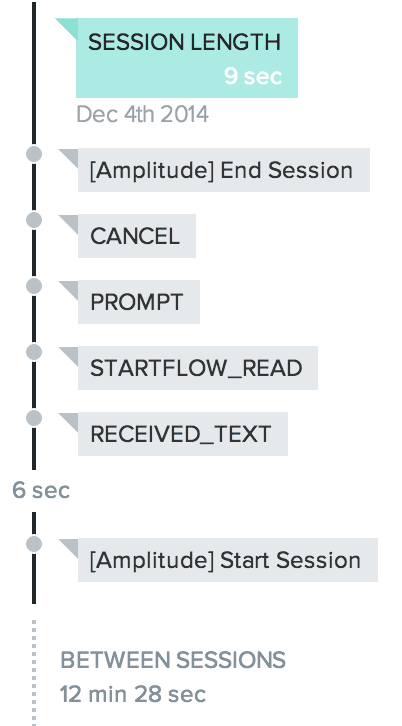
The User Sample list contains users within your cohort. By clicking on a user, you are taken to the User Activity tab and can view that user’s properties and event timeline:
Export complete list of users in a cohort
In addition, you have the option of exporting the entire list of users in your cohort in a .csv file. This file will include any user properties you’re collecting. This list is a great resource for targeted marketing campaigns or further analyses.
Using cohorts as segments: compare cohorts to other groups
This is all pretty useful stuff, but the real power of cohorts is the ability to use cohorts as segments throughout the Amplitude dashboards. This means that not only can you look at your cohort in tabs like Funnels and Retention, you can also compare it to other groups of users. Let’s go back to our original intent: looking for our text-by-voice app’s equivalent of adding 7 friends in 10 days. We made a cohort of users who have sent more than 10 texts within 1 week of signing up. Do these users stick around more than other users? To answer this question, all we have to do is use our cohort in the Retention tab. We can make one segment that contains all of our app’s users, and compare it to a second segment that only contains our define cohort.
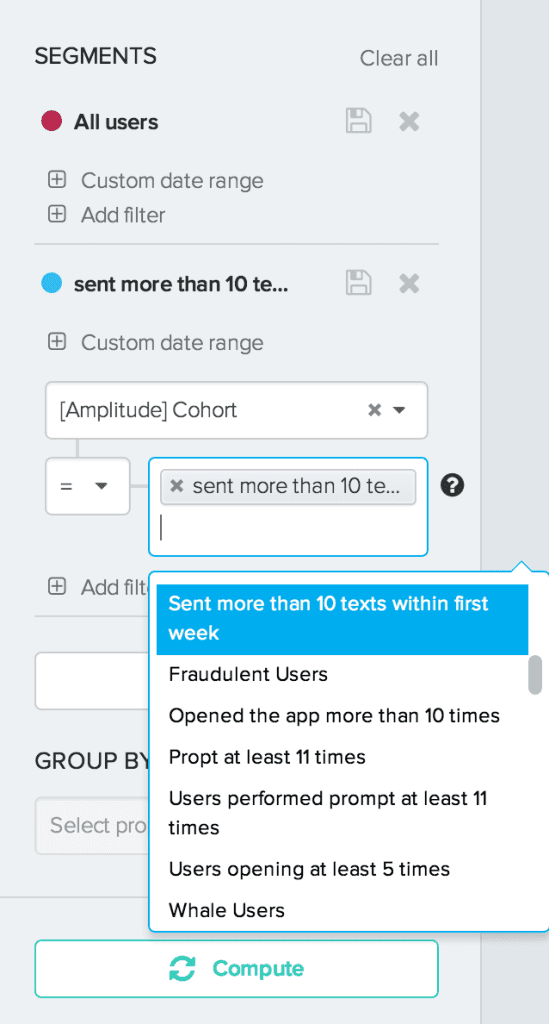
Measuring retention of different cohorts
Once we click compute, we can immediately see the difference in retention between users who sent more than 10 texts within the first week vs. all of our users combined. Keep in mind that our retention graphs show nth day retention.
The overview retention graph clearly shows the difference in nth day retention between your cohort and the rest of your users.
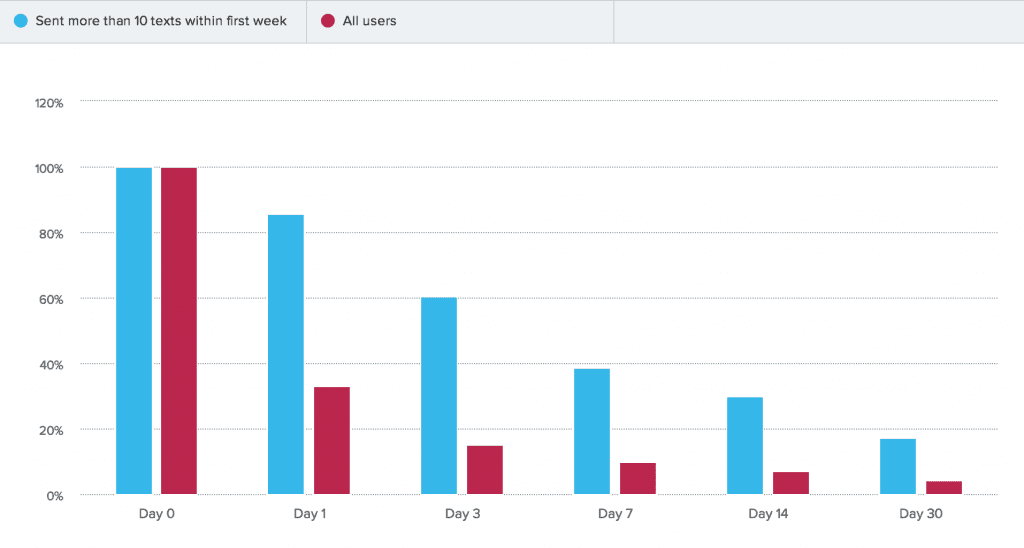
This retention view shows nth day retention day-by-day.

Clearly, there’s a pretty striking difference in the percentage of users who keep using the app between the two segments. Of course, you’ll want to test out a few other hypotheses and run some statistics to see which actions you really want to encourage in your users, but from this simple retention analysis it’s already safe to conclude that if you want your users to stick around, you should focus on encouraging your users to send as many texts as soon as possible.
Now it’s your turn
Hopefully by now you’re already buzzing with ideas about cohorts that you can analyze in your app. If you’re not using Amplitude yet, you can check out cohorts in our interactive demo. If you have any questions about cohorts, just get in touch!

Alicia Shiu
Former Growth Product Manager, Amplitude
Alicia is a former Growth Product Manager at Amplitude, where she worked on projects and experiments spanning top of funnel, website optimization, and the new user experience. Prior to Amplitude, she worked on biomedical & neuroscience research (running very different experiments) at Stanford.
More from Alicia


