The Complete Guide to Churn Prevention & Mitigation
Learn how to develop a strong churn prevention strategy to identify customer friction and create customer experiences that boost retention.

Churn prevention is the process of identifying and solving customer frustrations, friction points, and drop-off patterns to prevent attrition.
Most products or services will experience some level of attrition. While knowing how many customers are churning may be uncomfortable, it’s crucial to understand why. Use analytics to uncover your product’s friction points and inform how to reduce customer churn.
- Churn prevention focuses on identifying customer frustrations early so that you can take mitigative steps to prevent churn and ultimately boost revenue.
- Churn rate is the number of customers or revenue lost over a specified period, divided by the total number of customers or revenue at the beginning of that period.
- Churn prevention is a strategic imperative, especially for industries that thrive on continuously keeping customers happy and subscribed.
- The best analytics tools let you see a granular view of the issues causing churn, ensuring the team’s response or product optimization aligns with the problem.
- Focusing on nuanced distinctions, crafting hypotheses, conducting well-crafted experimentation, and applying learnings can contribute to retaining loyal customers.
- Preventing churn involves grouping users by similar traits or behaviors, identifying which groups have higher churn, and testing product changes to improve retention.
What is churn prevention?
Churn prevention involves identifying where customers are feeling frustration and friction, then creating better customer experiences to avoid attrition. If you don’t prevent attrition, your product will suffer from a “leaky bucket,” with customers churning faster than you can acquire them. The questions you need to ask are: to what extent are customers leaving, and are their departures preventable?
You can’t rely on acquisition alone to solve revenue issues if you can’t retain a healthy percentage of users. To understand why customers are churning, you need to know the relevant baselines and usage patterns for different groups (also known as cohorts). This information will guide your comparisons and any adjustments you make for churn prevention.
- Churn prevention is about identifying customer frustrations and drop-off patterns early, so you can take mitigative steps and boost revenue.
- Cohort analysis groups users into cohorts based on when they discovered your product (acquisition cohorts), how they interact with your product (behavioral cohorts), or what they’re expected to do in the future (predictive cohorts). You can use these cohorts to identify groups that are more or less likely to churn
- In-product behavior is a key part of churn prevention because the underlying “why”—the reason for dropping off and leaving—may vary among customers based on their interests or needs.
While churn analysis may uncover the pain points of your product, it won’t be all bad news. Understanding and preventing churn will strengthen existing knowledge about your customers and give you the insights you need to optimize.
How to implement a churn prevention strategy
Any product strategy is only as effective as the tools used to create it. The right product analytics solution should drive any product adjustments you make because accuracy and granularity are important prerequisites for conducting retention analysis and mitigating churn.
The platform you choose should be able to link user behaviors to outcomes and clearly visualize these patterns.
In Amplitude’s Retention Analysis chart, you can see that Day 7 retention is 10.3%. Explore this chart in our free self-service demo.
You can also visualize retention in a bar chart to see how churn breaks down across a 30-day window.
The shaded bar on each day represents the amount of churn—89.69% on Day 7.
The role retention analytics play
Retention analysis can show the typical, atypical, positive, or negative details of product use following a sign-up or subscription. You can use these insights to gauge the likelihood of churn and, in turn, the most appropriate messaging or optimizations for different cohorts.
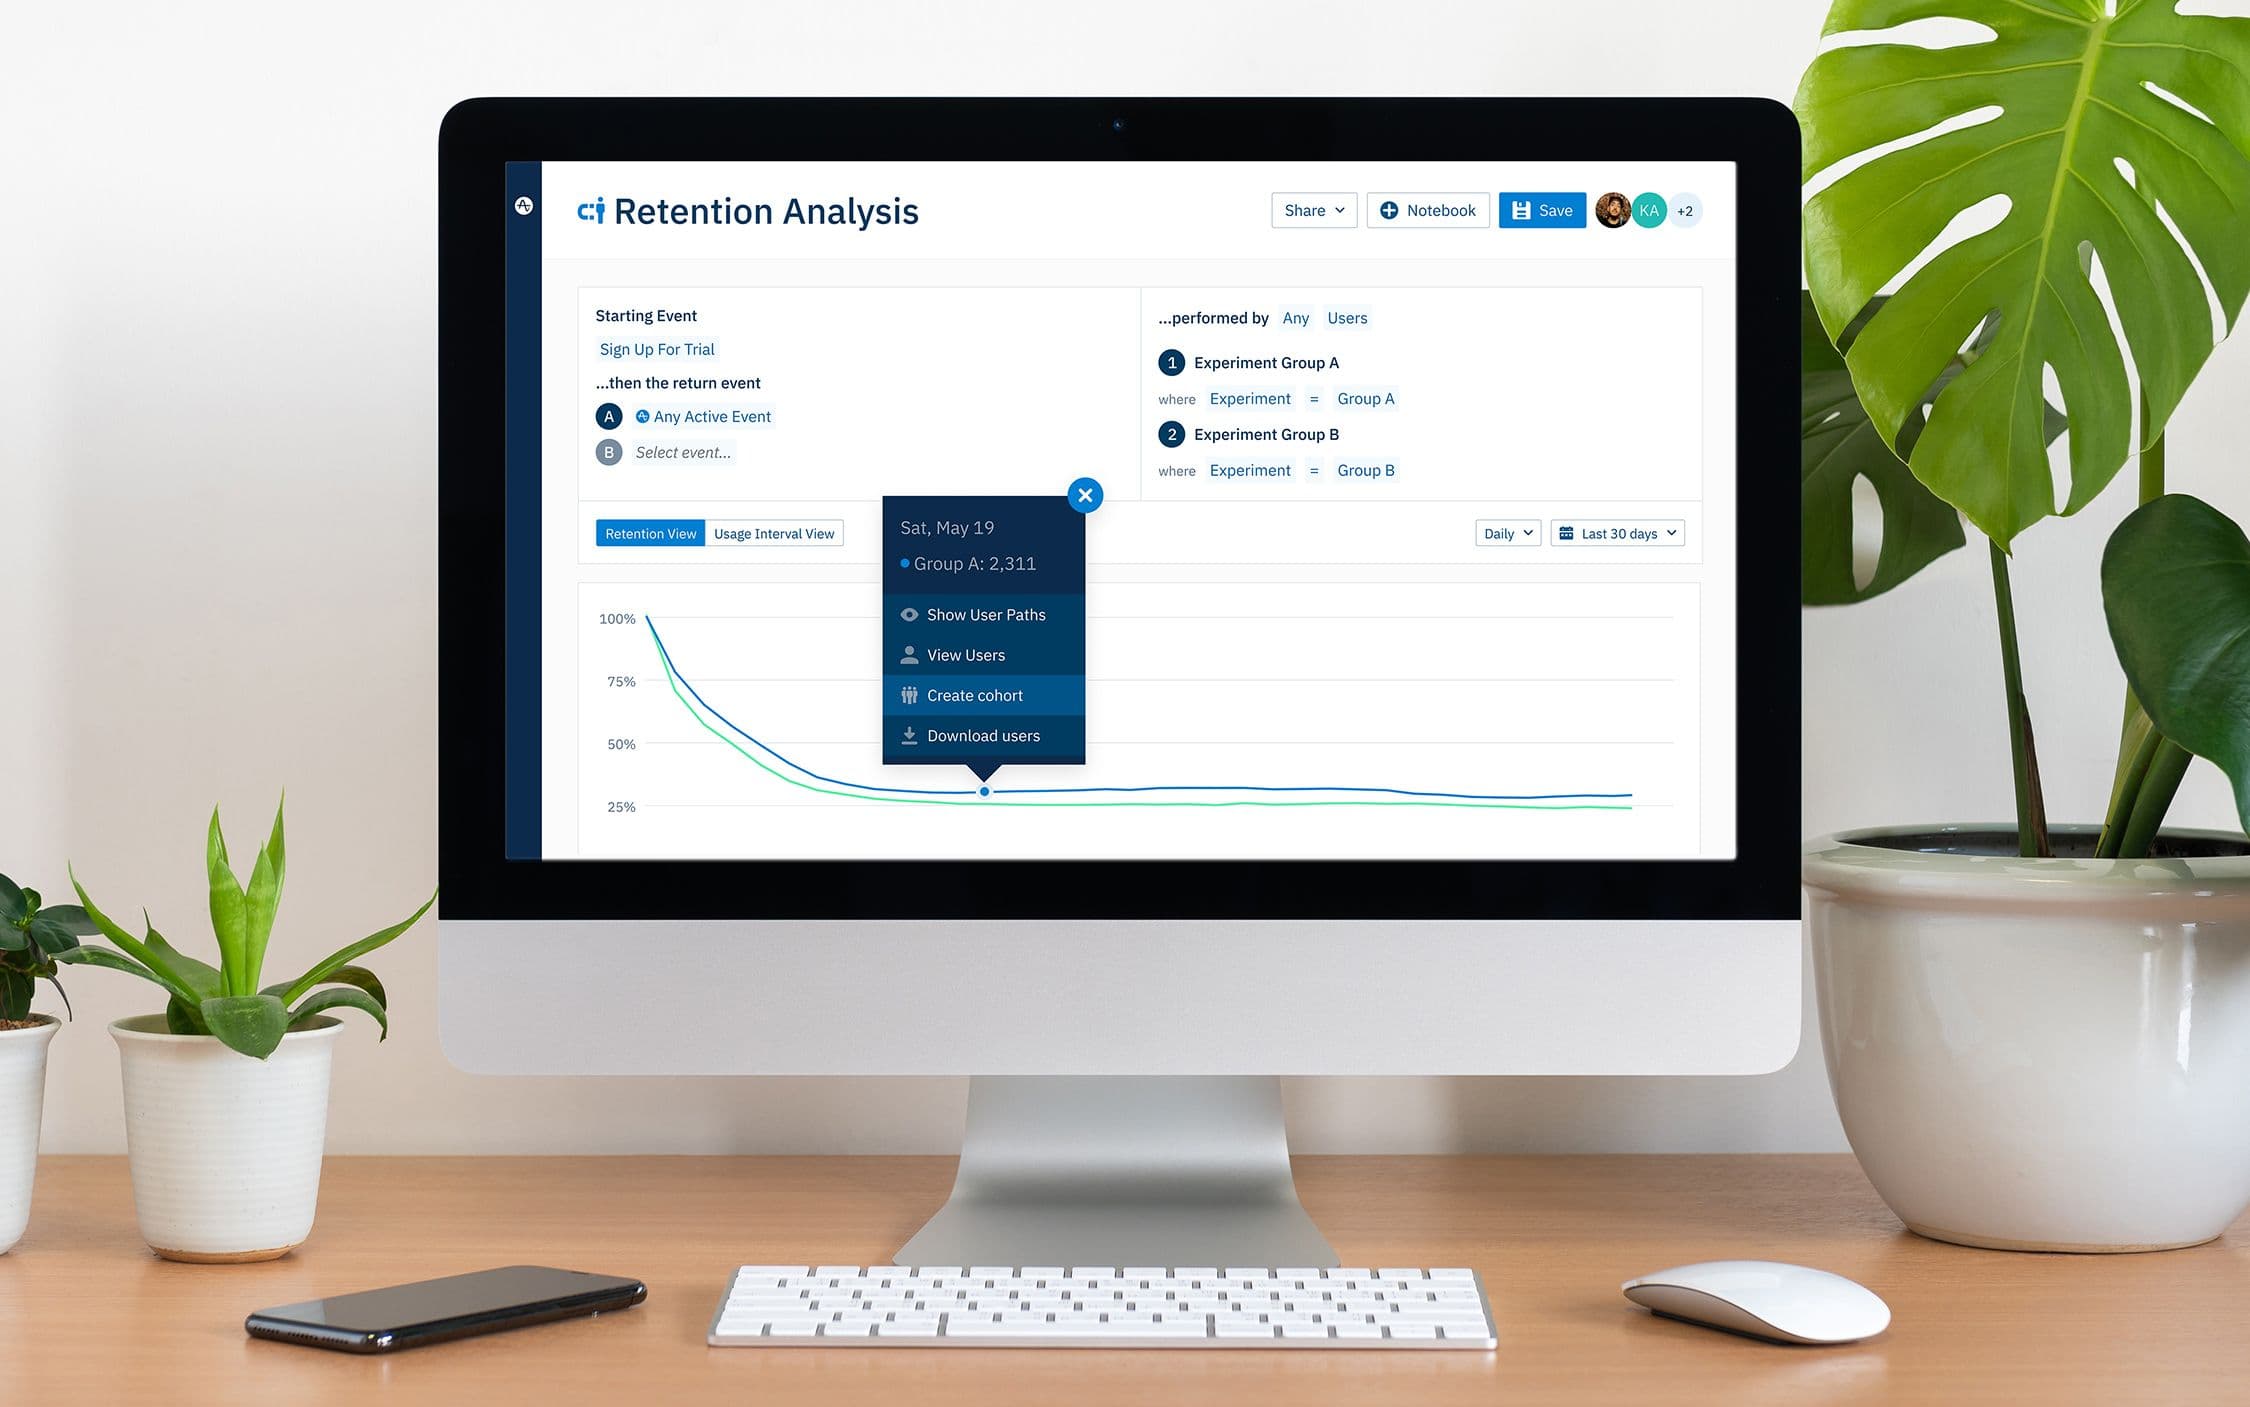
- A retention analysis might show two cohorts for a hypothetical music-streaming app—users who favorite songs and those who don’t.
- These cohorts are approaching the app differently. The former is attempting to organize their experience, while the latter may be enjoying a curated or algorithmically suggested playlist.
- Understanding these differences and how they relate to churn can inform what gets highlighted in any in-app notifications or email campaigns.
This Retention Analysis chart shows that users who favorite songs (blue) have higher retention than those who don’t (green). You might use this insight to surface the favorite song feature earlier in your onboarding flow or create more marketing materials around it.
Identifying and approaching cohorts with curiosity can benefit product teams. But not all products are the same and used with the same frequency—think grocery delivery apps with weekly usage versus tax-filing apps with yearly usage. It’s critical to establish a baseline for your product’s typical usage (its product usage interval) and determine which features align with your core value to customers.
Step-by-step guide to preventing churn
When considering cohorts in the context of churn, you should conduct churn rate cohort analysis. The best step-by-step process for this analysis usually involves:
- Grouping users together by common characteristics (e.g., when they joined the music-streaming app).
- Identifying where in the customer lifecycle they tend to churn.
- Analyzing other cohorts for comparison (e.g., users who favorite a song and those who don’t).
- Developing and testing hypotheses for why users churned.
- Rolling out product adjustments to reduce churn.
Comparisons between cohorts can be useful because you might find out that there’s a step in the customer journey your team overlooked or undervalued.
For example, users who read your product reviews before purchasing may be more inclined to take a retention-boosting action than those who go into your product with less context. The reviews might show where your existing customers are experiencing the most value, or they might highlight a feature that isn’t positioned prominently in your product interface.
As you figure out what matters most and implement the corresponding changes, you can use analytics to gauge whether customer retention improves or worsens over time. Even if there’s a misstep or false conclusion, analytics can help you recognize that and adjust accordingly.
Measuring customer loyalty
In any product, certain features may be more likely to promote “stickiness,” or recurring habits and behaviors that lead to loyalty.
There’s an easy way to measure feature engagement—an engagement matrix for feature performance and adoption:
Amplitude’s Engagement Matrix lets you select features within your product that you suspect have some stickiness. Or, lean into default options that swiftly recognize the most frequent or infrequent actions. Use this chart to see how your product features look relative to each other.
- The top-right corner displays actions performed with high frequency by a high number of users, indicating core product features that attract attention and usage.
- The top-left corner reveals actions a relatively small number of users take with high frequency.
- Meanwhile, features in the bottom-right of the matrix may be important but are not regularly accessed, and the bottom-left may indicate potential problem areas.
Four churn prevention ideas to help retain your most valued customers
With your analytics platform doing the heavy lifting on churn analysis, your focus can shift to nuanced distinctions, hypothesizing, well-crafted experimentation, and learning. Here are four important churn prevention ideas to remember:
- Identify the why. After identifying where customers churn or their significant inflection points, teams must interpret the data and identify the why. For example, are the customers you’re acquiring through a specific channel not the right fit and immediately dropping off? Or are users struggling to reach the “aha” moment or activation point because of a confusing onboarding process? Next, go further in your questioning and ideation. Could user value be enhanced through feature iterations or add-ons? Which features are the most in demand?
- Distinguish between customer and revenue churn. Some customers might stay with the product or service but reduce their tier or plan level. Distinguishing between customer and revenue churn is important so that teams can upsell and cross-sell appropriately.
- Prioritize the product pipeline. New and improved features are always in the pipeline of any business, but with limited resources, how do you decide which ones to prioritize? Churn analysis helps you focus on the most important features to address evolving customer needs and improve retention.
- Embrace experimentation and A/B testing. Worthwhile experiments typically start with a strong hypothesis, minimized variables, adequate technological resources (including proper data governance), and the humility to recognize confirmation bias. Teams may be surprised by which versions of their product, or product-related content, resonate most with audiences by running A/B or split-run testing.
With these ideas guiding your churn mitigation strategies, you can ensure that you operate efficiently and from a solid foundation. Instead of guessing or moving indiscriminately, you’re predicting churn and addressing it in a data-driven way. Identifying the “why” could surface relevant insights for your marketing campaigns or lead qualification process. A/B testing could inspire your content teams. The possibilities are endless and go even beyond churn prevention or mitigation.
Churn prevention model examples
A team might notice that users who take advantage of a specific feature or set of features have a lower churn rate. Let’s return to the previous music streaming app example. We found that users who choose to favorite songs are less likely to churn. We might even hypothesize that they’re more likely to opt for a paid subscription based on that level of proactive, organized engagement. In addition to inspiring changes to the product, this information could increase the cost-efficiency of marketing campaigns by only targeting users who favorite songs with upgrade options.
The popular meditation app Calm tripled their retention rates by analyzing cohorts in Amplitude to illuminate retention opportunities. They found that the small number of users who engaged with the “reminders” feature—designed to prompt a regular meditation habit—ultimately had higher retention rates than those who didn’t set reminders. Naturally, the company responded by making this feature more prominent.
This is a common and effective approach. When you identify patterns, you can improve your products by driving attention to valuable, retention-promoting features. You can also create marketing materials or help resources around their effective usage. And if a user hasn’t yet accessed this functionality, direct in-app messaging could put the key features on their radar and frame it in a relevant way based on their cohort.
Other examples of churn prevention models in action include:
- Dave improved retention by 5.7% by exploring different retention loops within Amplitude. Dave discovered that users who added more recurring expenses to their accounts stayed engaged with the product at a higher rate, so they increased the number of additional expenses during onboarding.
- Showmax used Amplitude to find that users were coming to their site for one particular show. This information led them to invest in more projects with the director of that show, thus increasing retention in their market.
- NBC doubled their Day 7 retention numbers using Amplitude’s funnel analysis and A/B testing tools. They were able to see increased interest in a reconfigured homepage experience.
Leverage the right tools to prevent churn
Growth is important for any business, but there’s a certain amount of honest self-reflection that comes before any improvement is possible. A feature designed with great enthusiasm and the expectation of widespread use may, in fact, be doing the opposite. Some difficult conversations and decisions can result from this deep work.
But it’s worth it. When teams boost retention by improving their products, even acquisition can become easier. Some of your satisfied customers will be more likely to leave glowing reviews or recommend your product to those in their networks, resulting in viral growth loops for your product.
Churn mitigation is all about identifying friction points or drop-off patterns that hinder growth and then using that information to improve. By leveraging an analytics platform that’s easy to use, teams can prioritize their product pipelines to maximize customer value, retention, and brand evangelism.
Watch the video below to see how you can calculate customer churn in six clicks with Amplitude. From there, try it yourself with Amplitude’s free self-service demo, or start analyzing your product retention with a free Amplitude account.


Noorisingh Saini
Global Content Marketing Manager, Amplitude
Noorisingh Saini is a data-driven marketer managing global content marketing at Amplitude. Previously, she managed all customer identity content at Okta. Noorisingh graduated from Yale University with a degree in Cognitive Science.
More from Noorisingh


