The Advantage of Cross-Platform Analytics
People are not navigating products and services in a clean, tidy manner anymore. They are using several different platforms, often going back and forth between native apps, mobile sites, and desktop browsing as they make their way to becoming customers.
You may think you have a handle on your user behavior, but unless your analytics are fully cross-platform you’re not going to be getting the full picture.
Users just don’t navigate apps in tidy, single-platform flows anymore.
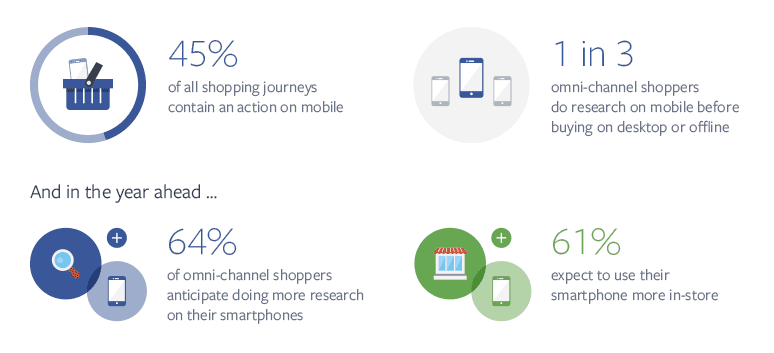
In a study of e-commerce companies, Facebook found that 45% of all shopping journeys included at least one mobile event. For an e-commerce site, any one of those actions could be a crucial point of analysis.

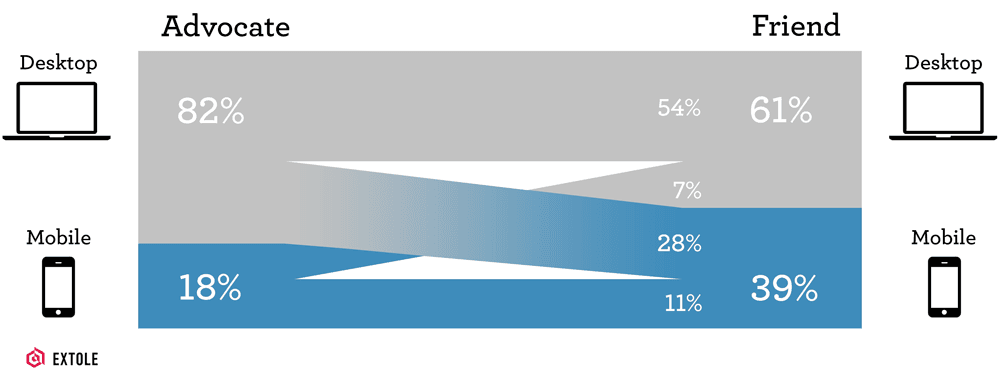
More recently, referral marketing platform Extole found that similar cross-platform behavior had taken over the process of sending and receiving invites to try different services.

“Advocates” sent links to their friends from desktops about 82% of the time, but those were only opened by friends on desktops about 54% of the time—28% of the time, they were opened on mobile.
The lesson is clear: people are not navigating products and services in a clean, tidy manner anymore. They are using several different platforms, often going back and forth between native apps, mobile sites, and desktop browsing as they make their way to becoming customers.
While a seemingly small shift from the outside, this created what a Verizon marketing director called “chaos” for marketers trying to track user behavior. It was suddenly all too clear that existing tools for tracking behavior, which are optimized for desktop web browsing, can only really catch user action in fits and starts. They can’t capture a broad picture.
But with analytics vendors that do allow you to analyze how people are using your product across different platforms, getting a full picture of your user behavior doesn’t have to be chaos.
Cross-platform analytics let you look at users who are moving from your native app to your mobile site to your desktop site, combine data from all those platforms to get a broad understanding of your user base’s behavior, and then dive into specific performance metrics on each.
This kind of versatility in your analytics is crucial to making the right product decisions, understanding user flows and conversions, and refining your core UX platform-wide.
Cross-Platform Data Collection
Without cross-platform analytics, you slow down the efforts of your product teams to understand the changes they need to make.
Collecting data across platforms manually, organizing it, cleaning it up, and presenting it in readable format is a time-consuming affair. It’s unacceptably slow if you’re trying to iterate fast, and it keeps valuable information on user behavior out of your hands.
If each platform is sending out its own version of a user identifier—real_name: compared to name: for instance—then you’re going to have to spend more time and hire more people just to process all of this data into a usable end product.
Having easy access to that end product is crucial. Without being able to track users as they move across platforms, you won’t just have an incomplete behavioral model—you’ll have an actively misleading one. It’ll show you conversions and bounces, but you won’t be able to see any of the context or any of the user journey behind it.
This is a problem that Rocket Games ran into as they started growing. They make casino games for Facebook and mobile, and they needed information on how all of their games—over 40 of them—were performing. But at one point, it was actually taking days for data to flow into their dashboards.
If you’re using multiple analytics providers to bring in your data or even doing parts of it manually because your provider can’t properly track a certain platform, the amount of time you’ll spend just collecting data is going to increase as you grow your business. With Rocket Games, their query speeds slowed to a crawl.
What cross-platform analytics can do is pull all of that data together into one place. It sorts everything by platform in a consistent manner so there’s no clean-up. And, crucially, it’s fast.
Steven Jian, the CTO and Cofounder of Rocket Games, says cross-platform behavioral data is now so important that his business “wouldn’t be able to survive without it.”
Rocket Games has users on iOS, Android, Amazon, and Facebook. Collecting that data separately through siloed solutions might work in the short-term, but Rocket Games pushes updates multiple times a week to their catalog of over 40 separate games. They analyze about 3 billion events monthly to do that.
There’s no way that Rocket Games or any other company can efficiently and accurately analyze their user behavior without cross-platform mobile analytics.
Optimizing The User Journey
The modern user journey is a complex exchange of information across platforms. This makes many of the traditional methods of tracking conversions, which rely on single platforms and desktop events, functionally obsolete.
The classic funnel model—drive user acquisition, activate more users, and generate more revenue from each user—is useful. The problem is that the data you need to collect to understand it is multifaceted.
Users do a bit of research on their phone, open up an email from your company, watch a video of yours, do some price comparisons on their phone, and maybe all in the same hour! If all you’re doing is tracking a browser cookie, then you’re missing all of that. Today, you need cross-platform analytics if you want to understand your funnel.
(Source: CMO)

Fareed Mosavat, head of the growth team at Instacart, wanted to look at how users moved through key funnels like first-time user sign-up and activation on each platform. That let Fareed do what he calls “opportunity analysis”: finding places to improve Instacart’s funnel across different platforms.
Having a cross-platform view of Instacart’s analytics as well as the tools to organize how they viewed events was essential. Otherwise, it would have been extremely hard for Fareed to figure out where to prioritize his team’s work.
They could easily test how, for instance, putting account creation further up or further down in the flow affected conversion rates—a loose ordering. They could also test more strict, discrete sequences of events: how many Android 5.0 users went from “Check-Out” to “Account Creation” to “Confirmation,” after looking at bananas, for instance.
Fareed’s team ran through tons of possibilities, adding those that seemed like they would have the biggest impact to a shared document.
When you’re dealing with a cross-platform funnel, there are going to be a lot of these possibilities. People can first happen upon your homepage while laying in bed with their tablet, check out your inventory on their phone while waiting for a cab, but not convert until they actually end up on your desktop homepage a week later.
The reason they convert is because they had all that exposure on their other devices, but to know that you have to be aware of and track that cross-platform movement. That’s how you identify platforms where you’re struggling and need to improve.
One experiment Instacart did on desktop landing pages identified significant room for improvement. In response, they started split testing out all kinds of different page elements and flows. In the end, they improved the conversion rate on that page by 10%—a huge achievement considering they’re bringing in millions of new users every month.
You can run A/B tests without cross-platform analytics, but you won’t be able to run them in a systematic, scientific way. You won’t be able to prioritize, and more importantly, you won’t be able to properly gauge your results and see what platforms you’re succeeding or failing on.
Unify UX To Present A Core Experience
The real end goal of cross-platform analytics is consistency. Your users don’t think about cross-platform browsing or playing—they just do it—and what they want is a perfectly seamless experience.
That’s rare, unfortunately.
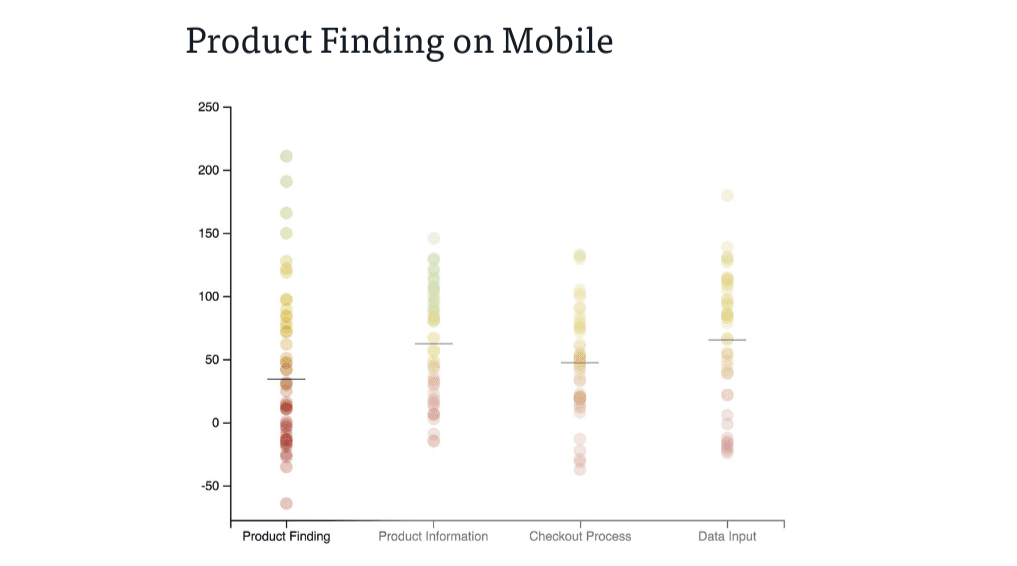
When the Baymard Institute ran a massive series of user tests on different mobile sites, they found the overwhelming majority had serious usability flaws that made the experience much worse than desktop browsing:
- They found the average product-finding experience to be mediocre.
- They found the average navigation & browsing process to be poor.
- They found that 42% of mobile e-commerce sites don’t have a homepage that lets users infer the kind of site they’re on.
- They found that 38% of mobile sites have a hierarchy of categories that is too difficult for users to navigate.
(Source: Baymard)

This chart shows the results for questions about finding products, product information, checkout, and data input on mobile. The “most usable” mobile element, users reported, was generally inputting data. Checking out and finding products, probably the two most crucial elements, were the worst.
Those kinds of UX mistakes don’t just annoy users—they have a direct effect on the bottom line. Users who get confused by a menu that’s been poorly designed or end up on a “No results found” page that offers no suggestions aren’t going to keep trying, they’re going to leave.
And while these kinds of UX improvements are important to get right on mobile, they wrote, “Many of them are actually platform agnostic.” These issues can exist on all platforms. What’s really important is not just curating an amazing experience on mobile, what’s important is maintaining consistency between platforms so your users feel like they’re having a fluid experience.
This is why cross-platform analytics is so important. While it helps you improve your store’s check-out on tablets, or on Android phones, it’ll simultaneously be helping you understand the overall core experience of your app and how it can be improved.
Providing a core experience across platforms is key to making sure that users can pick up your app, go to your website on their laptop, and pick it up again on their tablet—without them getting lost on their user journey. In short, it’s about giving them what they need to navigate the complex process that is today’s cross-platform funnel.
Without cross-platform analytics, there’s no way to explore how users are behaving across different platforms and refine the core experience of your app.
Setting Up Your Cross-Platform Mobile Analytics
To get started tracking your users across all platforms in Amplitude, check out the instructions in our documentation. All you do is add a “platform” event and keep your API key consistent across each one, which will route all of that data through Amplitude while giving you the power to separate it back out later.
Having access to all of your data in one place and being able to sort it out by platform is a massively important part of being a modern data-informed organization. It’ll drive your product decision-making, your funnel optimization, and help you build a stronger business. There’s no excuse for not doing it.

Archana Madhavan
Senior Learning Experience Designer, Amplitude
Archana is a Senior Learning Experience Designer on the Customer Education team at Amplitude. She develops educational content and courses to help Amplitude users better analyze their customer data to build better products.
More from Archana


