What Is Customer Analytics? Metrics to Track & Best Practices
Understand your customers to make better business decisions.
Customer analytics involves gathering and analyzing customer data to understand how they interact with your product. User paths have become non-linear, and it’s more important than ever to use advanced analytics to identify how different user behaviors affect business outcomes.
Key takeaways
- Customer analytics involves collecting and analyzing customer data to identify patterns in their behavior.
- Implement the insights from customer analytics to make better business decisions that’ll improve your customer experience and retention rate.
- Track different metrics across the customer journey, like the number of sign-ups and leads, new feature adoption rate, and churn rate.
- To reap the benefits of customer analytics, be selective about the metrics you track, use a single platform to integrate all your data, and test your theories before activating data insights.
What is customer analytics?
Customer analytics helps you understand customers' behaviors to make smarter business decisions. You can activate insights about user behavior to optimize different areas of your business, like product development or marketing campaigns.
The benefits of customer analytics
The more you know about your users, the more you can tailor your product and marketing to increase revenue. Customer analytics arms you with insights you can use in different ways:
- Improve your retention rate. Identify indicators of churn and solve ‘problem’ areas in the customer journey. Find out the milestones that lead to customer loyalty and encourage other customers to reach those milestones.
- Create a better customer experience. Understanding how customers use your platform will help you prioritize feature development. Use customer analytics to personalize your platform, which will improve customer satisfaction.
- Increase marketing efficiency. With customer data analytics, you can identify which customer types generate the most revenue or have the longest retention and then target your marketing accordingly. Make smarter marketing decisions based on the designs and copy that drive the highest click-through rates.
Different types of customer data to analyze

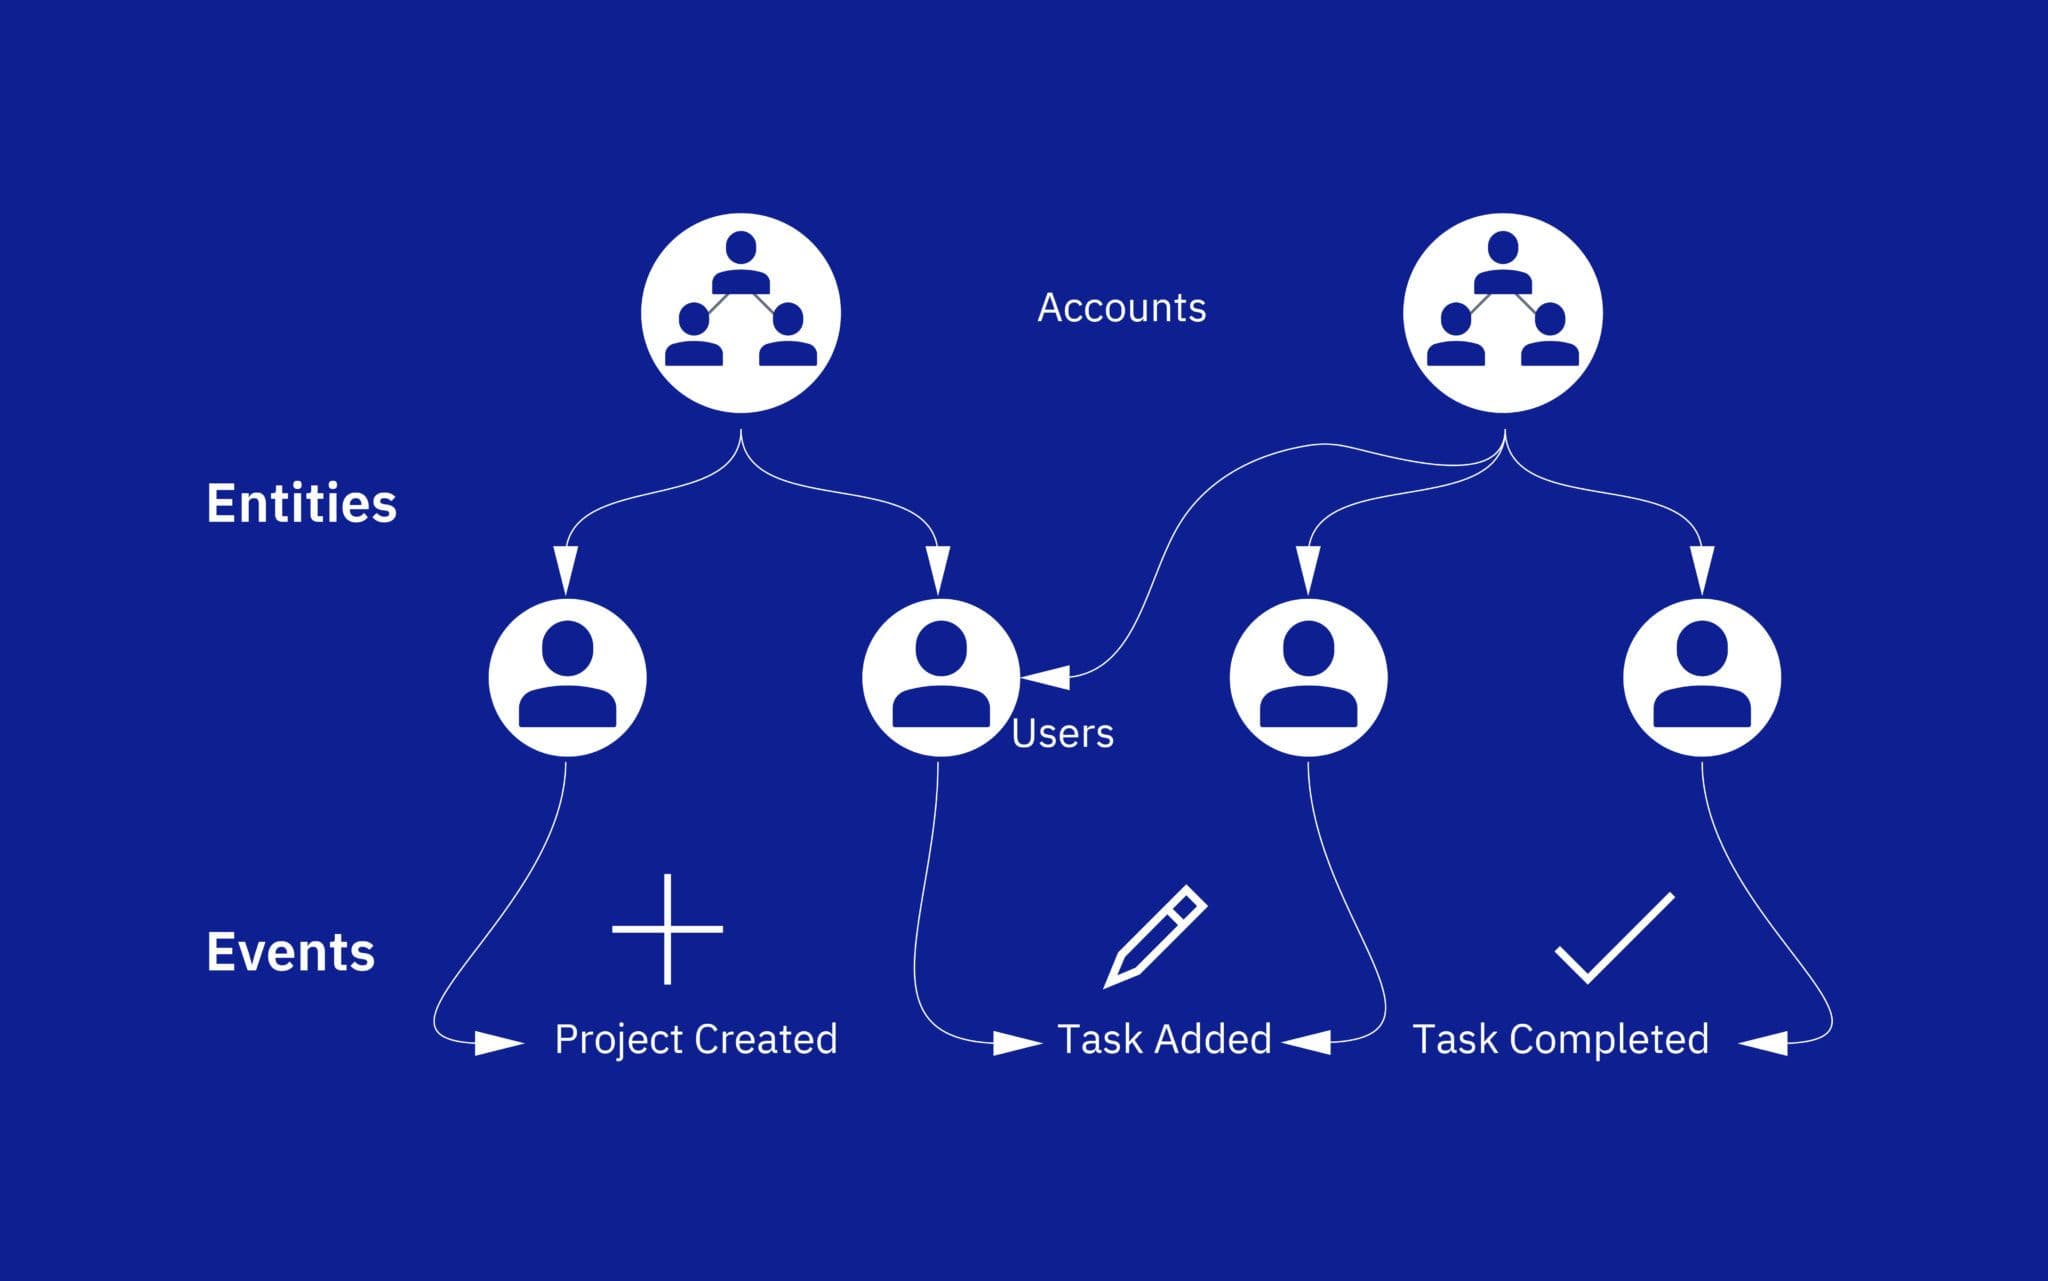
There are two main types of customer data you collect within the Amplitude platform:
- User data: Information on individual user or user group attributes, such as name, contact info, demographic info (age, location), preferences, and interests.
- Behavioral data: Information on how people use and engage with your platform—clicks, hovers, subscriptions, etc.
In this instance, ‘customers’ are platform or product users, not necessarily paying customers. For example, Instagram collects information on their ‘customers’ even though they are non-paying users.
You should combine analyses of different data types. For instance, start by looking at a cohort of users who churned after a particular time period. Then dig into more behavioral or demographic data to identify patterns or links between specific attributes and the length of customer retention.
Customer analytics metrics to track
The metrics you should focus on depend on what you want to discover about your customers. Here are examples of different behavioral metrics to track across the customer journey.
Cheat sheet: Product metrics
| Category | Metric |
| Acquisition | Number of new signups and/or qualified leads |
| Customer acquisition cost (CAC) | |
| Activation | Activation rate |
| Time to activate | |
| Free-to-paid conversions | |
| Engagement | Monthly, weekly, and/or daily active users (MAU, WAU, DAU) |
| Stickiness (DAU/MAU) | |
| Feature usage | |
| Retention | Retention rate |
| Churn rate | |
| Customer lifetime value (CLV) | |
| Monetization | Net revenue retention (NRR) |
| Monthly recurring revenue (MRR) | |
| Average revenue per user (ARPU) | |
| North Star | North Star Metric |
Customer acquisition
Track the number of leads, sign-ups, and acquisition channels to determine which marketing methods are best for attracting new customers.

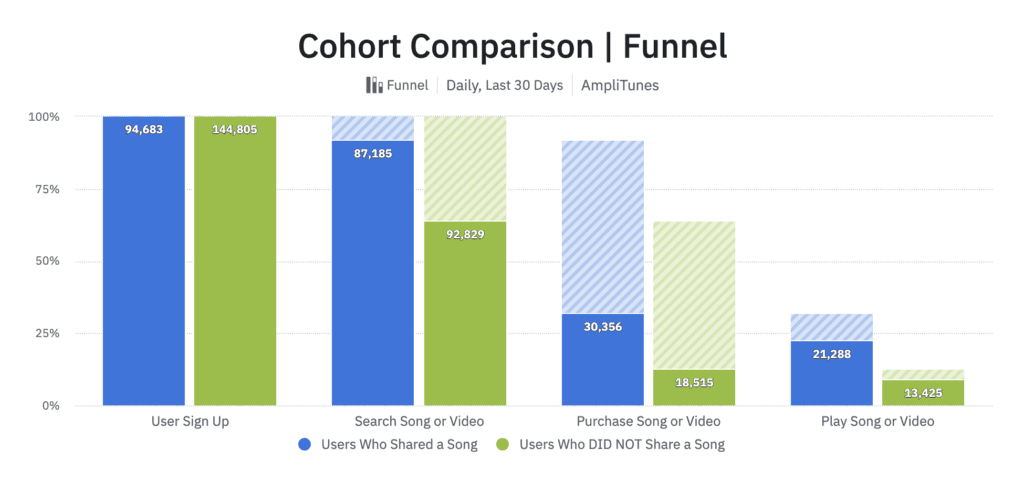
In Amplitude, you can easily set up funnels to see how users flow along a critical path in your product. This example shows a behavioral comparison for users who did and did not share a song.
Activation
Activation rate and time to activate demonstrate how well users move from acquisition through that critical “aha” moment when they discover your product’s value to them and, in turn, provide value to your business.
Engagement
Track metrics related to customer interactions — like feature usage and new feature adoption — to determine which features to prioritize. Look at clicks, interactions, and sessions per user to understand how different customers use your platform. For instance, if many people click on a specific element, you know it’s valuable or critical.
Retention
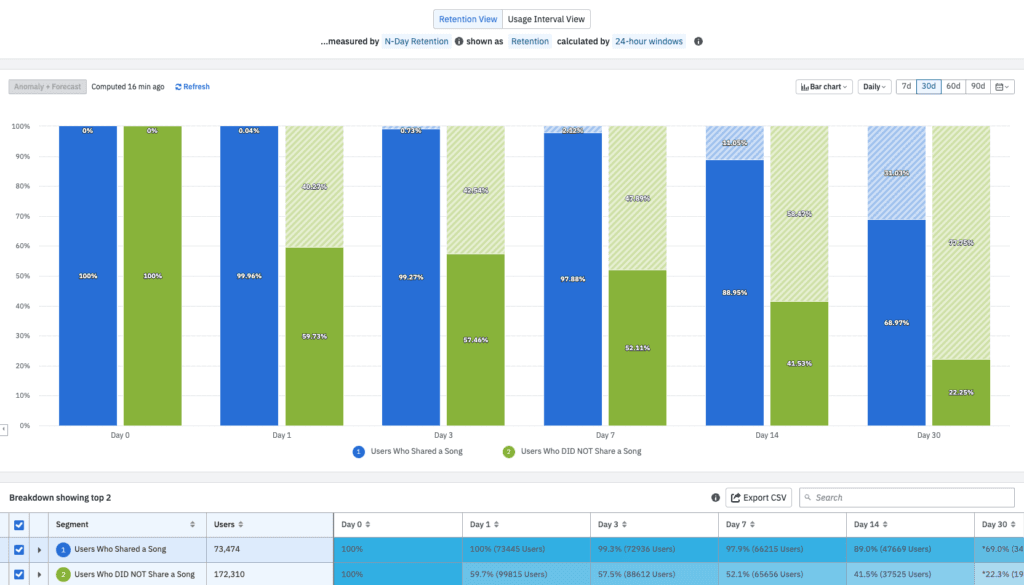
Track retention/churn rates and Customer Lifetime Value (CLV) to investigate why people stay or leave your platform. Then conduct a behavioral cohort analysis to determine which factors lead to churn or retention.

The cohort analysis chart above shows the retention rates for users who shared a song compared to those who did not. You can see that users who don’t share a song have a churn rate of 77.75% after 30 days.
Monetization
Gather user data and track monetization data points, like net revenue retention (NRR) and monthly recurring revenue (MRR), to analyze links between user behaviors and attributes and how both impact your bottom line.
You should also define and track a North Star Metric for your product. Discover your product’s North Star Metric with our comprehensive guide.
Customer analytics best practices
The metrics and data points you track depend on your organization. You should always follow the same best practices to help you get the most out of your customer analytics.
Don’t track too much data
If you track too much data, you might as well track no data. Too much data is overwhelming, and critical insights get lost. Select an outcome to decide what to track: What question do you want to answer about your customer base?
Limit what you track to avoid vanity metrics. Be selective and only choose metrics that map to a clear business outcome.
Store and track your data in a single platform
Ensure data is transparent and in a format understandable to everyone in your organization. Track data in a single self-service platform to give everyone access to the same data, which eliminates data silos and encourages cross-team collaboration. It’s easier to act on data insights quickly when you don’t need to switch platforms.
Develop and test theories
Customer analytics help you improve your product and business processes, but you must work on facts, not assumptions.
Let's say you theorize that many people drop at step three of onboarding because the process is too long and complicated. If you roll out a simplified onboarding process without testing it first, you might miss another cause for the drop-off. It’s better to gather more data and conduct A/B testing to verify your theories before rolling out your solution.
Activate your data
There’s no point in tracking metrics and conducting data analyses if you don’t use the insights to influence business outcomes. Update your product, measure the impact, and then iterate for further optimization. Amplitude’s Customer Data Platform makes it easy to implement your data insights.
Best customer analytics tools and software
These tools allow you to track and analyze different customer data points to activate your organization's insights.
Amplitude
Amplitude is consistently ranked the number one analytics tool by data-driven organizations because it:
- Is easy to use: a simple and intuitive interface makes it accessible to non-data scientists.
- Allows experimentation: create and edit different customer segments and cohorts.
- Helps with data visualization and reporting: quickly create and customize different reports with Amplitude’s templates.
- Increases data efficiency: compile and analyze data from different sources and implement it using a single platform.
Amplitude also provides predictive analytics using machine learning that makes accurate predictions about how customers will behave in the future.
Other customer analytics tools
Better understand your customer analytics today
Customer analytics is critical to understanding your customers' behaviors so you can make smarter business decisions, but be selective in the metrics you track.
To determine the best metrics for your business, check out The Amplitude Guide to Product Metrics, which includes the top 15 to track for user acquisition, activation, engagement, retention, and monetization.

Darshil Gandhi
Director, Product Marketing, Amplitude
Darshil Gandhi is a Director of Product Marketing at Amplitude. He leads global technical and partner product marketing, collaborates with product and go-to-market teams on strategy, positioning, messaging, campaigns, and enablement. He was previously a solutions consulting team principal at Amplitude, and has helped dozens of Amplitude customers turn their data into actionable insights. Darshil graduated from Dartmouth College with a Masters in Engineering Management.
More from Darshil


