How Data Access Unlocks Your Company’s Potential
Read how data accessibility within a company reduces bottlenecks while creating a decision-making culture based on data-driven insights.
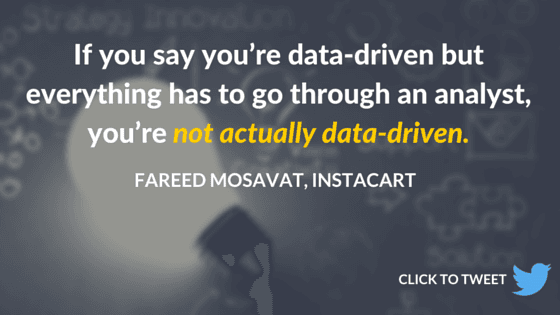
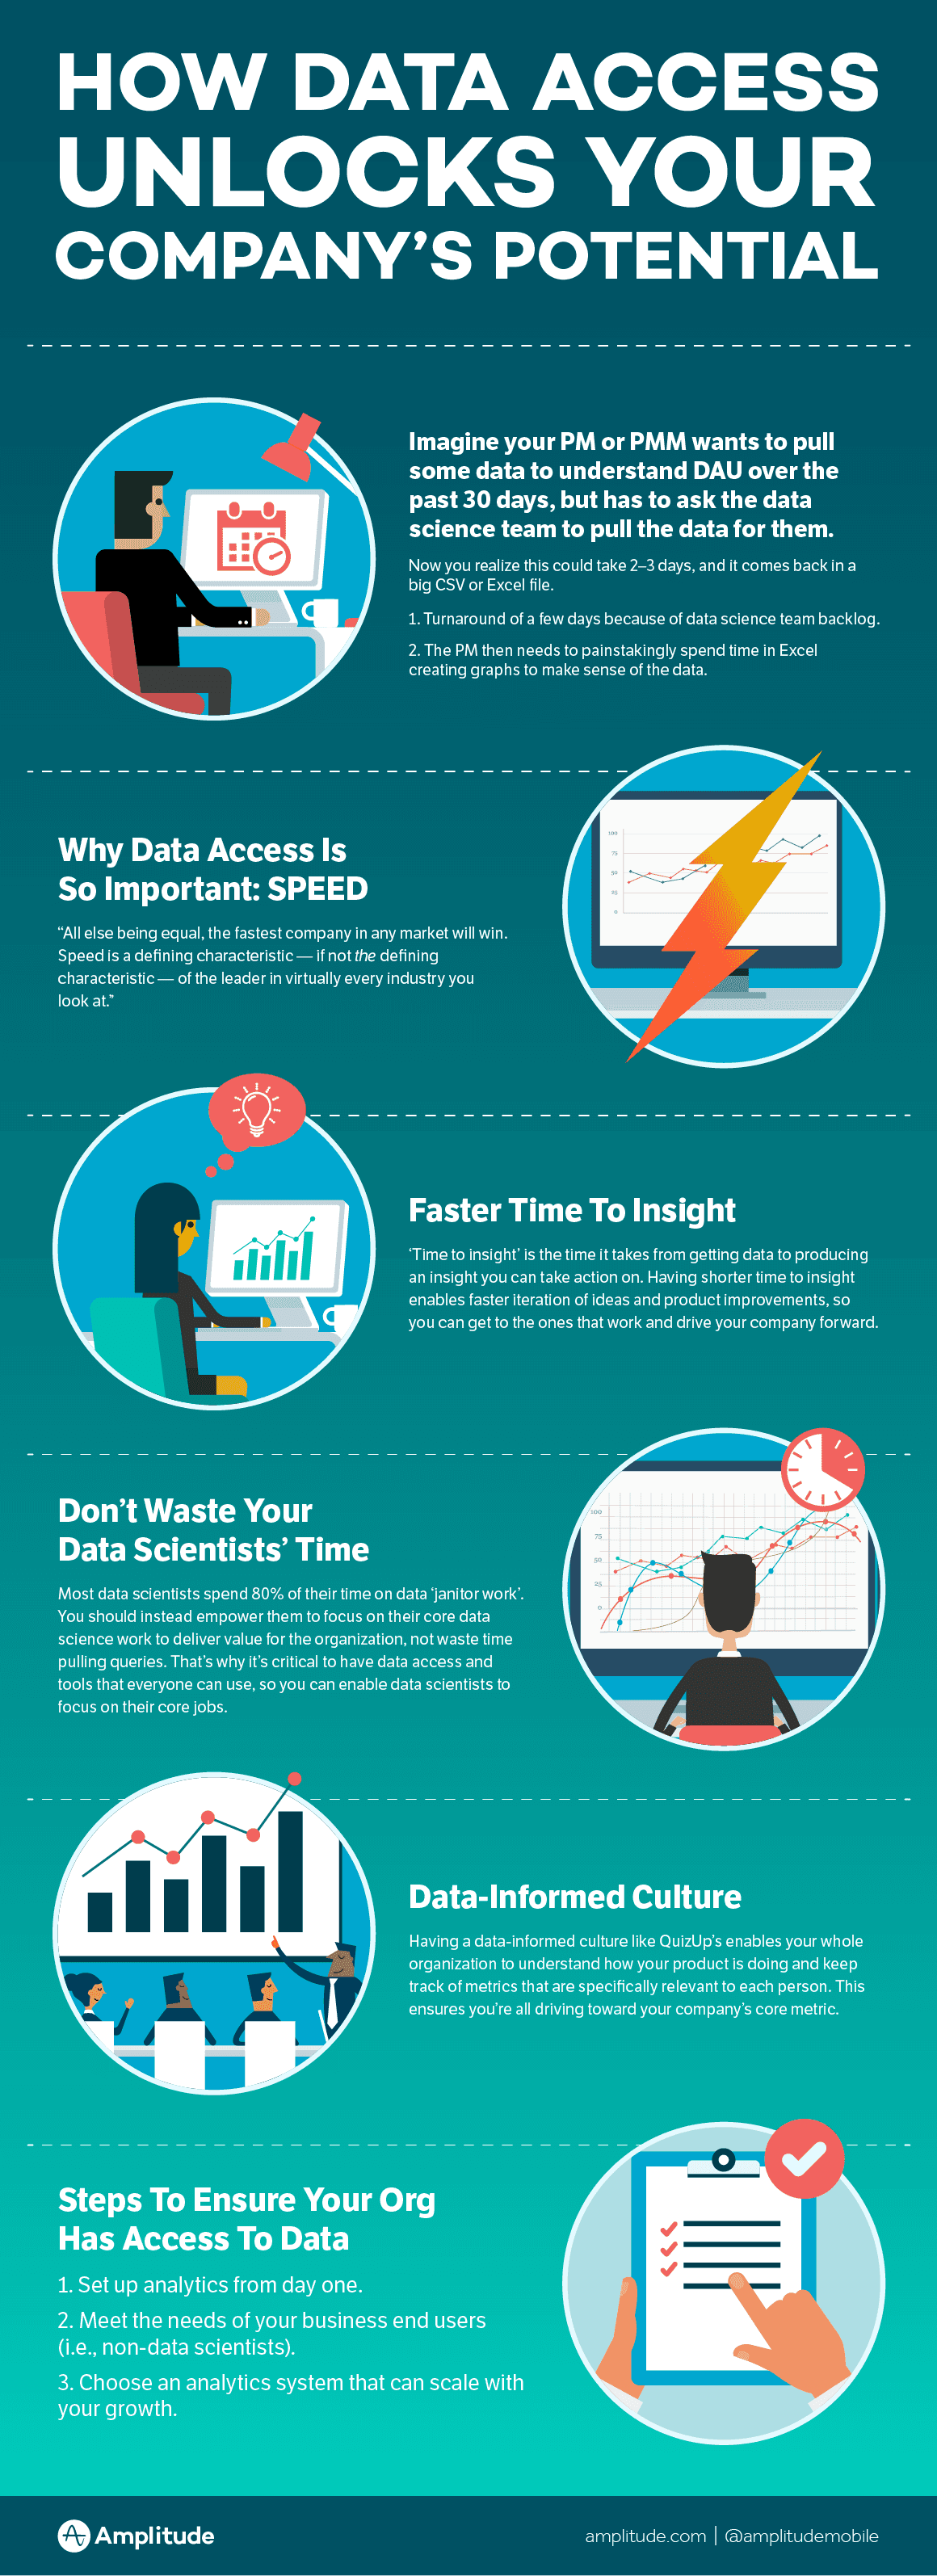
Imagine you’re a member of the growth team of a promising (as all Silicon Valley startups are) social media app. It’s a late evening in SoMa. You have your email open. You keep hitting ‘Refresh,’ waiting for the one piece of information you need to finish your presentation to your CEO tomorrow. You want to know something seemingly straightforward: How many daily active users did the app have over the past 6 months in San Francisco versus San Jose? You asked the data science team for this information 3 days ago; they promised to get that information to you EOD. When the data finally does come in (indeed minutes before midnight), it’s rows and rows of numbers in a huge Excel spreadsheet, which you’ll be spending the next several hours turning into graphs to make sense of it. This, despite popular belief, is _not _how data-informed companies function. Fareed Mosavat, Consumer Growth Product Manager of the popular grocery delivery app Instacart puts it best: “If you say you’re data-driven but everything has to go through an analyst, you’re not actually data-driven.” We’ve mentioned before that data accessibility is one of the core tenets of being data-informed. In a company with a pervasive data culture, everyone has direct access to user data and can answer their own analytics questions. No more back and forth or bottlenecks to deal with. Instead of bugging the data science team, you’d be able to get the information you need yourself, in seconds. In that sense, data accessibility truly unlocks your org’s potential. It allows you to:

- Move quickly.
- Focus on the product.
- Build a data-informed culture.

Data access lets you move faster.
Dave Girouard, CEO of personal finance startup Upstart, says speed is what separates a company that is successful in its industry from one that isn’t. “All else being equal, the fastest company in any market will win,” says Girouard in his First Round article. “Speed is a defining characteristic — if not the defining characteristic — of the leader in virtually every industry you look at. You can either set the pace of the market or be the one to react. Whoever is fastest out of the gate is the one everyone else has to react to.” What’s the key to agile product development? Understanding what your data is telling you, fast. [Tweet “All else being equal, the fastest company in any market will win”]
Decrease time to insight
You know you need to be the one setting the pace of the market, but how do you make sure you’re also moving in a direction that leads to growth? Look at the data, figure out what your users want, and make sure you deliver on it. The challenge is being able to make sense of what your data is telling you–i.e. finding an insight–as quickly as possible. A _data insight_ is an “interpretation of data which has value and enables a business decision.” In iterating and improving your product, the cycle goes from data insight, to making a product change or doing an experiment, to looking at the data again, getting more insights, and iterating ad infinitum. How fast you can move through this cycle determines how you improve your product and drive growth. In most cases, the rate-limiting step in this cycle is the time it takes you to get from raw data to actionable data insights.
Don’t waste your data scientists’ time
If you had to go through a data scientist to answer your analytics question, the process might go something like this: Submit a question, wait (days or weeks as they go through their backlog of queries), get your answers back, think about the result, realize you need to investigate something else, submit your request again, wait… etc. etc. This is weeks of time wasted due to inefficiency when you could be building a better product. True data accessibility means removing the data scientist bottleneck so you can expedite the time it takes to get to your insights. **If you had both the ability to access the data you need, as well as manipulate, visualize, and interpret it without the knowledge of a programming language, you can cut down days, even weeks, from your time to insight. ** Data scientists, in turn, won’t be swamped with a backlog of queries from other teams. They’ll actually be able to do their job, which often requires advanced knowledge of mathematics, machine learning, and software engineering, instead of just pulling data for others or doing janitor work. If you can access the data you need to answer the questions you care about, _without _needing to go through a data scientist, you get your data insights faster, you make product decisions faster, and the cycle of iteration gets tighter. And the faster you get a better version of your product out, the more overall velocity and traction your company gets within your industry. You’re on your way to success.
Data access lets you focus on the product.
It’s easy and relatively cheap to dump billions of data points in Hadoop or even Redshift, but if you want that data to be accessible to your product or marketing team, it’s not so simple. Building an in-house data infrastructure that everyone, company-wide, can access and use to derive insights is actually incredibly difficult and expensive. And there’s a lot more time and money involved to put into place good visualization, exploration, and dashboarding solutions on top of that. This is an incredible amount of resources siphoned away from product and dedicated to reinventing the wheel. One of the main reasons so many organizations decide to invest in an out-of-the-box analytics solution is because those services have already done the hard work for you. The best analytics platforms allow teams throughout the company to utilize simple, intuitive UIs to tap into their data, while complementing data scientists’ more complex analyses. These analytics solutions have turned lines of code and difficult algorithms into button clicks that anyone in the company can understand. Investing in a third-party analytics platform means data self-service–which means considerably _more _time and money can go toward improving and iterating on your actual product. [Tweet “Investing in a third-party #analytics platform means #data self-service”] Instacart’s Fareed Mosavat decided to buy an analytics platform because he didn’t want to take time away from working on Instacart’s product. “I’m much more interested in solving the core product problems than building technical infrastructure for analytics,” he said. Members of Instacart’s growth team can independently make well-informed product decisions, backed by user behavior data they were able to get from Amplitude, their analytics provider. By running multiple iterative experiments based on their user data (remember, speed!), Fareed and his team were able to achieve a 10% increase in landing page conversion within a few months.
Data access contributes to a data-informed culture.
It’s the natural progression of things: with company-wide data accessibility, more people can look at the data, get insights quicker, and thus inform product decisions on a tight timeline. Rinse and repeat. Just the fact that data is accessible to everyone makes it a more pervasive and critical component of decision-making. With each subsequent iteration of the decision-making cycle, the company will drive toward a more data-informed culture. One of our main goals at Amplitude is to help companies be more data-informed by allowing everyone–from the analytics newbie to the data scientist–to access their data and understand user behavior trends. At QuizUp, for example, almost every team uses analytics; making data accessible to these end users was a key solution they were looking for in an analytics platform. According to Jon Edvald, Head of Data Science of the popular mobile trivia app, the team was looking for “easy to use tools so that everybody at the company can actually get at data without having to request it from the analytics team.” “Almost every team at the company uses Amplitude to some extent,” says Jon. “Our product managers use it a lot, but even our community managers, our managers, and our C-level executives use Amplitude to get a sense of how the community is growing and keep track of metrics that are specifically relevant to them.” It wasn’t long before they discovered their own product insights using Amplitude’s dashboards. As for the data scientists? Through Amplitude, they get direct SQL access to the raw data via Amazon Redshift, so their insights team can do the really complex analyses without spending any of their own time on data clean up.
How to make sure your org has good data access.
Data accessibility for the whole company is critical to making product decisions quickly, allowing you to focus on building the best product you can build, and overall cultivating a data-informed workplace. What steps do you need to put into place to make sure everyone in your company has access to the data they need? Here are a few things you check off immediately.

- Set up analytics from Day 1. You never want to be guessing at what your users are doing. Set up your tracking before your product launches — even if you don’t have time to really dig into it yet, you’ll want that data later.
- Choose an analytics solution that can ****scale with your growth**. **Think of your analytics provider as a long-term investment. You don’t want to pick a tool that you’ll outgrow and won’t meet your needs in a year or two.
- **Audit your current or potential end users. **Ask if they can:
- Easily create and share dashboards?
- Answer analytics questions without programming or query language?
- Easily access the raw data if they need to?
Understanding why data access is so critical for a company and using the checklist above, you’ll be well on step further into making your company truly data-informed. We’ll be talking more about the importance of analytics and data-driven decision-making for your whole company in future articles, so be sure to stay tuned.


Alicia Shiu
Former Growth Product Manager, Amplitude
Alicia is a former Growth Product Manager at Amplitude, where she worked on projects and experiments spanning top of funnel, website optimization, and the new user experience. Prior to Amplitude, she worked on biomedical & neuroscience research (running very different experiments) at Stanford.
More from Alicia


