The Secret To Unleashing Data-Driven Creativity
Is data exciting? – Yes. Is data creative? – What? Most data-driven teams don’t think about data in this sense, but in the right hands, data is like the sculptor’s marble, and can show you how to create something new. Learn how to find your one metric that matters and build something creative out of it.
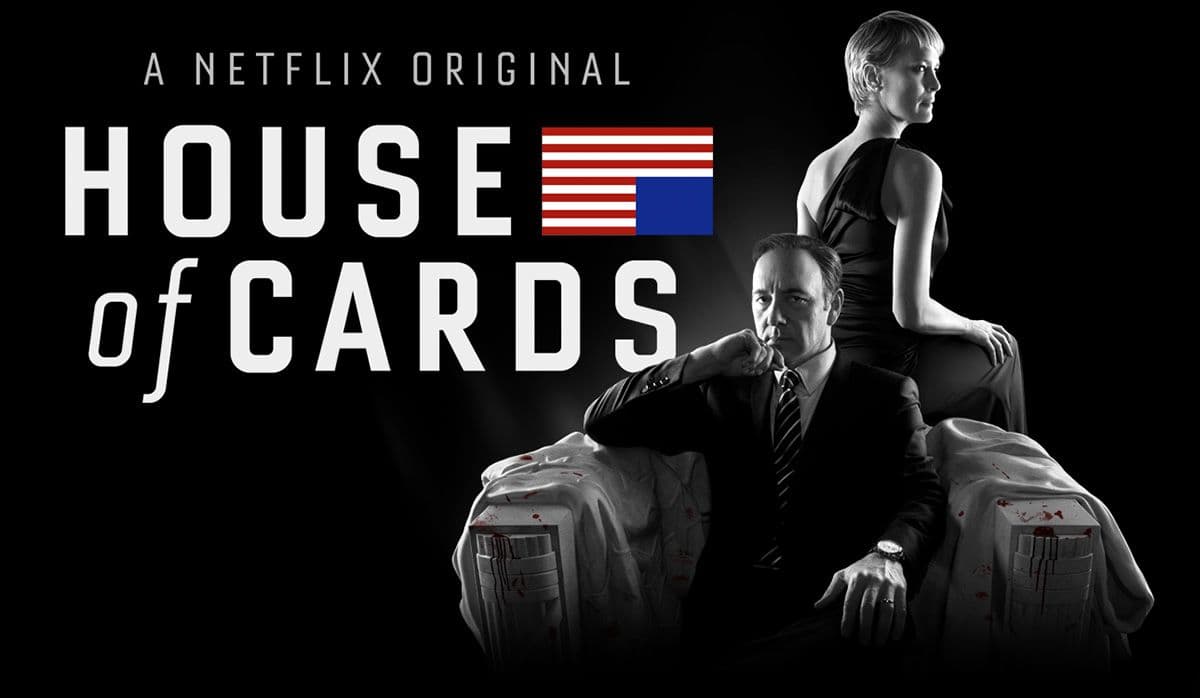
Ask your average startup team whether data is exciting, and you’re likely to hear some enthusiastic “Yes!” votes. But ask that same team whether data is creative, and you’re likely to get a bunch of confused looks. This is the conventional view of data: capable of exposing us to exciting insights, maybe, but not actually creative—not generative. But that view couldn’t be further from the truth. Metrics are like a sculptor’s marble when put in the hands of a truly data-driven team: they’re raw materials from which something new can be created. [Tweet “#Metrics are raw materials from which something new can be created.”] One of the crowning achievements of modern television, in fact, was the brainchild of one of the most heralded analytics teams in the world: Netflix. When Netflix was pitched House of Cards, they used the incredible amount of information they had on viewers’ usage patterns to understand whether they should pull the trigger. And what they saw almost guaranteed the show’s success. Research demonstrated a significant overlap between three different groups of Netflix users:_ _

- Fans of the original BBC miniseries House of Cards, produced_ _in 1990
- Fans of director David Fincher, who was involved with the project from the beginning
- Fans of Kevin Spacey, who was Fincher’s first choice for the lead role
When the production company behind the idea pitched Netflix, they expected to hear the same lackadaisical reaction they got from every one of the major studios they’d approached: “Maybe. Make a pilot.” But Netflix didn’t say that—they plunked down $100,000,000 and committed to 2 years of the show without seeing a single minute of footage. Netflix’s success with _House of Cards _proves not just how data can help you be more creative, but how creativity is essential to analytics. It’s about using your raw materials (data) to create or uncover something new. To do that, you first have to find your one metric that matters.
Find Your One Metric That Matters
Your One Metric That Matters is the key metric around which you focus your team’s efforts. It should be a figure that’s directly related to the long-term success of your business model, because then the OMTM will allow everyone on the team to understand where their efforts fit. The one metric that Netflix cares most about is “value hours,” a modified variant of “hours watched.” Under the value-hours metric, users who watch all kinds of content are less compelling than those who pay for a Netflix subscription and only ever watch one or two different shows. If you subscribed to Netflix just because you heard about House of Cards, then you’re a very valuable statistic to their data team. You’re driven to pay them every month on the strength of one show. What they’re trying to figure out is what pieces of content are the most efficient at bringing users in and retaining them—where they get the most bang for their buck. In other words, they’re aiming to create content so good that people will pay for a Netflix subscription just to watch it. Quality is obviously critical to a service where people spend 99% of their time watching movies and TV shows, but the overriding point applies to all OMTMs. **Track the means by which you can increase the amount of value your users get out of your product, optimize for that, and you’ll incentivize yourself to build a stronger business. **
How to find your own OMTM
Here’s a four-step process for figuring out the one metric that matters for your business, adapted from Greylock’s Josh Elman and his Ladder of Engagement:
- **Find your core value: **What is the actual purpose of your product? Your answer shouldn’t be about your gut feeling: it should be based on actual usage. The simplest way to figure it out is by finding your most engaged users and comparing that cohort’s behavior with others: what are they doing differently?
- **Determine how that core value is found: **Your app’s most engaged users are important: they’re finding value that others aren’t. What you have to do is create more of those users. Use your engaged cohort and analyze their earliest activities to identify the behaviors that got them there.
- **Build a habit around that core value: **Once you know where and how users find value in your product, you have to encourage more users to do so. Compare the conversion funnels of different cohorts with tools like Pathfinder to understand the levers you might pull to bring more people to your core value.
- **Determine your OMTM: ** After you’ve figured out your app’s core value and how your users find it, your OMTM is simply whatever behavior best fulfills the goal of creating more core value for more users._ _
Facebook’s core value, at least early on, was the prospect of finding and interacting online with _a large number of _your friends. When people hit the threshold of 7 friends in their first 10 days on Facebook, they were much more likely to engage with the platform in the long run. Less than that, and they were churn risks. They cultivated an obsessive, team-wide focus on hitting that metric—and the rest is history. Once you understand how people discover your app’s core value, even if it’s just a small group of power users, you need to start optimizing for whatever they did differently. To do that, you’ll run all kinds of experiments—A/B testing your funnel, reactivation notifications—all under the auspices of that OMTM.
Experiment To Optimize For Your OMTM
When we talk about creativity, what we’re really talking about is experimenting with different ways of optimizing for your OMTM. [Tweet “Experiment with different ways of optimizing for your #OMTM.”] When Netflix signed the _House of Cards _contract, they’d already pored through data on millions of users and millions of hours of viewing. Within those hours, they had records of billions of crucial user “events” they could analyze in order to help them better deliver value:
- when people paused movies
- when they fast-forwarded
- when they stopped watching
- when they picked it back up
They were watching when you dropped that hot new show in the middle of the pilot episode, and they were watching with interest as you proceeded to spend an entire weekend binging on _Gilmore Girls. _Why? _ _ Let’s say you pay for Netflix but do absolutely nothing with your monthly subscription but watch the occasional episode of Lilyhammer. That would be very interesting to Netflix. It suggests that Lilyhammer is single-handedly capable of retaining a specific kind of subscriber. It’s “efficient content.” This was the essence of the _House of Cards _experiment. Netflix knew that three cohorts—Kevin Spacey fans, David Fincher fans, and 1990’s _House of Cards fans—behaved in ways that constantly overlapped. They watched similar movies, gave them similar ratings, and generally behaved more like one another than other groups of users. That told them that House of Cards, _which incorporated all three elements, was in some intangible sense a **perfect idea. **No one else had access to this kind of information. That meant that instead of paying a huge amount to license the show from a network, they could use their “unfair advantage” and capitalize on this convergence of interests themselves. If they brought in enough new subscribers to pay for the show’s production, it would be a success. They would have answered the question—“Can we create more cost-effective content if we do it ourselves instead of working with traditional gate-keepers?” To plan out your own OMTM experiments, you have to devise your own questions.
You need a question before you can analyze anything
It’s tempting to collect every bit of information you can possibly get from your users, but it’s also counter-productive. Anthony Bastardi and Eldar Shafir’s landmark study “On the Pursuit and Misuse of Useless Information” argues that we tend to be really bad at assessing how much information we need to make informed decisions. So come up with a question to which you want to find the answer. Your only criteria should be that a positive outcome from the experiment boosts your OMTM and improves your company’s viability:
- Can we improve the speed of our hiring process by involving fewer people internally?
- Could we work more efficiently by hiring contractors to complete discrete tasks that don’t require our expertise?
- Would our seven-day retention numbers improve if we made our onboarding flow take longer?
Then you start formulating your experiments. With a specific question in mind, and the outcome of the experiment linked to the key drivers of your business model’s success, what you’ll really be doing is iterating and improving on what matters most to your business.
Creativity is Essential To Analytics
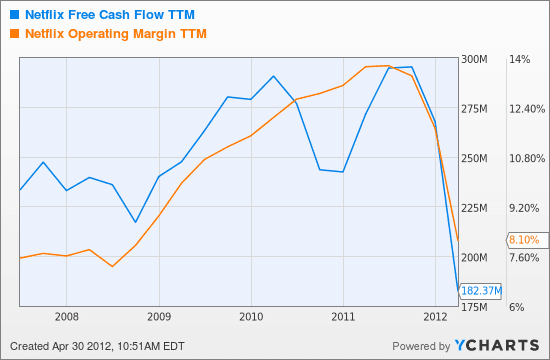
Your OMTM and the experiments you run won’t stay the same forever. Facebook’s OMTM, needless to say, is no longer “7 friends in 10 days.” But your OMTM doesn’t change by chance. It changes because you’re relentless and creative in how you optimize for it. Around 2013, Netflix had no choice but to get creative. Traditional content creators had finally realized the incredible leverage they had over Netflix, they’d raised their prices, and Netflix’s margins were in a death spiral: It simply cost Netflix too much to bring in and keep new subscribers. With House of Cards, they were betting they could bring costs down and increase the value of a Netflix subscription if they started producing high-quality, exclusive content themselves. _ _ Years later, it’s a strategy that’s clearly paid off. If you only look at the “prestige economy,” then Netflix has clearly made a name for itself as a content creator: their 34 Emmy nominations in 2015 were a record. On the unit economics level, though, _House of Cards _and the shows that followed likely saved the business: they’re among the most efficient pieces of content on the entire site.

The creative force as survival instinct
**The thing that most people don’t realize is that creativity is inherent to a truly data-driven company. ** When your team focuses all their efforts on one metric, it actually generates the experimental conditions you need to get creative. Netflix knew that their overriding goal as a company was to optimize for the kind of valuable (“efficient”) content that brought users in and kept them subscribed. In that context, _House of Cards _became just another experiment they could run. [Tweet “Creativity is inherent to a truly #data-driven company”] When you don’t have key metrics to aim for, then everything you do as a company is based off intuition, off gut, off arbitrary instincts. You can optimize for this variable and that variable, but none of it exists in a larger context—you’re just turning levers at random to see what happens. To really get creative, you need to know what you’re measuring and why. You need your One Metric That Matters, and then you need to use that metric to rally your team. Enforce focus and discipline with your data, and you’ll start to reap the fruits of creativity at your business. For startups that need to constantly innovate if they want to succeed, it’s practically a survival instinct.
Comments
Gavin Stewart: Blog related data driven creativity is very helpful in business. Thanks for sharing this post!!

Archana Madhavan
Senior Learning Experience Designer, Amplitude
Archana is a Senior Learning Experience Designer on the Customer Education team at Amplitude. She develops educational content and courses to help Amplitude users better analyze their customer data to build better products.
More from Archana


