Retention as Your Growth Engine Part 2: Drive Engagement and Stickiness
Great product teams don’t leave retention up to chance. Learn how to drive user engagement and product stickiness in a few simple steps with Amplitude.
This is part two of a three-part series on Retention as Your Growth Engine. Part one covers how to understand new user activation, and part three covers how to re-engage dormant users.
To improve retention, you need to understand why people use your product in the first place. Analyzing user engagement helps you learn which features keep users coming back. With these insights, you will make smarter product development and improvement decisions.
By prioritizing the features your users love most, you’ll create a stickier product to retain new and existing customers over time. Let’s walk through how to use Amplitude to drive user engagement.
Key takeaways
- Find out which features your users engage with most to learn how users get value from your product.
- Group users into behavioral cohorts based on how often they’ve adopted a specific feature and how that affects engagement and retention.
- Retention analysis enables you to identify power users and the features they use most, so you can discover how your product appeals to your most engaged users.
Discover what users love with the feature engagement matrix
To develop a better understanding of the high-level patterns of feature engagement in your product, you first need to assess how many users engage with your product features and how often.
Let’s return to our previous example where I’m a product manager for AmpliTunes, an online music streaming service. With Amplitude’s Engagement Matrix, we can see how many users engage with each feature in our product and how often.
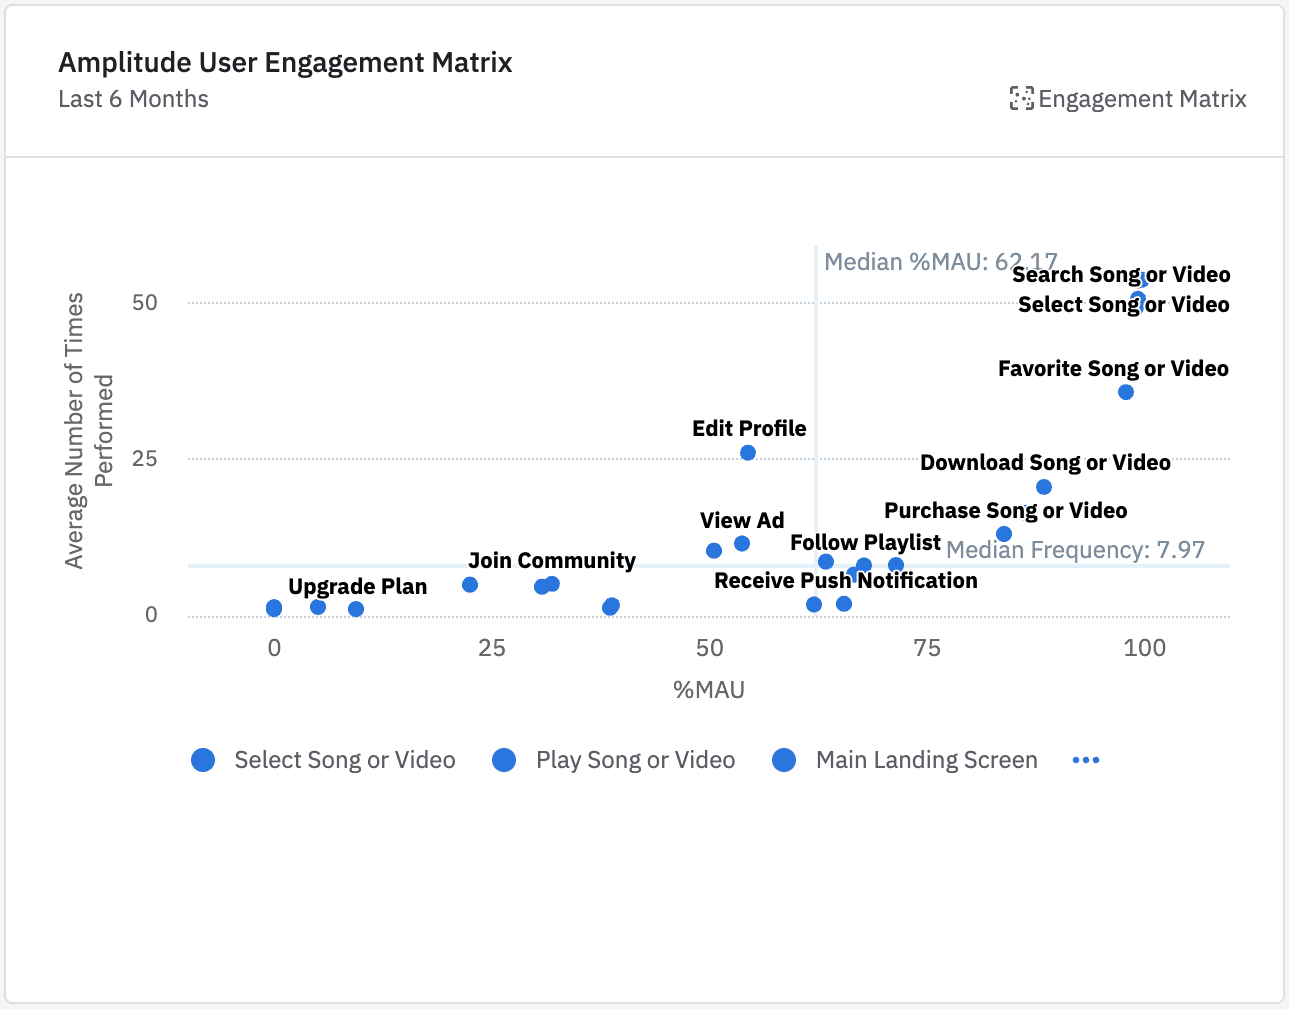
This example displays user engagement based on how often each feature is used and how many monthly active users engage with the feature.
The top right shows our most popular features—the events performed with high frequency by a high number of users. In AmpliTunes, these features include:
- Search song or video
- Select song or video
- Favorite song or video
- Download song or video
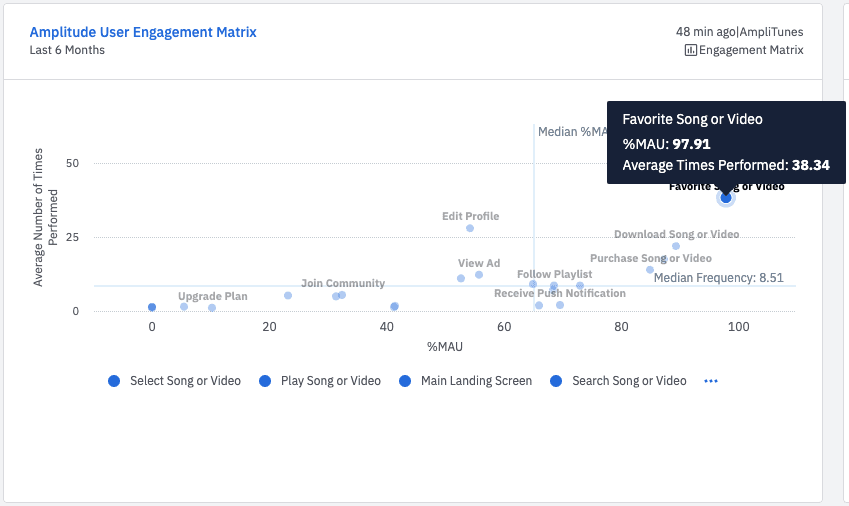
The call-out box shows that 97.91% of monthly active users favorited a song or video an average of 38 times in the past six months.
As we can see above, over 97% of monthly active users engage with the “Favorite song or video” feature. It would be interesting to understand whether the frequency with which they favorite a song has an impact on the overall user retention rate. Based on this insight, we might consider more ways for them to engage—for example, by generating a custom playlist after a user favorites a song.
Understand usage behaviors with historical counts
Now that we’ve determined our most popular features, let’s dive into the feature usage patterns. This may reveal different retention rates between users who engaged with a feature once and users who engaged with that same feature for the 3rd, 4th or even 5th time.
Measuring user behavior across different historical usage patterns can help you achieve a deeper level of understanding when you’re investigating why your users are retaining, converting, or engaging—or why they’re failing to do that.
We can use the historical count feature in the Event Segmentation chart to measure how frequently a user engages with our features and use those segments of users to measure how frequency impacts retention.
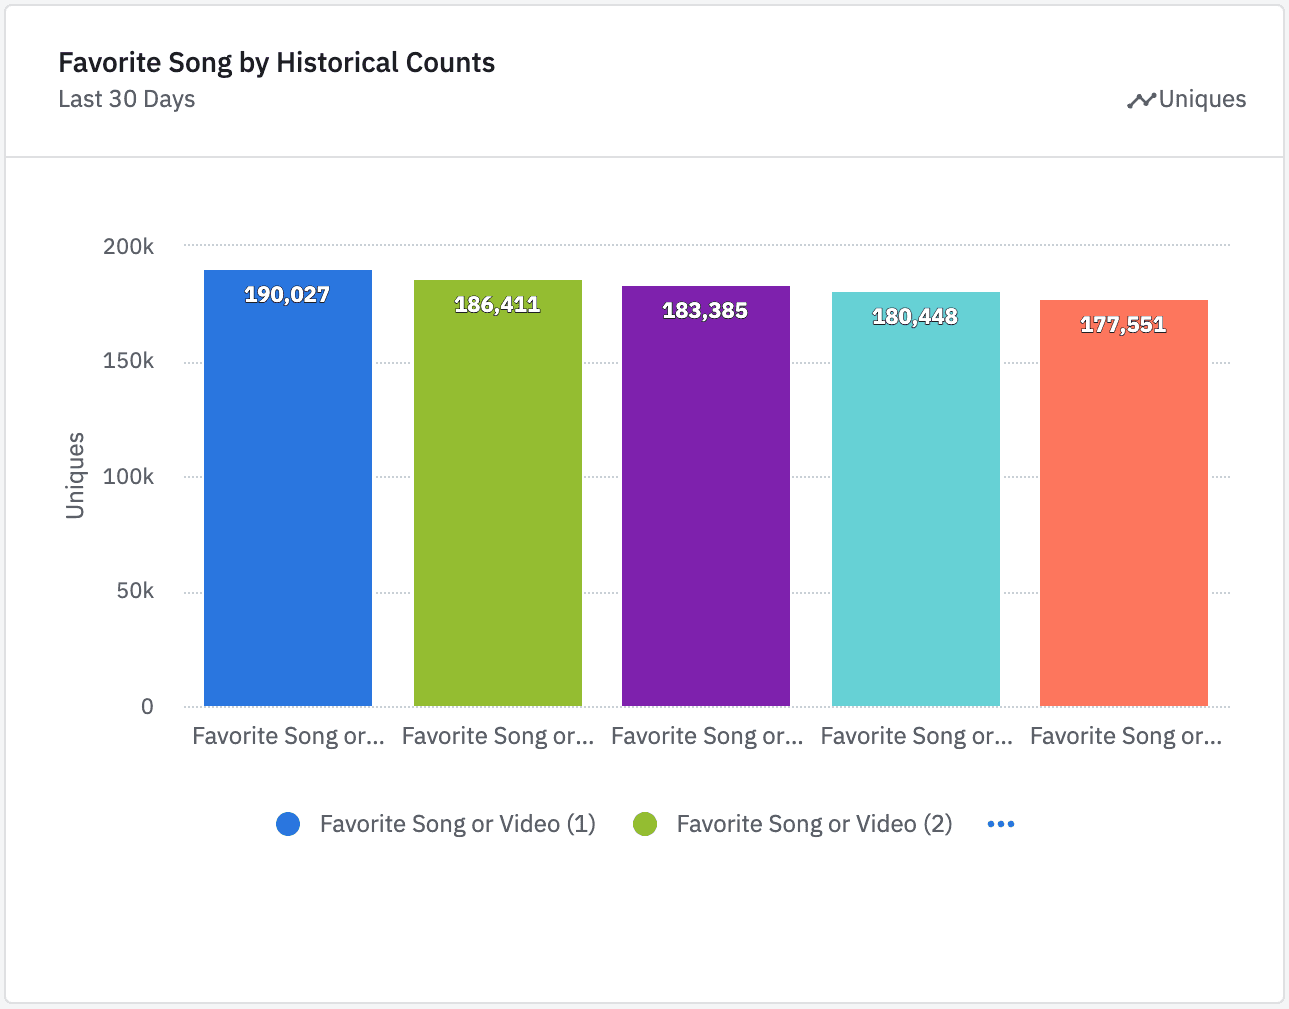
This example shows how many users have favorited a song or a video for the 1st, 2nd, 3rd, 4th, or 5th time.
We can also group users into behavioral cohorts based on how many times they’ve adopted a feature. By saving these behavioral cohorts in Amplitude, we can use this data to determine if feature adoption affects other outcomes, like user retention.
Use retention analysis to identify power users
To build better engagement strategies, you need to know why users return to your product in the first place. By identifying power users and which features they use most, you’ll learn what makes your product appealing to your most engaged users.
Amplitude’s Retention Analysis shows us how often users come back to the product after taking a specific action, like favoriting a song. We can use the behavioral cohorts we created with historical counts to identify the most engaged users.
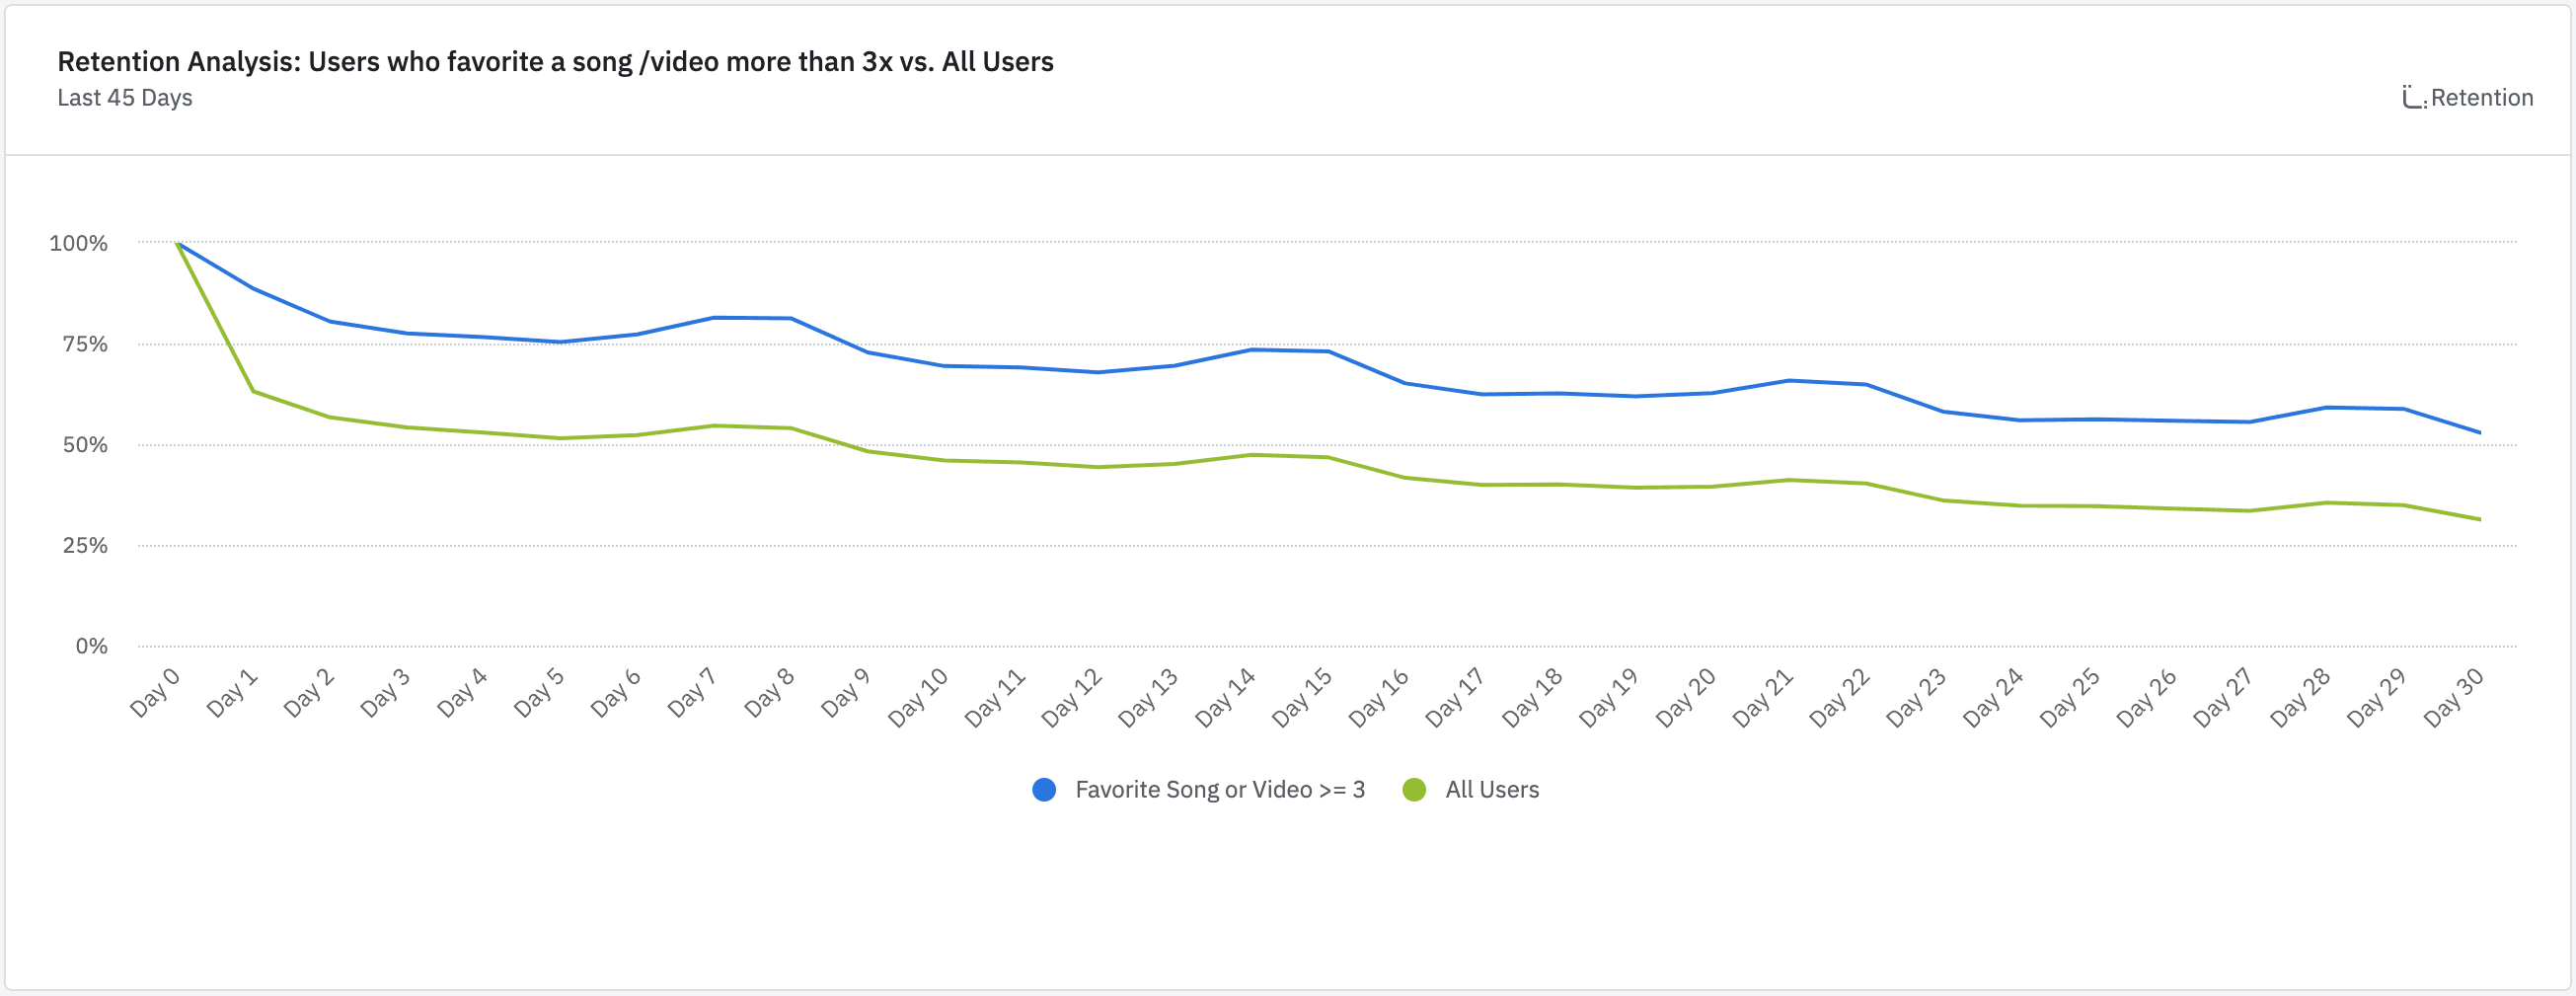
This graph shows that the retention rate for users who favorite a song more than three times is consistently higher than that of all users.
At AmpliTunes, we compared users who favorite a song more than three times with all users. The result? Power users who favorite a song more than three times have much higher retention than those who don’t.
Based on this information, we learned that favoriting songs possibly leads to higher retention. To test our hypothesis, we can prompt users to favorite songs and see if this improves retention across all users.
Discover real-world examples of user engagement
Here are some companies that improved retention after analyzing user engagement:
Showcase IDX
The product team at Showcase IDX, a leading IDX WordPress plugin for real estate, discovered a considerable drop in users saving searches after a UI redesign. In Amplitude, they learned that not everyone who previously clicked “save search” wanted to use that feature. Meanwhile, the users who wanted to save a search couldn’t find the button anymore.
After redesigning the UI based on insights from Amplitude, Showcase IDX saw a 20 to 25% improvement in retention. Plus, conversions more than doubled because users who actually wanted to click “save search” completed that action.
Walkie-talkie
When the team at the social audio app Walkie-talkie launched a new onboarding process, they pushed new users to connect with their friends on private “frequencies.” But retention analysis in Amplitude showed that the highest retention rate after 30 days was among users who engaged with public frequencies, not private ones.
After shifting the onboarding focus to public frequencies, Walkie-talkie saw their 30-day retention rate increase from just under 8% to over 20%. Without these insights from Amplitude, the product team would likely have continued building on inaccurate assumptions about how users preferred to use their product.
Boost retention across your entire product
To improve the retention of new and existing users, you’ll also want to work to understand new user activation (part one) and re-engage dormant users (part three) to prevent churn. Learn more in our Mastering Retention Playbook.

Bethany Mangan
Senior Solutions Engineer, Amplitude
Bethany Mangan is a senior solutions engineer helping corporate businesses bring power to their products. She has a background in economics and data science and is passionate about helping teams build a data-driven culture.
More from Bethany
