Start Telling Stories about Your Data with Notebooks
Notebooks helps you easily communicate the full context behind complex analyses, A/B tests, and product launches with your whole team.
We have a running joke on the product development team: “If a chart falls in the woods and there’s no one around to analyze it, does it make an insight?”
Our answer is no.
We believe that a healthy data culture is not merely defined by data access. In a healthy data culture, people can use data and have conversations about it all the time—and that means having a good way to share and collaborate on insights.
Notebooks are available to all organizations on the Growth, Enterprise, and Scholarship plans.
Why your data needs context within a story
Data access by itself isn’t valuable; the information you get from that data and, ultimately, the decisions that you make are. That’s why the best data-informed organizations consider data storytelling a best practice format to share learnings and prompt discussion.
To really broadcast the learnings of your analyses and get buy-in for changes you want to implement, you need to be able to tell a good story with your data.
A good data story should:
- Provide background information. What observations prompted doing this analysis or running this experiment in the first place?
- Explain any risks or assumptions.
- Define relevant events, event properties, and user properties.
- Explain the set up of the experiment or analysis, including what users you were looking at and in which time frame.
- Include relevant charts and highlight key takeaways for each chart.
- End with a summary of the full story and a few potential next steps.
Our data-savvy customers who already used data storytelling with their teams faced a key challenge: the context they shared around their analyses all lived outside of Amplitude, in Slack, a slide presentation, lengthy email threads, or Confluence.
Having information fragmented in multiple locations like this was a major pain point. While the data in Amplitude was self-service, the lessons learned from the data weren’t. This meant that project stakeholders had to wait for presentations from their analysts to get the full picture or, worse, waste time going back and forth with them one-on-one to get clarification.
That’s why we built Notebooks.
Share the meaning behind your Amplitude analyses with Notebooks
Notebooks is a storytelling format for sharing analyses in Amplitude. Anyone can create a Notebook right in Amplitude and embed charts directly into them. You can also make your story visually compelling and easily readable with header text, additional images, and highlights of key takeaways. Anyone looking at a Notebook can click on the chart to go directly to the query and explore the analysis further. One important step towards a culture of discussion and collaboration around data!
For more details on how Notebooks works, check out our documentation. If you’ve already been using Notebooks, awesome! We recently made some updates.
How to create a new Notebook in Amplitude
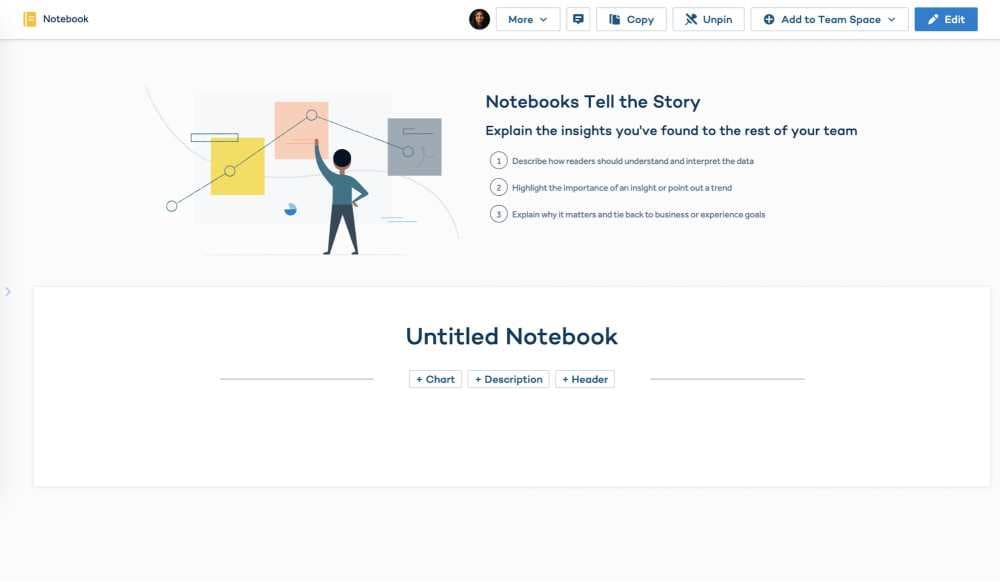
Our hope is that Notebooks helps you communicate important learnings about your users with the right level of detail and context to your teams. Feedback from early adopters shows that teams that use Notebooks have more productive discussions and collaboration around using data to build a great product.
Our hope is that Notebooks helps you communicate important learnings about your users with the right level of detail and context to your teams.
When to make a Notebook?
When does it make sense to craft a story about your analysis with a Notebook, and when should you just add charts to a dashboard? Good question.
Dashboards are great for monitoring North Star metrics and KPIs.
Use Notebooks when your analyses follow a narrative. Notebooks are great when you want someone to be able to follow the logic that led you to run a query or experiment.
Notebooks are great when you want someone to be able to follow the logic that led you to run a query or experiment.
Here are some situations where Notebooks can help communicate the full story of your analysis.
Create a Notebook to share an interesting discovery about user behavior (like this)
Explore this Notebook yourself!
Kate is a product manager who cares specifically about new user activation and retention at AmpliTunes, a music and video streaming app.
While Kate was looking at engagement and adoption of the new Playlist feature, she uncovered an interesting behavioral insight that she wanted to share with her team: New users who followed a playlist had much higher Day 1 retention. She created the following Notebook to explain the context of her analysis and her learnings to the team.
Kate’s Notebook looking at the engagement of AmpliTunes’ new Playlist feature.
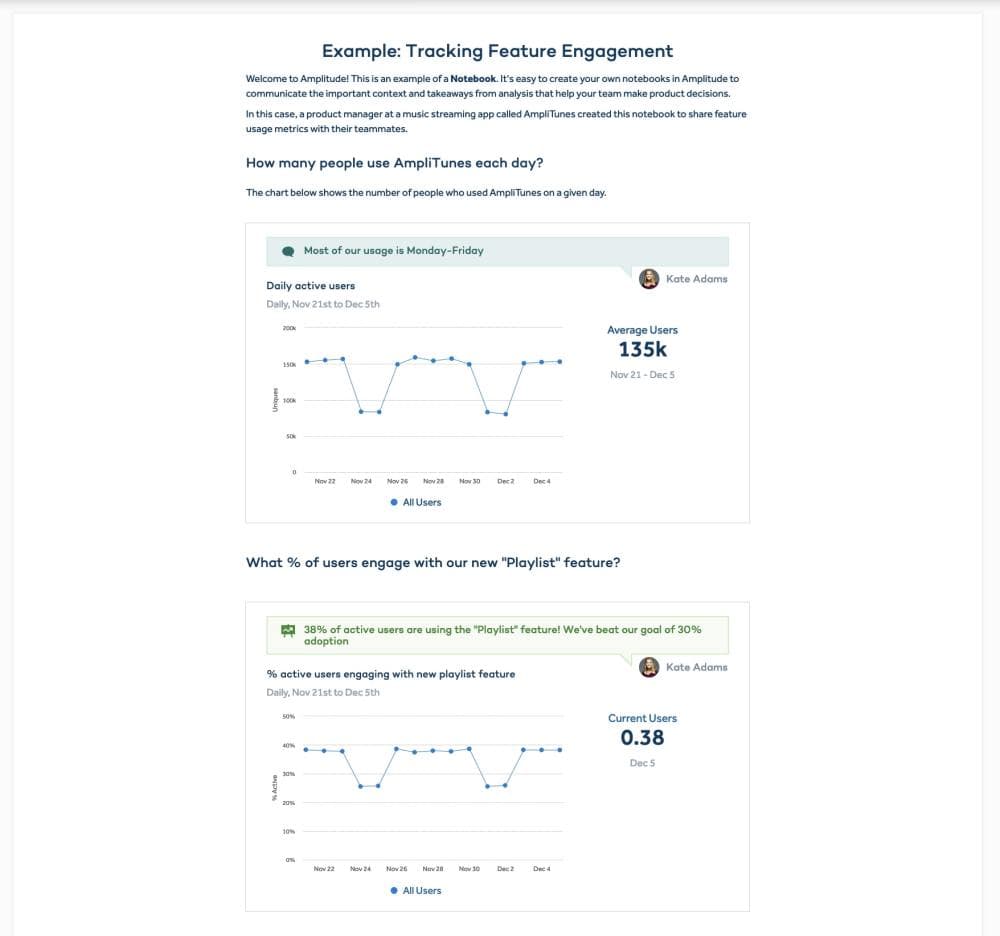
When Kate investigated the funnel leading up to new users following a playlist, she discovered an opportunity: Since many new users were dropping out of the funnel after searching for a song or video, was there something they could do to improve search experience?
Kate’s Notebook looking at the retention of new users who also follow playlists and their conversion rate.
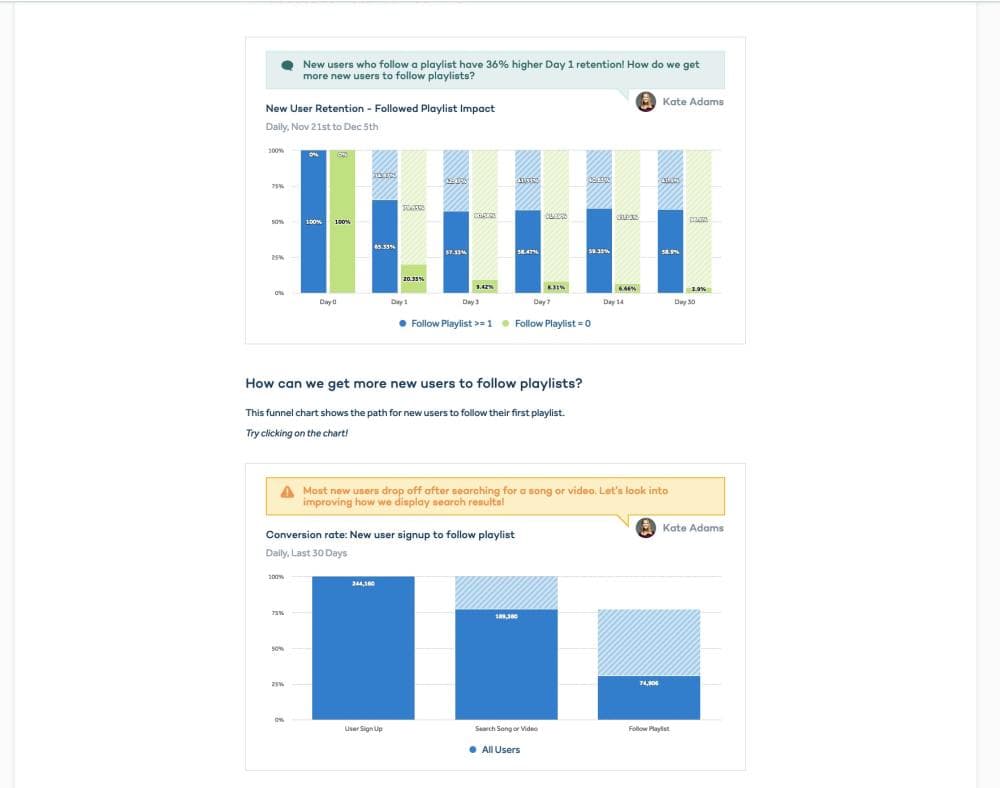
After Kate shared a Notebook on her findings, the team dug into more analyses, tested a few hypotheses, and then finally decided to ship redesign how search results were displayed.
Create a Notebook to share the impact of a product change or engagement campaign on your North Star (like this)
Following the example from above, after they shipped the new redesign of the search page, the product team continued to use a Notebook to share findings on how their change affected conversion rate to following a playlist.
Broadcasting how your product changes impact the team’s overall North Star through a Notebook can spark more discussion and enable better collaboration around long-term product strategy.
Explore this Notebook yourself!
Create a Notebook to share the result of an A/B test (like this)
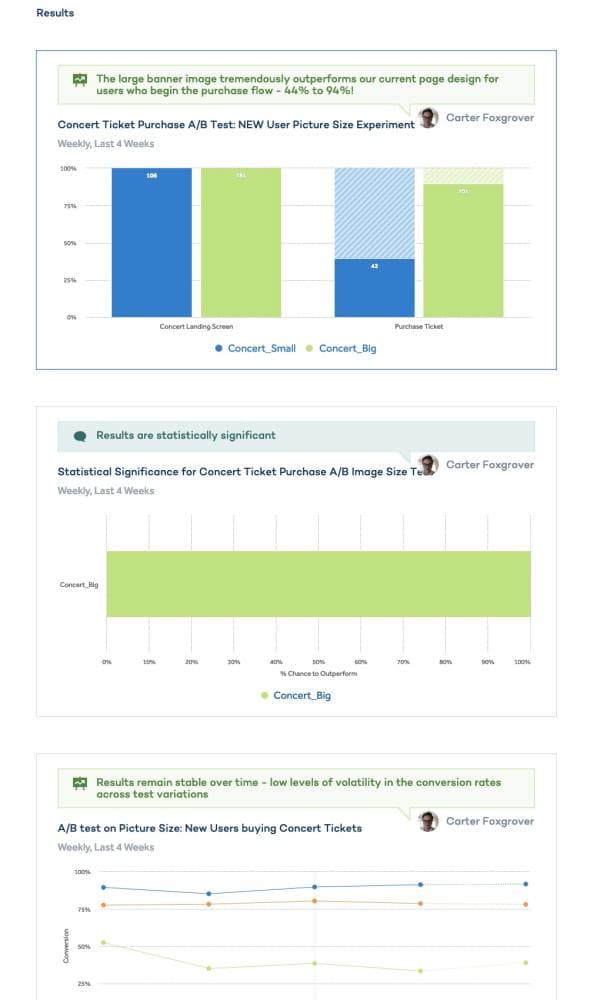
One of the things the Growth Squad at AmpliTunes cares about is driving concert ticket purchases in AmpliTunes’ marketplace. They created the following Notebook to share the context and results of a successful A/B test.
After seeing that most of their competitors had larger images on their concert landing pages, the Growth Squad tested whether a large banner image would result in higher purchase conversion.
First part of the AmpliTunes Growth Squad’s Notebook about an A/B test, explaining the team’s hypothesis that large pictures will improve conversion. To bring more context, the team included an image from a competitor’s landing page.
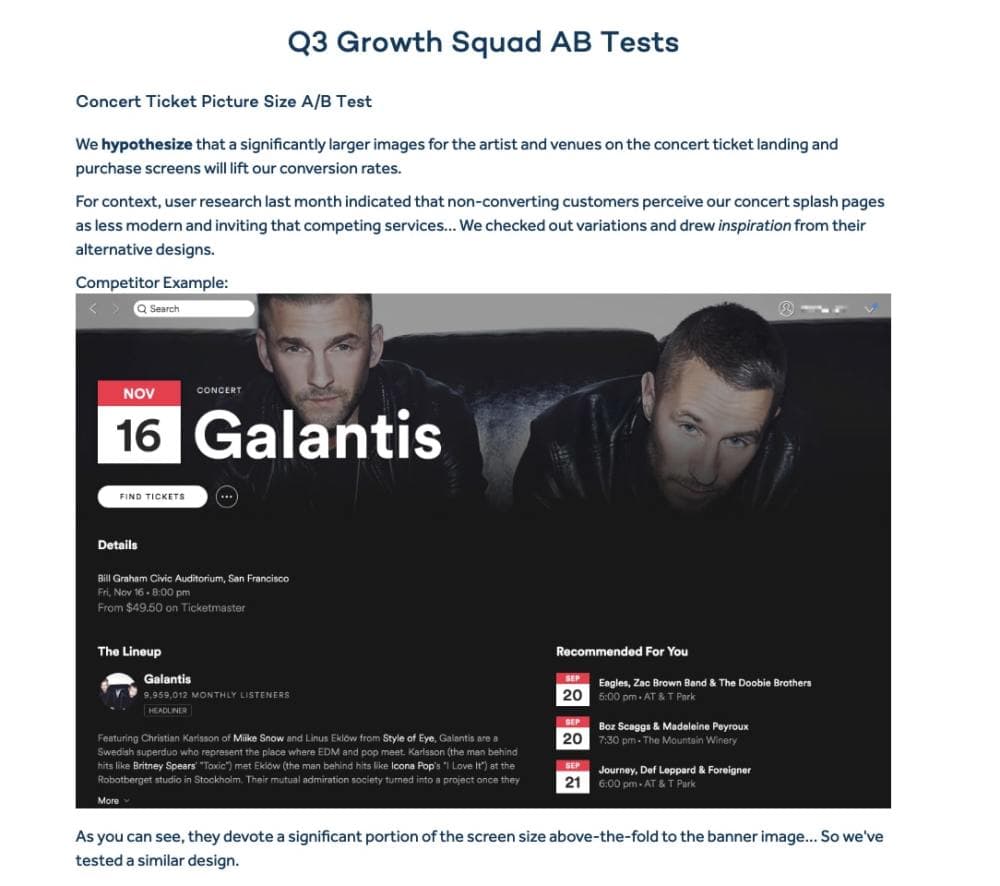
The team then synthesized the results of their experiment in the Notebook by including relevant Amplitude charts and key takeaways.
The AmpliTunes Growth Squad’s Notebook, sharing results of the A/B test.
Explore this Notebook yourself!
Use a Notebook to educate new teammates on how to use Amplitude
Some Amplitude power users shared a very clever use case: use Notebooks to help onboard new team members onto Amplitude and to educate them about their org’s product data.
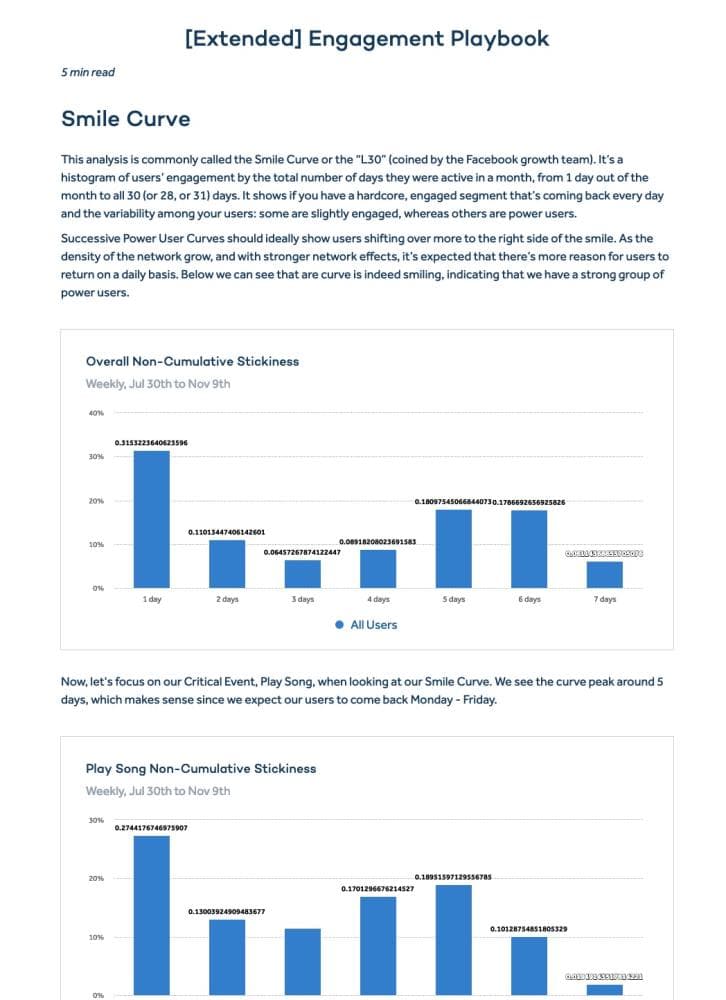
Similarly at Amplitude, our team has explored creating educational Notebooks around the concepts introduced in our Product Analytics Playbooks. For example, in the Notebook below, we introduce the concept of the ‘Smile Curve’ or non-cumulative stickiness.
The advantage of creating educational content like this in Notebooks is that novice users can click right into the charts and begin exploring the data themselves to reinforce what they’ve learned.
An Amplitude Notebook based on the content from our new product analytics playbook, Mastering Engagement.
Next steps
Winning teams like Netflix and Airbnb that systematically loop through the four building blocks of growth need to make sure they have buy-in and understanding at every stage—from generating hypotheses to broadcasting impact.
Notebooks help you communicate the full story around your insights. The ability for anyone to be able to create and find these stories within Amplitude increases overall trust in the data and creates a shared understanding of the meaning behind the charts. We believe this leads to faster, frictionless collaboration and, ultimately, better business growth.
Notebooks help you communicate the full story around your insights.
Here’s a quick video that outlines how to tell a great story using Notebooks. (And for more details on how to set up your own Notebook take a look at our documentation.)
https://www.useloom.com/share/24f459b2a221478db86b8d07e7f75310
Try Notebooks for yourself! Explore our demo.

Archana Madhavan
Senior Learning Experience Designer, Amplitude
Archana is a Senior Learning Experience Designer on the Customer Education team at Amplitude. She develops educational content and courses to help Amplitude users better analyze their customer data to build better products.
More from Archana


