Find the Key to Your App’s Growth Without an Army of Data Scientists
Want to find your app’s ‘magic threshold’ that users need to cross to become fully engaged?
You’ve probably heard of Facebook’s famous indicator: adding 7 friends in 10 days is the leading metric for users that stay engaged on the social network. Want to find your app’s ‘magic threshold’ that users need to cross to become fully engaged, but don’t think you have the data science chops to figure it out? We’re about to lay out the simple way that analytics can uncover the key to your users’ behavior and help you with app growth.
First things first: what does “success” mean for you?
Before you can find your engagement indicator or ‘magic threshold’ — your app’s equivalent of ‘7 friends in 10 days’, you need to define what “success” means for you. What is your priority? If you’re a game with in-app purchases, your goal is revenue and user lifetime value (LTV). For most other apps not centered on monetization (at least not yet), your main focus should be retention.
Once you know your business goal, it’s time to turn that into a concrete metric.
Where’s the magic threshold?
Now it’s time to start looking at the data. Talk to your users and get a sense for the value they derive from your product — what keeps them coming back, and what do they like to use the app for? Gathering this qualitative data will give you a starting point of where to look in your quantitative data.
Based on user feedback and your ideas about which actions are relevant to engagement, you can now test your hypotheses and break your assumptions. Compare your ‘successful’ users to your ‘unsuccessful’ users — what actions are the successful users taking? Think back to the Facebook example. Say we’ve decided that our measure of success is user retention at 2 months post-signup. We’re looking at the data, and 3 main actions seem to emerge: adding friends, posting updates, and ‘liking’ things. We think these 3 activities might lead to someone sticking around for 2 months.
Behavioral cohorting
The next step is to test which of these user actions may actually be a good predictor of success. A great way to dig into this is by grouping users into cohorts based on their behavior and then testing how outcomes differ by cohort.
Let’s say that after looking at the patterns of actions that highly engaged users perform, the Facebook team has a few main hypotheses for which actions, when completed in the first 10 days, drive retention:
- adding 7 friends
- posting 5 updates
- ‘liking’ 20 things
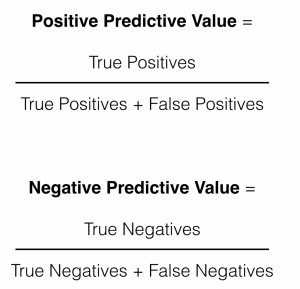
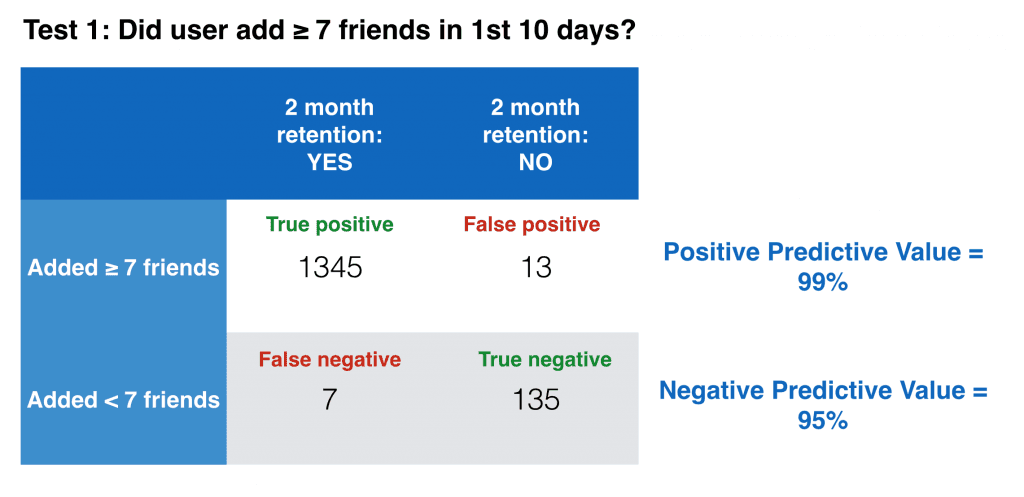
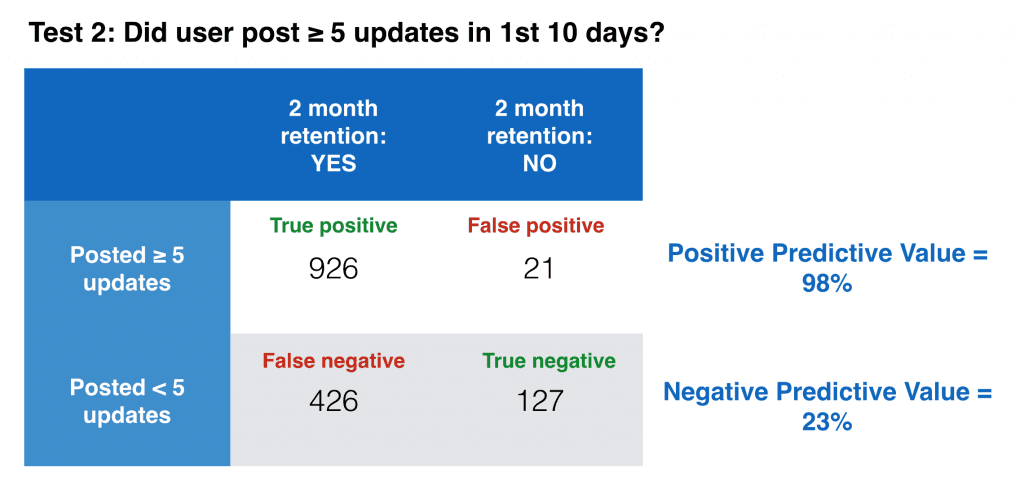
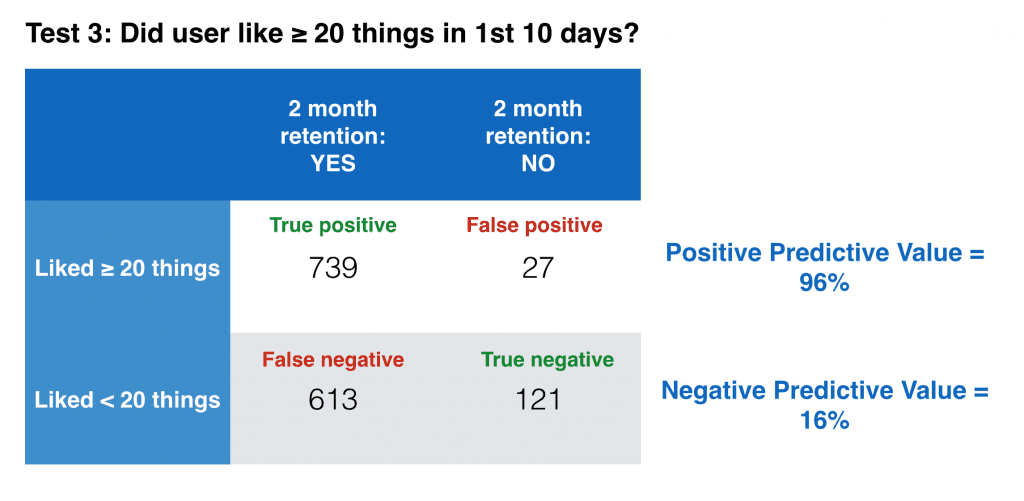
Let’s define a cohort for each of these actions, and then compare how each group performs for retention 2 months after sign-up using a binary classification test on sample data. We can then look at the positive and negative predictive values (defined below) for each test and find out whether any of them may be the magic threshold we’re looking for.
** **


Clearly, adding 7 friends wins. Adding at least 7 friends has a strong positive predictive value for 2 month retention, and conversely, adding fewer than 7 friends has a strong negative predictive value. This makes it a good test for predicting the 2 month retention: hit the mark, and there’s a 99% chance you’ll stick around; add less than 7 friends, and there’s a 95% chance you won’t.
While posting 5 updates and liking 20 things correlate well with retention (and therefore have strong positive predictive values), they fall short of our magic metric criteria. A user who fails to do these things still has a pretty good chance of being an active user 2 months out.
So far, adding 7 friends is looking like our magic threshold. Another key point to assess is the value of getting your user to complete the action. In other words, look at how much getting someone to add 7 friends will increase the likelihood that they’re still around in 2 months. When we crunch the numbers, adding 7 friends increases the chance of 2 month retention by almost 20-fold, while adding 5 posts and liking 20 things don’t even double the likelihood of retention (increase by 1.3-fold and 1.1-fold, respectively). Obviously, it’s well worth your time and effort to make sure your users add 7 friends.
Keep it simple
Two important things when deciding on this magic threshold: keep it concrete and simple. If it involves too many different actions, it will be hard to measure and will likely change over time. It will also take away focus from your team — which brings us to our next step.
Take action
Now that you’ve identified that key indicator, the threshold one must cross to become a happy, engaged user, it’s time to do something about it. Optimize everything about your signup and onboarding process around encouraging that action. You want your users to reach the threshold as soon as possible. Do some A/B testing and see what can drive an increase in your success metric. Focus on your magic threshold, and you’ll see engagement and retention increase.

Alicia Shiu
Former Growth Product Manager, Amplitude
Alicia is a former Growth Product Manager at Amplitude, where she worked on projects and experiments spanning top of funnel, website optimization, and the new user experience. Prior to Amplitude, she worked on biomedical & neuroscience research (running very different experiments) at Stanford.
More from Alicia


