Amplitude Google Sheets Add-On
Learn how you can embed Amplitude data into Google Sheets.
As a former analyst, I am used to spending time in spreadsheets. I used to be a wiz at MS Excel, but nowadays, most people use Google Sheets as their spreadsheet of choice. When I ran digital analytics teams, there were times when I wanted to export data to a spreadsheet and manipulate it there.
In Amplitude, you can export almost any data set to CSV and then import it into MS Excel or Google Sheets, but if you use Google Sheets, you can export Amplitude data to Google Drive and Google Sheets using this add-on.
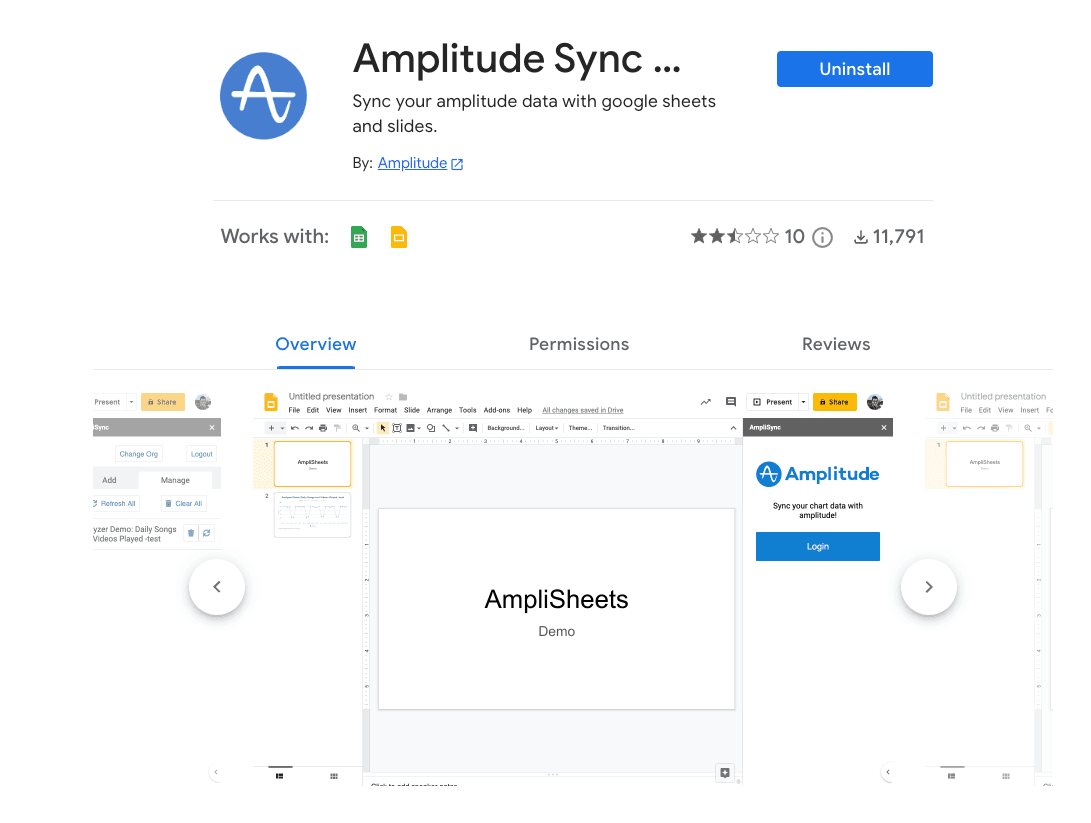
Let’s look at an example to see how the Amplitude Google Sheet add-on can be used. Suppose I want to see how often people view blog posts I have written and view this by city. In Amplitude, I would create a report like this:
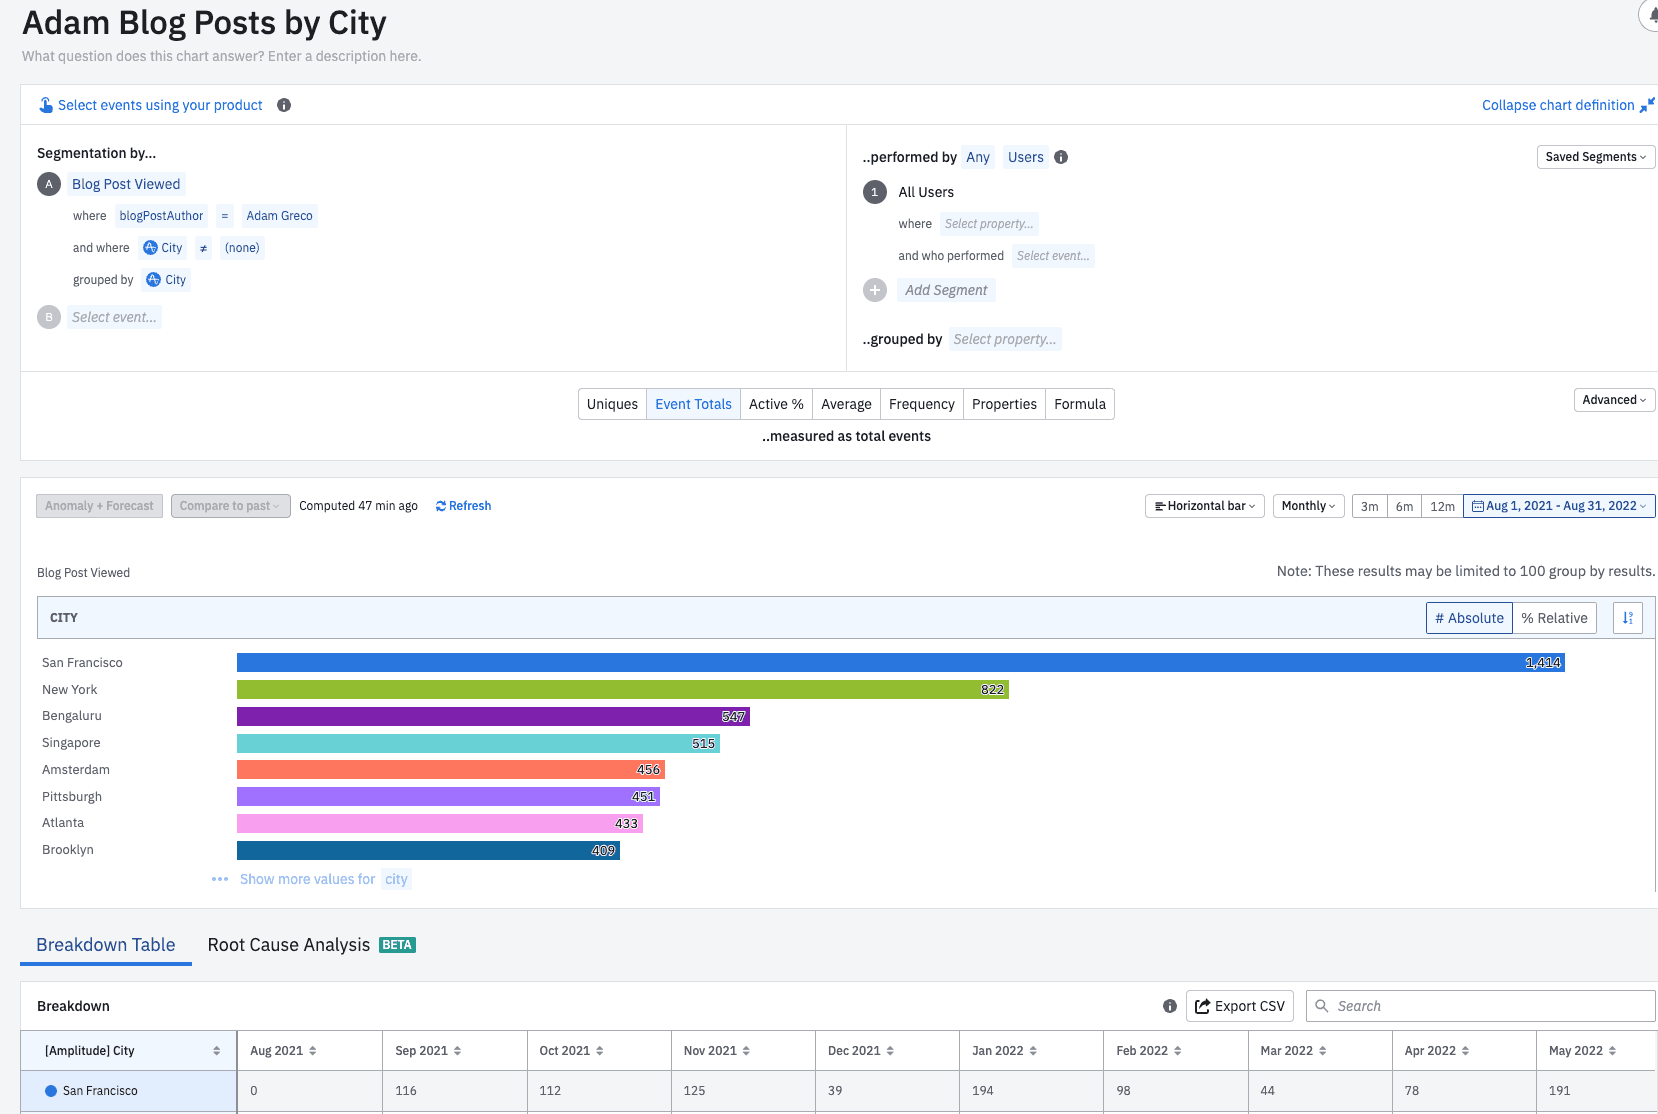
In this report, I am showing Blog Post Views where the author is “Adam Greco” and Grouping by “City” but excluding cases where the city is unknown. Next, you would open a new Google Sheet and choose Extensions – Amplitude Sync to Drive and Sheets from the menu as shown here:

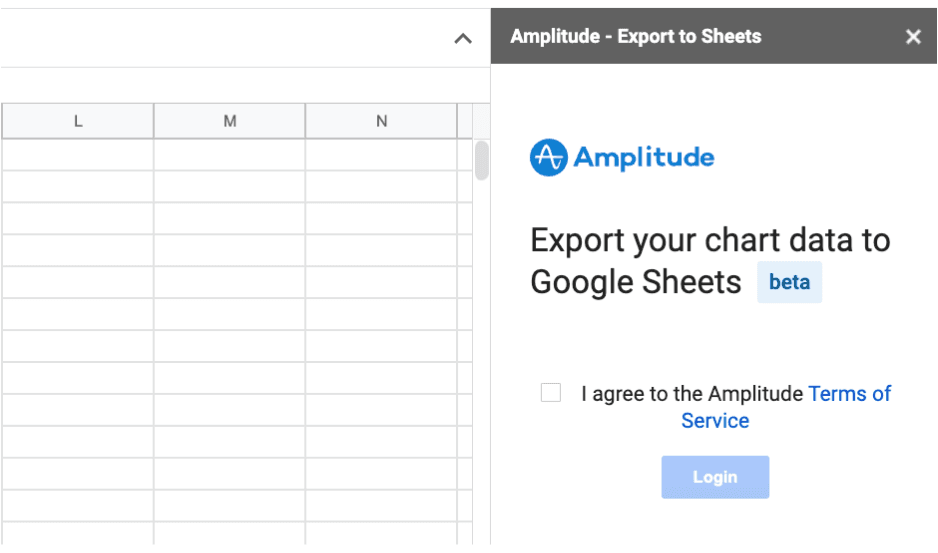
After clicking, you will see the add-on appear on the right side, and you will have to agree to the terms of service, authenticate your Amplitude account, and approve the permissions:
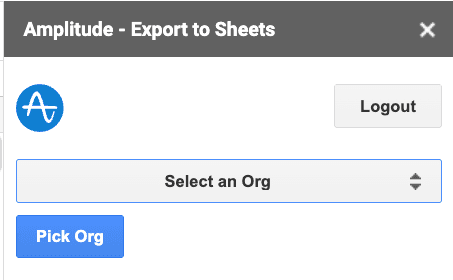
Next, you will see your Amplitude Organizations within the add-on window where you can choose your organization:
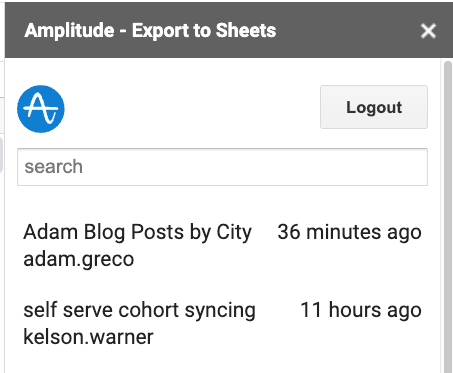
After you select your Amplitude organization, you will see a list of reports. From here, you can search and find the report you want:
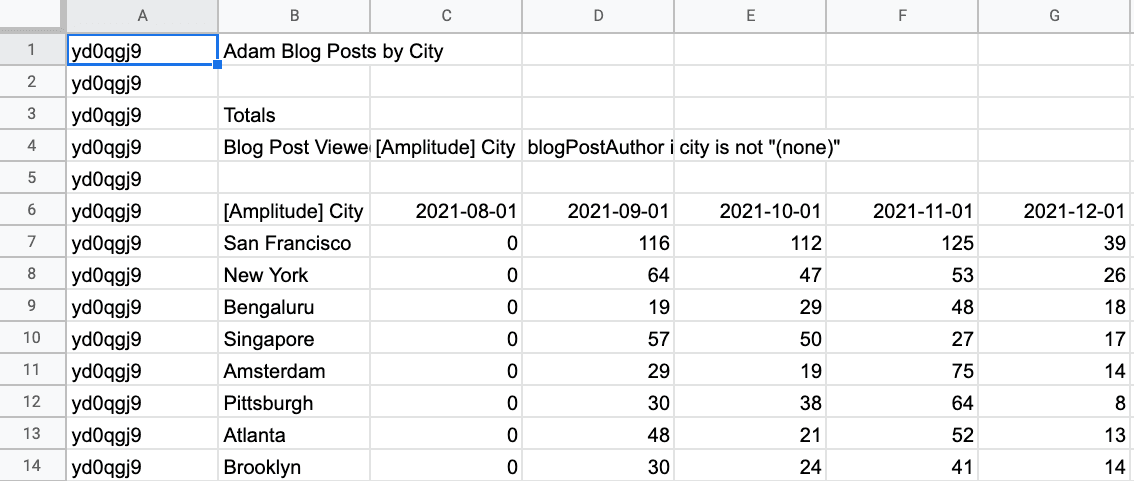
In this case, I will choose the Adam Blog Posts by City, which will insert the data into the Google Sheet (note that the add-on will make a new tab):
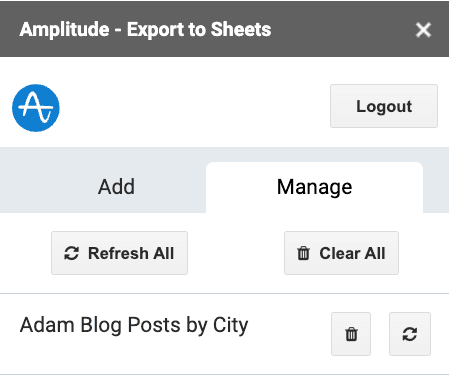
After embedding data in the Google Sheet, you can refresh it anytime using the add-on window:
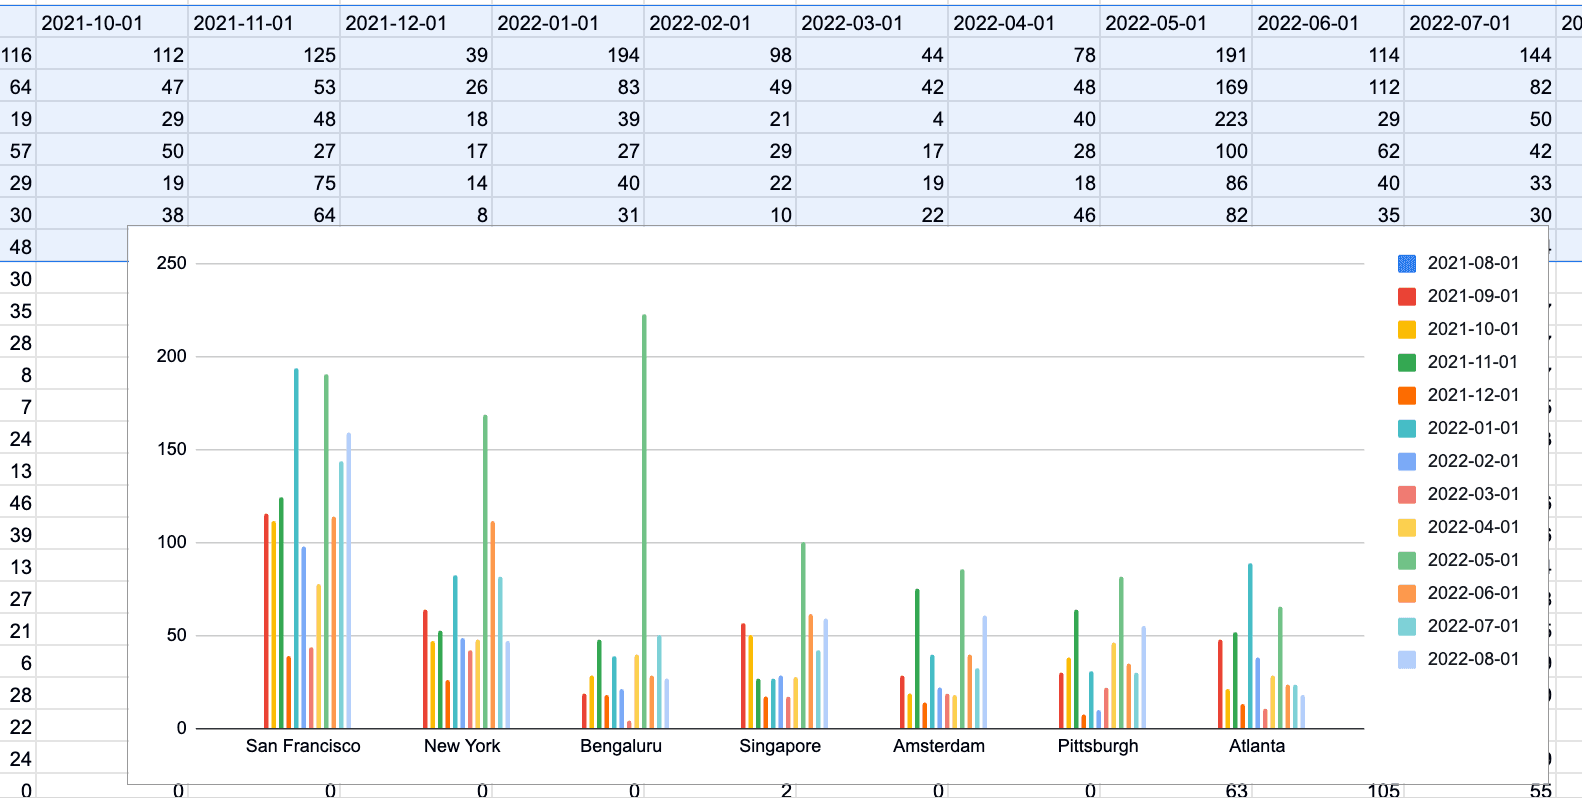
Once you have the data in Google Sheets, you can reference it as any other data set. Therefore, you can create new tables, charts, graphs, etc. based upon your Amplitude data:
If you want to see a short video of me walking through the steps above, see the video below.

Adam Greco
Former Product Evangelist, Amplitude
Adam Greco is one of the leading voices in the digital analytics industry. Over the past 20 years, Adam has advised hundreds of organizations on analytics best practices and has authored over 300 blogs and one book related to analytics. Adam is a frequent speaker at analytics conferences and has served on the board of the Digital Analytics Association.
More from Adam
