How to Analyze the Health of Your App’s Product-Market Fit Through Growth Accounting
Jonathan Hsu, Co-founder and General Partner at Tribe Capital, explains the growth accounting framework and how it can empower product team decision-making.
Data is empowering. At Tribe Capital, our goal is to be great at recognizing and amplifying early-stage product-market fit. We believe that in order to achieve this goal we need to have standard quantitative approaches to understanding product-market fit. We want to empower everyone on the team—developers, designers, salespeople, and marketers—not just data scientists, with an objective evidence oriented understanding of the pattern of product-market fit so that they can work together on amplifying it.
As part of achieving our mission, we have shared our base level frameworks for quantifying product-market fit. Today we will dig into one component of that framework (growth accounting) and apply it to a single metric (monthly active users). This framework enables us to decompose top-line growth into standardized components that can be used to understand the growth of MAU.
The growth accounting framework enables us to decompose top-line growth into standardized components that can be used to understand the growth of MAU.
Growth accounting can actually be applied to any underlying signal of product-market fit whether it be a customer payment or a customer uploading a photo or some other signal of engagement. It should also be noted that growth accounting only represents one third of our full approach to quantifying product-market fit. Alongside the other two frameworks which focus on cohort analysis and concentration analysis, growth accounting forms a crucial component in our approach to understanding and quantifying early-stage product-market fit.
Growth accounting can actually be applied to any underlying signal of product-market fit.
Related Reading: A Quantitative Approach to Product Market Fit
The Growth Accounting framework
In growth accounting, we break down overall growth into growth across specific user segments. That helps us understand the underlying quality of our growth and whether it’s sustainable.
We can use growth accounting to analyze the growth of any activity. Most commonly, growth accounting is used to analyze revenue and monthly active users (MAUs), but it could also be used for specific activities inside of the app like uploading photos, commenting, liking, etc.
Most commonly, growth accounting is used to analyze revenue and monthly active users (MAUs).
Let’s assume that the activity we’re analyzing is MAUs. There are four categories that revenue can be bucketed into:
- New: Gained from users who were first active in the present month.
- Churned: Lost when a user who was active in the previous month has no activity in the present one.
- Resurrected: Gained from users who had churned at some point in the past (and thus generated no activity in the previous time period) but resumed in the present.
- Retained: Carried over by customers from the previous time period to the present one.
Note that because MAU is binary—a user is either active or not—the additional segments of expansion and contraction don’t apply to MAU growth accounting. Compare that to customer revenue where the activity is ordinal and represented by a value that can increase or decrease from month to month.
There are three important identities that express the definitions above:
- All revenue in the present time period is equal to the sum of the gains in revenue (new, resurrected, and expansion) and retained revenue.
MAU(t) = retained(t) + new(t) + resurrected(t)
- All revenue from the previous time period must either churn or be retained in the present time period.
MAU(t-1) = retained(t) + churned(t)
- All change in revenue across a time period is equal to the sum of the gains (new and resurrected) minus the sum of the losses (churned and contraction).
MAU(t) – MAU(t-1) = new(t) + resurrected (t) – churned(t)
For the last identity, we can convert the terms into percentages (e.g., “% New” is new revenue divided by total revenue from the previous time period) to frame everything in terms of the overall growth rate.
Growth_rate ~ New_rate + Resurrected_rate – Churn_rate
There are three useful statistics that come out of growth accounting:
- Gross retention is equal to retained MAU divided by total MAU from the previous time period.
Gross retention = retained(t) / MAU(t-1)
- Quick ratio is the sum of gains in revenue (new, resurrected, and expansion) divided by the losses in revenue (churned and contraction).
Quick ratio = [new(t) + resurrected(t)] / churned(t)
Quick ratio measures how efficiently a company is growing in terms of MAU gained per every unit of MAU lost. (By its definition, a quick ratio below 1.0x means that total MAU must be shrinking.)
Quick ratio measures how efficiently a company is growing in terms of MAU gained per every unit of MAU lost.
- Net churn is the sum of losses minus gains in revenue from existing customers only (i.e., excluding new customers) divided by total revenue from the previous time period.
Net_Churn = [churned(t) – resurrected(t)] / MAU(t-1)
Note that, by definition…
Growth_rate ~ New_rate – Net_churn
With these statistics, we can compare similar apps against each other to understand where they perform well and where they could improve. From there, we know if we should invest in growth, and if so, where to invest to amplify product-market fit.
App A vs. App B—which one is healthier?
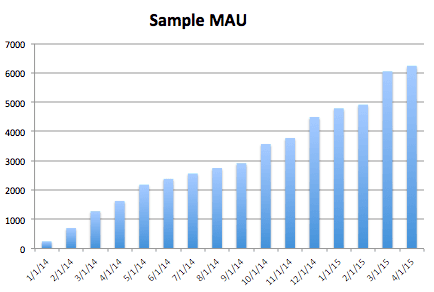
Let’s pretend that we have two mobile consumer apps, both of which have the same stellar growth in MAUs of ~12% month-over-month over a 12-month period. Note that MAUs are all users who have engaged in some predefined activity in a given month, like logging in, uploading a photo, adding a comment, or something similar.

While both apps look equally impressive on the surface, going one level deeper to understand the nature of the growth tells a totally different story. When we break down each app’s MAUs into its component parts, we can see that one company’s growth is much healthier.

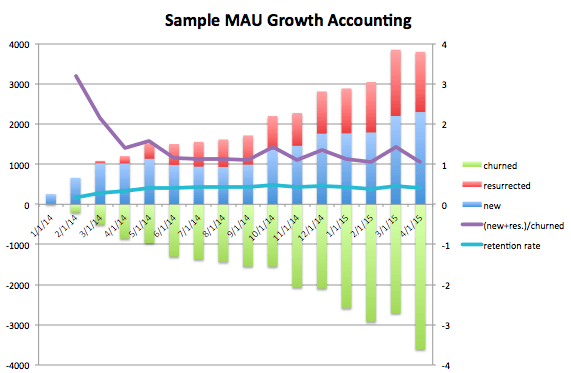
With a 40% gross retention rate, mobile app A churns 60% of its active user base every month. Mobile app A’s quick ratio has been fluctuating between 1 and 1.5, which means that for every three new users the company adds, it is also losing two to three users to churn. That churn, however, is masked by new users who sign up for the app and show activity in that month. While app A’s churn isn’t necessarily increasing, it’s not decreasing either in spite of the new features and improvements being added to the app.
While app A’s churn isn’t necessarily increasing, it’s not decreasing either in spite of the new features and improvements being added to the app.
This is a so-so situation for a consumer app. Most consumer applications have weak retention, which results in a quick ratio of just above 1. This consumer app dynamic is typical—add a bunch of users and simultaneously lose a bunch of users with a small additive piece on top from resurrection, yielding overall small positive growth.

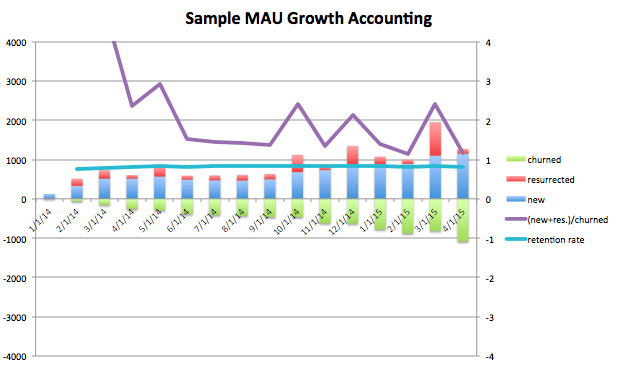
Mobile app B has the exact same top-line MAU growth as mobile app A, and it accomplishes that without the new user contribution that mobile app A has by retaining active users at a much higher rate. Whereas mobile app A only retains four active users out of every 10, mobile app B retains nine users out of 10. That means mobile app B needs less new user acquisition to achieve the same growth.
Whereas mobile app A only retains four active users out of every 10, mobile app B retains nine users out of 10.
Because of its higher rate of user retention, we would consider mobile app B to have healthier growth and a higher degree of product-market fit. Mobile app A has an underlying churn problem that speaks to a core product issue that can be extremely challenging to fix. Mobile app B retains users well, which means that it’s in a position to push harder on the top of the funnel to drive new user signups and very efficient growth.
Because of its higher rate of user retention, we would consider mobile app B to have healthier growth and a higher degree of product-market fit.
Aligning the company around ground truth
Growth accounting provides a simple framework for everyone on the team to get on the same page about data that objectively describes the health of your app’s product-market fit. We call this getting to “ground truth”—which means ensuring that everyone in the organization is aligned around how the app is performing and where the opportunities are for it to improve.
When everyone on the team has access to data, they’re empowered to act on it to amplify product-market fit. Data becomes a platform that the team can plug into to do their best work and contribute to the growth of the business.
When everyone on the team has access to data, they’re empowered to act on it to amplify product-market fit.

Jonathan Hsu
Co-Founder and General Partner, Tribe Capital
Jonathan is one of the founding General Partners at Tribe Capital where he focuses on recognizing and amplifying early stage product-market fit by combining the best of modern data science and analytics with traditional venture capital. Prior to Tribe Capital, Jonathan was a Partner and SVP of Quantitative Investing and Data Science at Social Capital which he joined after spending several years at Facebook where he helped to form and lead the Data Science and Analytics organization. Jonathan holds a PhD in Theoretical Physics from Stanford.
More from Jonathan


